Orientational transitions in symmetric diblock copolymers on rough surfaces
Abstract
We present a model addressing the orientation transition of symmetric block copolymers such as PS/PMMA on smooth and rough surfaces. The distortion free energy of parallel and perpendicular lamellar phases in contact with a rough solid surface is calculated as function of the surface roughness amplitude and wavelength, as well as the polymer lamellar periodicity (molecular weight). We find an analytical expression for the orientation transition. This expression is compared and agrees well with recent experiments done with six different polymer molecular weights and surface preparations.
As self-assembling systems become better understood, more emphasis is being given to finding ways to control the assembled structure, i.e. to orient ordered phases in a certain direction or anneal defects thomas_rev ; grier ; sancaktar . Block copolymers (BCP) are excellent model systems, which provide a good balance between price and chemical versatility, and are being extensively studied for technological applications as well as from a basic scientific viewpoint leibler ; schick . There are numerous ways to affect the BCP phase-behavior and orientation. For example, using shear flow GHF , confinement between two solid surfaces muthu1 ; TA1 , or application of an external electric field AH93 ; russell ; krausch ; muthu2 ; TA2 .
In this note we consider a lamellar phase of symmetric diblock copolymers (each block has a mole fraction of ) on top of a rough surface. The amplitude and periodicity of surface modulations determine if the lamellae will be parallel or perpendicular to the substrate TJ ; chakra , as has been recently shown experimentally by Sivaniah et al hash1 ; hash2 . This new and alternative method to orient BCPs can be advantageous to the methods mentioned above because of its simple experimental setup. The aim of this Note is to extend results of a previous theoretical modelling TA3 showing its direct applicability to the experimental findings hash1 ; hash2 .
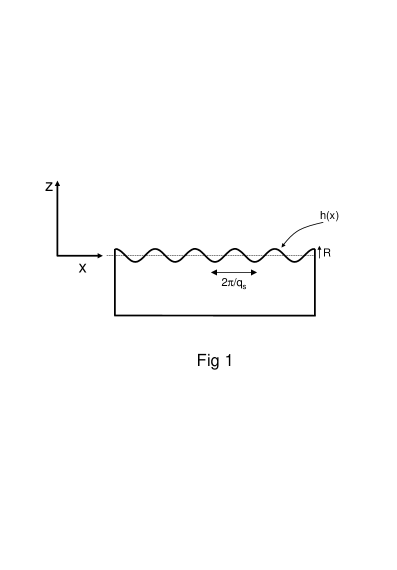
The surface roughness is modelled by a single one-dimensional corrugation mode, whose height in the -direction above an reference plane is given by . As is shown on Fig. 1, and are the wavenumber and amplitude of the surface roughness, respectively. The BCP is put above the substrate in the half-space . In addition, is the wavenumber of the bulk lamellae of width , is the interfacial interaction (per unit area) between the A and B blocks in the polymer chain, and is the surface tension difference between the substrate and the two types of polymer blocks.
We start by examining the order-parameter of lamellae oriented perpendicular to the surface. The presentation follows the same lines as of Ref. TA3 :
| (1) |
This is the deviation of the A-monomer relative concentration from its average value . The amplitude of sinusoidal variation, , depends on the degree of segregation and vanishes at the Order-Disorder Temperature (ODT). The function is a slowly-varying function that describes surface-induced perturbations of the lamellae from their perfect shape. We write the bulk part of the free energy, in complete analogy with the elastic energy of smectic liquid crystals TJ ; PGGP :
| (2) |
where , , is the bending modulus and is the compression modulus.
Several assumptions are made regarding the length scales and energies involved, as are explained in more detail in Ref. TA3 :
| (3) |
and
| (4) |
We will be mainly interested in the poly(styrene)/ poly(methylmethacrylate) system, where the A-block is chosen as the PS and the B-block as PMMA. The corresponding parameters are mN/m for the surfaces considered below, and mN/m, so eq 4 roughly holds. The inequalities in eq 3 are not satisfied in all the experiments. While is indeed larger than , is between 1 and 4 and is not smaller than unity as assumed. Therefore, does not strictly hold. Nevertheless, using the above inequalities we were able to make simple analytical predictions by minimizing the energy with respect to the distortion field . Up to numerical prefactors, the bulk free energy of the perpendicular state is TA3
| (5) |
where is the surface area.
We repeat the same calculation as above but now for parallel lamellae. The order parameter is given by
| (6) |
and the bulk free-energy is
| (7) |
We minimize the distortion field in the same limits as in eqs 3 and 4, and find TA3
| (8) |
Equations 5 and 8, use the surface energy to obtain the distortion field . We now add this substrate-BCP interfacial tension and compare the gain and loss in the total free energy of the two states, including the bulk distortion and interfacial tension terms. This was not done in Ref. TA3 . In the case of perpendicular lamellae, the substrate is approximately equally covered by the A and B monomers (the symmetric case of PS/PMMA). Hence, adding the interfacial-tension term to eq 5 results in the following free-energy
| (9) | |||||
The extra factor is the ratio between the real surface profile and the flat one, , for small surface corrugations.
For parallel lamellae, we have a surface in contact with a layer rich in B monomers (PMMA). Neglecting surface proximity effects, we consider that this layer has a concentration of B-monomer with amplitude and A-monomers (PS) with amplitude , recalling that is the deviation of the order parameter from . The energy is , and the total parallel free-energy becomes
In order to find the orientation transition, we equate to [eqs 9 and Orientational transitions in symmetric diblock copolymers on rough surfaces] while estimating . The transition value of is given by:
| (11) |
Note that this equation includes the information of the melt segregation via (). Naturally, as the temperature approaches the ODT, tends to zero the energetic difference between the parallel and perpendicular states goes to zero as well.
In order to compare these predictions of the lamellar orientation dependence on the various roughness parameters, we used some of the results reported in Ref. hash2 . In that paper sample orientation was determined by a combination of cross-sectional TEM microscopy, atomic force microscopy and dynamic secondary-ion mass spectroscopy. The principle result was to demonstrate that an increase in the substrate roughness amplitude, , led to a transition from parallel to perpendicular orientation, while other substrate parameters were untouched.
Six observations of orientation were also made with three molecular weights of symmetric PS-PMMA block copolymer (of different ) on four substrates of different . We can use these observations to test the validity of our current theoretical model. The BCP samples are denoted 18k-18k, 38k-36.8k and 50k-54k, according to the molecular weight of PS and PMMA blocks in the chain, respectively. The four substrates are: super-critically rough Indium Tin Oxide (SC-ITO), under-critically rough ITO (UC-ITO), smooth ITO (S-ITO) and super-critically rough polyimide (SC-PIM). All the experimental parameters are summarized in Table I. The prefixes of and were used to denote the degree of roughness of the substrates. The SC-PIM substrate was made by imprinting a polyimide surface with a SC-ITO surface. Therefore, SC-PIM and SC-ITO had identical topological features. Contact angle measurements at C on all of the substrates revealed that there was no large difference in the wetting properties of PS and PMMA on all of these substrates. For more details see Ref. hash2 .
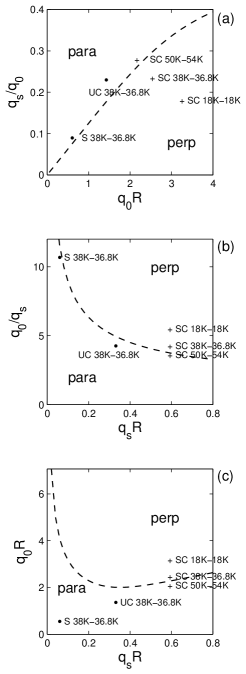
An assumption of identical substrate surface energy allows all six observations to be collated onto a single orientational phase diagram. In Fig. 2 we plot the experimental points and the transition lines predicted by eq 11 on three types of plots. In part (a), is used to scale the two other parameters: and and to produce two dimensionless parameters for the plot: and . In the range of experimental parameters, the transition line between parallel and perpendicular states, eq 11, is very close to a straight line (up to about in Fig. 2(a)). Namely, for a fixed , .
Our above findings should be compared with a previous model by Turner and Joanny TJ that predicted an orientation transition at and independent of . Because of the limited number of experimental systems, it is hard to rule out any theoretical fit. However, it looks that the latter prediction does not fit well the experiments summarized in Fig. 2. In our model the limit of is obtained by formally setting in eq 11. However, we note that the validity of our model, as well as the experiments, is in the opposite limit of . Figure 2 (a) shows that all samples found to be in the parallel morphologies in the experiments lie indeed above the theoretical transition line and all perpendicular morphologies lie below it, with the exception of the SC-ITO 50k-54k sample, which lies a little inside the parallel region, although it is measured as a perpendicular state.
The same information is presented differently in parts (b) and (c) of Fig. 2. In (b) we think of as the rescaling factor and plot as function of . From eq 11 and under the condition , we get . In Fig. 2 (b) we see again that beside the SC-ITO 50k-54k sample, all other data points fit with the theoretical prediction. And finally in Fig. 2 (c), and are rescaled by .
The phase diagrams in parts (b) and (c) may seem counter-intuitive at first sight. At a given surface roughness , the transition from the parallel phase to the perpendicular one occurs as decreases (or increases). This surprising behavior can be understood by looking at the dependence of the distortion field on the distance from the surface. For perpendicular lamellae, , where . Hence distortions relax at a distance from the substrate comparable to the lamellar spacing. Undulations in the parallel phase, however, are given by , where . As the BCP molecular weight decreases, decreases, increases, and decreases, resulting in a longer extent of the distortion field in the direction. Hence, the accumulated frustration of parallel lamellae leads to their relative instability towards the perpendicular phase. In other words, the smaller the molecular weight is, the more stable the perpendicular lamellae tend to be.
More experiments should be carried out so that the phase-diagram can be fully mapped. In particular the above-mentioned effect should be further explored, giving special attention to the possible creation of island and holes or other defects which are not included in this simple theoretical framework.
Acknowledgements
Partial support from 21st century COE program, COE for a United Approach to New Materials, the United States-Israel Binational Science Foundation (BSF) under grant No. 287/02 and the Israel Science Foundation under grant No. 210/01 is gratefully acknowledged.
References
- (1) Park, C.; Yoon, J.; Thomas, E. L. Polymer 2003, 44, 6725.
- (2) Grier, D. G. Nature 2003, 424, 810; Dufresne, E. R.; Grier, D. G. Rev. Sci. Instr. 1998, 69, 1974.
- (3) Lyuksyutov, S. F.; Vaia, R. A.; Paramonov, P. B.; Juhl, S.; Waterhouse, L.; Ralich, R. M.; Sigalov, G.; Sancaktar, E. Nature Materials 2003, 2, 468.
- (4) Leibler, L. Macromolecules, 1980, 13, 1602. Ohta, T.; Kawasaki, K. Macromolecules 1986, 19, 2621.
- (5) Matsen, M. W.; Schick, M. Phys. Rev. Lett. 1994, 72, 2660.
- (6) Riise, B. L.; Fredrickson, G. H.; Larson, R. G.; Pearson, D. S. Macromolecules 1995, 28, 7653. Koppi, K. A.; Tirrell, M.; Bates, F. Phys. Rev. Lett. 1993, 70, 1449.
- (7) Petera, D; Muthukumar, M. J. Chem. Phys. 1998, 109, 5101.
- (8) Tsori, Y.; Andelman, D. J. Chem. Phys. 2001, 115, 1970. Tsori, Y.; Andelman, D. Eur. Phys. J. E 2001, 5, 605.
- (9) Amundson, K.; Helfand, E.; Quan, X; Smith, S. D. Macromolecules 1993, 26, 2698.
- (10) Thurn-Albrecht, T.; Schotter, J.; Kästle, G. A.; Emley, N.; Shibauchi, T.; Krusin-Elbaum, L.; Guarini, K.; Black, C. T.; Tuominen, M. T.; Russell, T. P. Science 2000, 290, 2126.
- (11) Böker, A.; Knoll, A.; Elbs, H.; Abetz, V.; Müller, A. H. E.; Krausch, G. Macromolecules 2002, 35, 1319.
- (12) Ashok, B.; Muthukumar, M.; Russell, T. P. J. Chem. Phys. 2001, 115, 1559. Pereira, G. G. ; Williams, D. R. M. Macromolecules 1999, 32, 8115. Tsori, Y.; Andelman, D. Macromolecules 2002, 35, 5161.
- (13) Tsori, Y.; Tournilhac, F.; Andelman, D.; Leibler, L. Phys. Rev. Lett. 2003, 90, 145504. Tsori, Y.; Tournilhac, F.; Leibler, L. Macromolecules 2003, 36, 5873.
- (14) Turner, M. S.; Joanny, J.-F. Macromolecules 1992, 25, 6681.
- (15) Podariu, L.; Chakrabarti, A. J. Chem. Phys. 2000, 113, 6423.
- (16) Sivaniah, E.; Hayashi, Y.; Iino, M.; Hashimoto, T.; Fukunaga, K. Macromolecules 2003, 36, 5894.
- (17) Sivaniah, E.; Hayashi, Y.; Matsubara, S.; Kiyono, S.; Hashimoto, T.; Fukunaga, K.; Kramer, E. J.; Mates, T. Macromolecules 2005, 38, 1837.
- (18) Tsori, Y.; Andelman, D. Macromolecules 2003, 36, 8560.
- (19) de Gennes, P. G.; Prost, J. The Physics of Liquid Crystals, 2nd Edition (Oxford University Press, Oxford, 1993).
| surface | [nm-1] | [nm] | 18k-18k | 38k-36.8k | 50k-54k |
| nm | nm | nm | |||
| rough SC–ITO | 0.04 | 14.5 | perp | perp | perp |
| rough UC–ITO | 0.04 | 8 | para | ||
| smooth S–ITO | 0.016 | 3.2 | para | ||
| rough SC–PIM | 0.04 | 14.5 | perp |