Inelastic neutron scattering study of phonons and magnetic excitations in LaCoO3
Abstract
We have investigated the phonon and the magnetic excitations in LaCoO3 by inelastic neutron scattering measurements. The acoustic phonon dispersions show some characteristic features of the folded Brillouin zone (BZ) for the rhombohedrally distorted perovskite structure containing two chemical formula units of LaCoO3 in the unit cell. We observed two transverse optical (TO) phonon branches along ( ), consistent with previously reported Raman active modes which show remarkable softening associated with the spin-state transition [Ishikawa et al., (Phys. Rev. Lett. 93 (2004) 136401.)]. We found that the softening takes place in the TO mode over the whole BZ. In contrast, the acoustic phonons show no anomalous softening associated with the spin-state transition. The low-energy paramagnetic scattering at 8 K is weak, increasing towards a maximum at meV, consistent with excitation of the nonmagnetic low-spin to magnetic intermediate-spin state of Co3+ ions.
pacs:
75.30.Kz, 76.60.-k, 76.30.FcI Introduction
Lanthanum cobalt oxide LaCoO3 exhibits magnetic-electronic transitions around 100 and 500 K. Heikes et al. (1964); Raccah and Goodenough (1967); Asai et al. (1989, 1994, 1997, 1998) In order to explain these two transitions consistently, a two-stage spin-state transition model has been proposed. Within the model, the 100 K transition is associated with the thermal excitation of Co3+ ions from the low spin (LS; ) ground state to an intermediate spin (IS; ) state, whereas the 500 K transition corresponds to a crossover from the IS state to a mixed state of IS and the high spin (HS; ) state.Asai et al. (1998) Reducing the volume either by hydrostatic pressureAsai et al. (1997) or by subsitution of rare-earth elements,Baier et al. (2005); Nekrasov et al. (2003) with a smaller ionic radius, for La causes the spin-state transitions to move to higher temperature, and makes the two transitions less distiguishable. Korotin et al.Korotin et al. (1996) were the first to show theoretically that the IS state is energetically close to the LS state due to a large hybridization between Co- and O- orbitals. In a purely ionic picture, however, the ground state of Co3+ ions is either the LS state () or the HS state (), where and are the crystal-field splitting and the intra-atomic exchange interaction, respectively. Tanabe and Sugano (1954); Raccah and Goodenough (1967); Korotin et al. (1996) Recently, it has been argued that the IS state might be understood by including spin-orbit effects in the purely ionic model,Radwański and Ropka (1999) and comparisons have been made with electron-spin-resonance measurements.Noguchi et al. (2002) Thus, the nature of the IS-state Co3+ is still controversial.
The 100-K spin-state transition couples with phonons. In fact, lattice anomalies correlated with the spin-state transition have been reported. The lattice volume shows an anomalous expansion of about 1% around 100 K. Asai et al. (1998) The elastic constant measured by longitudinal ultrasound shows a dip of about 30% in magnitude around 100 K, suggesting a softening associated with coexistence of the LS and the IS-states of Co3+. Murata et al. (1999) In addition, it is expected that the hybridization-induced IS-state of the Co3+ ion should have an associated Jahn-Teller (JT) distortion, since the orbital is partially occupied. Several experiments suggest the orbital ordering due to the JT distortion. Yamaguchi et al.Yamaguchi et al. (1997) have reported an anomalous temperature dependence of the intensity and the splitting of the phonon modes with the energies of 35, 50 and 73 meV based on an infrared spectroscopic study, and proposed a local JT distortion resulting from the appearance of the IS-state Co3+. Louca and Sarrao have proposed a local static JT distortion based on the pair-density-function analysis of the neutron scattering in the paramagnetic insulating phase of La1-xSrxCoO3. Louca and Sarrao (2003) A structural analysis using synchrotron X-ray diffraction, performed by Maris et al., Maris et al. (2003) infers an alternation of short and long Co-O bonds accompanied with a subsequent change from rhombohedral to monoclinic for 20–300 K, suggesting the presence of the orbital ordering on the IS-state Co3+ with a cooperative JT distortion of the type. Kanamori (1960) The JT distortion increases sharply around 70 K with increasing temperature. Recently, Ishikawa et al. have reported an energy shift and broadening associated with the population of the IS-state Co3+ ions for the phonons of the rotational mode of O atoms at 11 meV, the vibration mode of La atoms at 21 meV, and the rotational mode of O atoms at 32 meV (energies are the values at 5 K) based on the Raman scattering experiment. Ishikawa et al. (2004) In addition, they have reported the appearance of the satellite peaks associated with the IS-state at the energies of 19, 45 and 84 meV with increasing temperature. Based on the results, they supported the orbital ordering due to the cooperative JT distortion proposed by Maris et al. Maris et al. (2003) These studies show that the investigation of the phonons is of paramount importance in understanding the spin-state transition.
It is important to clarify the phonon dispersion over the Brillouin zone in order to investigate the coupling between the phonons and the spin-state transition. The previous studies suggesting the lattice anomaly Asai et al. (1998); Murata et al. (1999); Yamaguchi et al. (1997); Louca and Sarrao (2003); Maris et al. (2003); Ishikawa et al. (2004) probe only the zone center (-point) of the Brillouin zone. Only neutron scattering experiments using a single crystalline sample affords information over the Brillouin zone. Louca et al. have reported the -integrated phonon spectra by neutron scattering study but they showed no information on the dependence of the phonons. Louca and Sarrao (2003) The phonon dispersion in the rhombohedral phase of the perovskite oxide over the whole Brillouin zone has not been reported to our knowledge although many studies of the soft-phonon mode near the structural phase transition in the cubic phase of LaAlO3 have been reported. Axe et al. (1969); Kiems et al. (1973)
In this paper, we report the inelastic neutron scattering study on LaCoO3 single crystal in order to determine the phonon dispersion and find the phonon anomaly associated with the spin-state transition of LaCoO3. In addition to the phonon scattering, we have investigated the inelastic magnetic neutron scattering associated with the energy gap between the LS and the IS state, which has been reported to be about 16 meV.Kobayashi et al. (2000); Noguchi et al. (2002)
II Sample preparation and experimental procedure
Single crystals of LaCoO3 were grown with a lamp-image floating zone furnace by melting polycrystalline samples prepared by a solid-state-reaction of predried La2O3 and CoO. Kobayashi et al. (2000) Laue photographs confirmed that each sample is a proper single crystal. LaCoO3 has a rhombohedrally distorted perovskite structure with the crystal space group of which contains two chemical formula units. Since the crystal contains four twins, each of which has the principal axis parallel to one of the -axes of the pseudo-cubic unit cell, and the rhombohedral distortion of the crystal from the cubic structure is small, we use the crystallographic indices based on the pseudo-cubic cell ( Å and at 295 K Thornton et al. (1986)) containing one molecule of LaCoO3. We must mention that the R-point of the pseudo-cubic Brillouin zone (0.5 0.5 0.5) is the zone center (-point) of the rhombohedral one due to the Brillouin zone folding. A rod of the single crystal with about 5 mm in diameter and about 40 mm in length and an assembly of similar four rods were used for the measurement at Brookhaven National Laboratory (BNL) and JAERI, respectively. The crystals were oriented with their directions vertical. The misalignment of the four crystals with respect to each other is within 1∘.
The inelastic neutron scattering measurements on a triple-axis spectrometer (TAS) H7 at BNL were performed in 1996. After preliminary measurements on PRISMA at ISIS in Rutherford Appleton Laboratory in 2003, the detailed inelastic neutron scattering experiments were performed on a triple-axis spectrometer TOPAN at JRR-3M in JAERI, Tokai. Both TAS experiments were performed with fixed final neutron energies () of 30.5 and 14.7 meV, but the horizontal collimation was 40’-40’-40’-80’ for the BNL measurement and 30’-100’-60’-blank and blank-60’-60’-60’, respectively for the JAERI measurement. For the phonon scattering, the scans were performed to measure both the transverse and the longitudinal phonons with the propagating vectors , and . For the magnetic excitation study, we have performed inelastic neutron scattering measurements around (1 0 0) and around an equivalent reciprocal lattice point (3 0 0).
III Experimental Results
III.1 Phonon scattering
The inelastic neutron scattering intensities at are shown in Fig. 1. The data were taken with the fixed final neutron energy () of 14.7 meV at temperatures () of 8 and 200 K. The intensities have been corrected by the temperature factor . Relatively sharp peaks are observed at about 6 meV for = 0.1 and about 10 meV for = 0.2 and 0.3. We identify these phonons as the transverse acoustic (TA) phonons propagating along = , , . We confirmed these phonons also at equivalent reciprocal lattice points = , , . We find that the energy shift for the acoustic phonons between 8 and 200 K is small for all although the energy width at 200 K is broader than that at 8 K. The broad peaks observed in the higher energy region ( 15 meV) for = 0.2 and 0.3 are due to the optical phonon scattering described later. We cannot identify the small peak observed at around 12 meV for = 0.2. We performed a similar measurement along = , , and observed the longitudinal acoustic (LA) phonons propagating along = , , (not shown).

The inelastic neutron scattering intensities for the transverse optical phonons at = 8 and 200 K are shown in Fig. 2. The data were taken at with meV. At 8K at (), two broad peaks were observed at around and 22 meV. We confirmed that the two peaks are due to the phonon scattering by comparing the scattering intensities measured at other equivalent reciprocal lattice points [ and (2.5, 1.5, 1.5)]. We consider that these two phonons at the R-points for the pseudo-cubic cell are identical to the phonons of the rotational mode of O atoms (11 meV at 5 K) and vibration mode of La atoms (21 meV at 5 K) observed in a Raman scattering experiment by Ishikawa et al. Ishikawa et al. (2004) although the latter phonon is slightly different in energy. It should be noted that the Raman active modes for the rhombohedral symmetry are at the R-point of the pseudo-cubic Brillouin zone since the atomic displacements of the modes are anti-phase for the nearest neighbor pairs along the [111]-axis. Ishikawa et al. (2004); Granado et al. (1998); Abrashev et al. (1999)

The optical phonons at show a remarkable softening and broadening with increasing temperature from 8 K to 200 K. We measured the phonon spectra also at 120 K and found that the optical phonon spectra are almost identical to those at 200 K. The temperature dependence of the phonon energy is in agreement with the result of the Raman spectroscopy (see Fig. 3). The broadening of the phonon peak of the O-rotational mode with increasing temperature is also consistent with the result of Raman scattering Ishikawa et al. (2004).
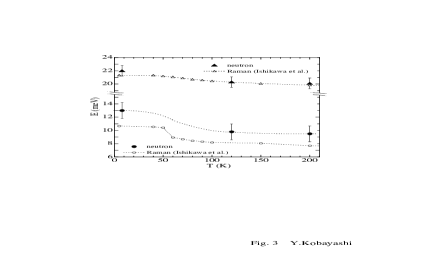
The phonon dispersion along obtained in the present experiment is summarized in Fig. 4 (a). In addition to the LA and the TA branches, we see two transverse optical branches; the lower one continuing to the rotational mode of O atoms and the other to the vibration mode of La atoms at . Ishikawa et al. (2004); Granado et al. (1998); Abrashev et al. (1999) We name the former and the latter branches TO1 and TO2, respectively. The phonon energies of both TO1 and TO2 remarkably decrease with increasing temperature from 8 K to 200 K. The softening is most pronounced at = 0.5, but it is not limited to that point. In contrast to the optical phonons, the softening in both LA and TA branches is negligible in all of the reciprocal lattice space investigated.
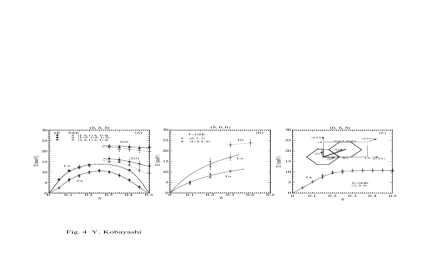
We measured the phonon scattering at = ( 2 2) and (4+ 0 0) with = 30.5 meV at 120 K to investigate the phonon dispersion along ( 0 0) for the TA and the LA modes, and = (2 ) with = 14.7 meV at 250 K for the TA phonon mode along (0 ). The phonon dispersion curves are shown in Figs. 4 (b) and (c), respectively. The trajectories of the in the reduced Brillouin zone for the rhombohedral crystal structure () containing two chemical formula units of LaCoO3 are shown in the inset of Fig. 4 (c).
III.2 Magnetic scattering
The energy-dependent spectra at = (1.04, 0.04, 0.04) and an equivalent reciprocal lattice point = (2.96, 0.04, 0.04) measured at temperatures 8 and 120 K are shown in Fig. 5. We expect the signal at to be dominated by magnetic scattering and that at to be dominated by phonons. Let us consider first the data, in Fig. 5(b) and (d). To fit these spectra, we assume that the scattering can be decomposed into three components: 1) gaussian tail from elastic scattering, 2) the two gaussian phonon peaks, and 3) a temperature- and energy-independent background. The magnetic scattering at should be small due to the magnetic form factor. In fitting the data, the background is constrained by the assumption that the temperature dependence of the phonon scattering is due to entirely to the Bose factor. The various fitted components are indicated in the figure.
To extract the magnetic scattering from the spectra taken at , we assume that the elastic tail and the background are the same as those determined at . The phonon intensity is estimated by assuming that it varies as . The components so obtained are indicated in Fig. 5(a) and (c). We assume that the difference between the measured data and the sum of the three components (tail, background, and phonons) is magnetic scattering. The deduced magnetic scattering at 8 K is shown in Fig. 6. The significance of this signal, and the increased scattering at 120 K, will be discussed in the next section.


IV Discussion
IV.1 Phonon scattering
The features of the acoustic phonon dispersion along the principal axes of the reciprocal lattice space for the pseudo cubic unit cell are as follows. (1) For = ( ), both LA and TA phonon branches are folded about = 0.25. (2) For = (0 ), the energy of the TA branch increases with increasing for 0.3, but levels off with 10 meV for larger . (3) For = ( 0 0), the energies of the LA and TA branches increase monotonically with increasing . The features (1) and (2) can be understood in terms of the reduced Brillouin zone for the rhombohedral crystal structure of LaCoO3 (see the inset of Fig. 4 (c)). For = ( ), crosses the zone boundary vertically at = 0.25, and the dispersion should be symmetric about this point. For = (0 ), arrives at the zone boundary with = 0.375, and travels on the zone surface up to = 0.5. The result shows that the phonon energy on the trajectory within the surface is not significant. The dispersions along ( ) and (0 ) are very different from those in the cubic phase of SrTiO3. Stirling (1972)
It has been reported that the longitudinal sound velocity along [111] is more than 10 % smaller at 200 K than at 8 K. Murata et al. (1999) However, the temperature difference between 8 and 200 K of the phonon energy found in the present study is substantially smaller than that (at most 5%) for both the LA and the TA modes along ( ) in the whole Brillouin zone, which means that the softening found in the ultrasonic measurements must be limited to a narrow region close to = 0.
The optical phonons show remarkable softening with increasing temperature in accordance with the Raman spectroscopy results.Ishikawa et al. (2004) A new finding of the present study is that the softening occurs not only at (0.5, 0.5, 0.5) but in the whole Brillouin zone along ( although it is most pronounced at = 0.5. It should be noted that the rotational mode of O atoms (TO1 at = 0.5) and the vibration mode of La atoms (TO2 at = 0.5) show substantial effects even though they are not especially sensitive to the force constant between Co and O atoms. More direct information about possible JT distortions is contained in phonons such as the quadrupolar mode found at much higher energies than those studied here. It would be quite interesting to probe that regime in a future study.
IV.2 Magnetic scattering
The magnetic scattering at = (1.04, 0.04, 0.04) shown in Fig. 6 is weak at low energy and suggests a broad peak at meV. This energy scale is comparable to the energy gap between the LS and the IS states deduced from magnetizationAsai et al. (1997) (18 meV), lattice volume expansionAsai et al. (1998) (21 meV), NMRKobayashi et al. (2000) (15.5 meV), and ESRNoguchi et al. (2002) (12 meV) measurements. The similarity of these energies suggests that the increment of the magnetic scattering is associated with the excitation from the LS to the IS state of Co3+ ions. In other words, the energy gap between the LS and the IS states are directly observed by the present inelastic neutron scattering. However, we regard this result as tentative because the energy region about meV is inevitably contaminated by the optical phonons, and furthermore we cannot obtain reliable temperature dependence of the magnitude of the excitation due to the increasing paramagnetic scattering arising from the fluctuation of the IS magnetic moments with increasing temperature.
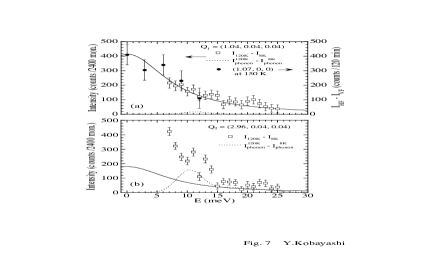
The difference of the neutron scattering between 8 and 120 K at = (1.04, 0.04, 0.04) is shown in Fig. 7 (a) along with the paramagnetic scattering intensity at (1.07, 0, 0) at 150 K measured previously with polarized neutrons.Asai et al. (1989) Solid line represents the magnetic scattering function with meV, convolved with the instrumental resolution ( meV). We see that the increment of the scattering can be ascribed to the fluctuation of the IS magnetic moments and is represented with the simple scattering function up to energies as high as 25 meV, although the solid line is only a guide to the eye. Here the increment of the phonon intensity between 8 and 120 K (shown by dotted line) is negligible. The difference of the neutron scattering between 8 and 120 K at = (2.96, 0.04, 0.04) [Fig. 7 (b)] is also interpreted by the paramagnetic scattering and increased intensity of the phonon scattering. Here, the former and the latter are denoted by the solid and dotted lines, respectively. The paramagnetic scattering intensity at is consistent with that at after being normalized by the magnetic form factor.
V Conclusion
We have investigated the phonons in LaCoO3 using inelastic neutron scattering. The phonon dispersion curves for high-symmetry directions and meV have been clarified. For ( ), both LA and TA phonon branches show a symmetric shape about = 0.25. For (0 ), the phonon energy of the TA branch levels off for . These behaviors are consistent with the folded Brillouin zone for the rhombohedral perovskite structure containing two chemical formula units. The transverse optical branches continuing to the rotational mode of O atoms and the vibrational mode of La atoms show remarkable softening associated with the spin-state transition. The softening occurs over much of the Brillouin zone. In contrast, the acoustic phonons show a much smaller change with temperature. The magnetic scattering intensity at around (1 0 0) increases to a maximum for meV, ascribable to the excitation of Co3+ from the LS to the IS spin-state. At higher temperatures, the paramagnetic scattering associated with the population of the IS-state Co3+ ions was observed up to 25 meV.
Acknowledgements.
The authors thank A. Ishikawa and S. Sugai for fruitful discussion and for giving us their data before publication. The authors also thank M. Fujita and H. Hiraka for their help on the neutron scattering experiments. The authors also thank K. Abe for fruitful discussion. This work was supported by Grant-in-Aids for Scientific Research from the Ministry of Education, Science, Sports and Culture of Japan, and from UK-Japan Collaboration on Neutron Scattering. This work was partially supported by Foundation for Promotion of Material Science and Technology of Japan. Work at Brookhaven is supported by the Office of Science, U.S. Department of Energy, under Contract No. DE-AC02-98CH10886.References
- Heikes et al. (1964) R. R. Heikes, R. C.Miller, and R. Mazelsky, Physica 30, 1600 (1964).
- Raccah and Goodenough (1967) P. M. Raccah and J. B. Goodenough, Phys. Rev. 155, 932 (1967).
- Asai et al. (1989) K. Asai, P. Gehring, H. Chou, and G. Shirane, Phys. Rev. B 40, 10982 (1989).
- Asai et al. (1994) K. Asai, O. Yokokura, N. Nishimori, H. Chou, J. M. Tranquada, G. Shirane, S. Higuchi, Y. Okajima, and K. Kohn, Phys. Rev. B 50, 3025 (1994).
- Asai et al. (1997) K. Asai, O. Yokokura, M. Suzuki, T. Naka, T. Matsumoto, H. Takahashi, N. Mori, and K. Kohn, J. Phys. Soc. Jpn. 66, 967 (1997).
- Asai et al. (1998) K. Asai, A. Yoneda, O. Yokokura, J. M. Tranquada, G. Shirane, and K. Kohn, J. Phys. Soc. Jpn. 67, 290 (1998).
- Baier et al. (2005) J. Baier, S. Jodlauk, M. Kriener, A. Reichl, C. Zobel, H. Kierspel, A. Freimuth, and T. Lorenz, Phys. Rev. B. 71, 014443 (2005).
- Nekrasov et al. (2003) I. A. Nekrasov, S. V. Streltsov, M. A. Korotin, and V. I. Anisimov, Phys. Rev. B. 68, 235113 (2003).
- Korotin et al. (1996) M. A. Korotin, S. Y. Ezhov, I. V. Solovyev, V. I. Anisimov, D. I. Khomskii, and G. A. Sawatzky, Phys. Rev. B 54, 5309 (1996).
- Tanabe and Sugano (1954) Y. Tanabe and S. Sugano, J. Phys. Soc. Jpn. 9, 766 (1954).
- Radwański and Ropka (1999) R. J. Radwański and Z. Ropka, Solid State Commun. 112, 621 (1999).
- Noguchi et al. (2002) S. Noguchi, S. Kawamata, K. Okuda, H. Nojiri, and M. Motokawa, Phys. Rev. B 66, 94404 (2002).
- Murata et al. (1999) S. Murata, S. Ishida, M. Suzuki, Y. Kobayashi, K. Asai, and K. Kohn, Physica B 263-264, 647 (1999).
- Yamaguchi et al. (1997) S. Yamaguchi, Y. Okimoto, and Y. Tokura, Phys. Rev. B 55, R8666 (1997).
- Louca and Sarrao (2003) D. Louca and J. L. Sarrao, Phys. Rev. Lett 91, 155501 (2003).
- Maris et al. (2003) G. Maris, Y. Ren, V. Volotchaev, C. Zobel, T. Lorenz, and T. T. M. Palstra, Phys. Rev. B 67, 224423 (2003).
- Kanamori (1960) J. Kanamori, J. Appl. Phys. 31, 14S (1960).
- Ishikawa et al. (2004) A. Ishikawa, J. Nohara, and S. Sugai, Phys. Rev. Lett 93, 136401 (2004).
- Axe et al. (1969) J. D. Axe, G. Shirane, and K. A. Muller, Phys. Rev. 183, 820 (1969).
- Kiems et al. (1973) J. K. Kiems, G. Shirane, K. A. Muller, and H. J. Scheel, Phys. Rev. B 8, 1119 (1973).
- Kobayashi et al. (2000) Y. Kobayashi, N. Fujiwara, S. Murata, K. Asai, and H. Yasuoka, Phys. Rev. B 62, 410 (2000).
- Thornton et al. (1986) G. Thornton, B. C. Tofield, and A. W. Hewat, J. Solid State Chem. 61, 301 (1986).
- Granado et al. (1998) E. Granado, N. O. Moreno, A. Garcia, J. A. Sanjurjo, C. Rettori, I. Torriani, S. B. Oseroff, J. J. Neumeier, K. J. McClellan, S. W. Cheong, et al., Phys. Rev. B 58, 11435 (1998).
- Abrashev et al. (1999) M. V. Abrashev, A. P. Litvinchuk, M. N. Iliev, R. L. Meng, V. N. Popov, V. G. Ivanov, R. A. Chakalov, and C. Thomsen, Phys. Rev. B 59, 4146 (1999).
- Stirling (1972) W. G. Stirling, J. Phys. C: Solid State Phys. 5, 2711 (1972).