Load distribution in small world networks
Abstract
In this paper we introduce a new model of data packet transport, based on a stochastic approach with the aim of characterizing the load distribution on complex networks. Moreover we analyze the load standard deviation as an index of uniformity of the distribution of packets within the network, to characterize the effects of the network topology. We measure such index on the model proposed by Watts and Strogatz as the redirection probability is increased. We find that the uniformity of the load spread is maximized in the intermediate region, at which the small world effect is observed and both global and local efficiency are high. Moreover we analyze the relationship between load centrality and degree centrality as an approximate measure of the load at the edges. Analogous results are obtained for the load variance computed at the edges as well as at the vertices.
1 Introduction
Congestion in real networks is a complex phenomenon that depends on a large number of variables. Here we are interested in understanding how the underlying structure of the network can itself have an influence on congestion. The network is supposed to be crossed by information units or packets. We will consider a packet transport model on a given graph and will study the effects of changes in the graph topology on the packets distribution. With the aim of understanding the effects of the network topology on congestion, we will keep constant other variables as the rate at which packets are generated, the distribution of sources and destinations within the network, and the routing algorithm to go from the former to the latter. We will show that each vertex can draw toward itself an higher or lower flow of packets, according to its own position within the graph.
2 The network as a Markov Chain
In the recent literature on networks several dynamic packet transport models were analyzed with the aim of describing realistic communication over the network [3] [12] [9][7] [11]. On the other hand in [5] [6] some static parameters were introduced in order to characterise the load distribution over the network without considering explicitly its dynamics.
We will suggest here an alternative and intermediate packet transport model based on a stochastic approach.
We consider a network with vertices. We make the hypothesis that the origin and the destination of each packet are chosen with uniform probability within all the vertices in the network. We suppose that at each time step, each vertex generates packets, each one addressed to every other node in the network so that the total number of packets generated at each time step is equal to .
Then packets are supposed to be routed from origin to destination along the geodesic, i.e. according to a minimum distance criterion. We suppose that packets are delivered according to a dynamic process that takes into account the actual time needed for packets to travel across the network. We consider the case of a parallel process, in which at each time unit all packets move simultaneously, every one crossing one edge. We assume that the time in which a packet goes through exactly one edge is equal to one time unit. Specifically we assume that at each time step:
-
1.
Packets are generated at every vertex.
-
2.
Packets in a given node but not delivered yet to their final destinations, are routed to the neighbors of that node that are nearest to the destination.
-
3.
Packets delivered to their final destination are removed from the network.
In [5], the load at a given vertex , , was defined as the number of shortest paths between pairs of nodes crossing it. Analogously we will define here the load at the edges , as the number of shortest paths crossing a given edge.
Let be the subgraph of the vertices adjacent to . As a packet is crossing , it can take one of the directed edges , . We assume that each edge in the graph is crossed with frequency proportional to its load . Consistently with that assumption, we will estimate the conditional probability of a packet starting from , going through one of the edges , as:
| (1) |
Using (1), we can now associate to the network of interest a Markov Chain; each node being represented as a state of the chain with the probability of going from a state to a state being given by for .
The Markov Chain represents a dynamic model describing the evolution of the packets distribution in time. We can obtain numerically the limit distribution , i.e. the probability of being asymptotically in a certain state/node of the Markov Chain. We wish to emphasize that can be used as an alternative measure of the load at vertices. In particular, we found to differ from the previous estimation of the load at vertices [5].
We can give a physical explanation of that, according to the parallel nature of the packets exchange over the network.
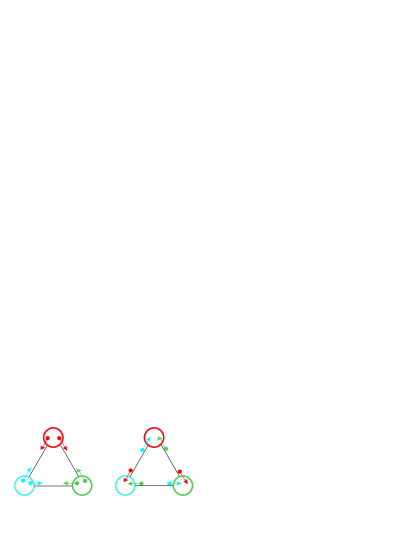
Fig.1 shows the load distribution of packets in a representative network on which packets are exchanged in a parallel way. We observe that for each packet travelling from a vertex to a vertex , there is another one travelling from to . This implies that packets just having been generated and the ones delivered to destination are never present simultaneously in the same node at any given time.
Let’s define the total load at the vertices in the network, computed as the sum of the loads over all the vertices within the network, i.e. . We have that:
| (2) |
where is the characteristic path length associated to the graph. From (2), we have that the average load at vertices is given by . We observe that the average load is proportional to the characteristic path length of the graph: shortening mean distances between vertices implies that packets travel from origin to destination in fewer steps. Hence, a load reduction is observed on the whole network.
Moreover, it is worth mentioning here that expression (2) is identical to Little’s Law [10] in queueing theory, i.e.
| (3) |
where the total number of packets in the network is replaced with and , the mean time spent by a packet going from origin to destination in Little’s law, is replaced with , under the hypothesis that each edge is crossed within the same amount of time.
Note that, according to the newly introduced load definition, we find that, contrary to what presented in [5], the total load at the vertices is equal to the total load at the edges , i.e. . This is expected as in our model, the total amount of packets within the network at any time has to be the same.
3 Uniformity of load distribution in small world networks
We will try now to assess whether the network topology can itself cause a more or less uniform distribution of packets in the network. In [2] the effects of variations of load distribution in random and scale free networks were analyzed. The former are characterized by a Poisson degree distribution while the second have a degree distribution of the form . From a communication point of view, it would be desirable to have a uniform load distribution in order to exploit evenly the network resources (nodes and edges). In particular we will try to understand how uniform over a given network the load distribution is, because of its topology.
Specifically, an high variance of that distribution should indicate an unfair use of the network, and could therefore point out a possible cause of congestion.
In [1], the maximum load was proposed as a main index for characterizing the network structure and an high value of this parameter was claimed responsible for congestion. Nevertheless, this parameter does not describe the whole structure of the graph, giving information only on the load level at the hub. For that reason here we will evaluate the load standard deviation as defined in [2], that refers to the network as a whole. In order to make it insensitive to the average values of , we will evaluate , the standard deviation of the load appropriately normalized with respect to its mean.
The standard deviation of the load distribution was shown to have an effect on network performances in terms of throughput and delivery time. Namely an high value of the load variance, that is typical of scale-free networks was seen to be able to worsen strongly the network performances.
We analyze here the variation of load distribution both at the edges and at the vertices due to changes in the underlying topology.
A common feature of most real networks is that they are small world, i.e. the average distance between randomly chosen nodes is generally low and increases only logarithmically with the network size. Moreover real networks show high clustering or transitivity, that is, high probability that two randomly selected neighbors of a node are also neighbors of each other. Watts and Strogatz (WS) [4] showed that, starting from a regular nearest neighbor circle, a few random redirection were sufficient to get the small world effect, without compromising the clustering.
We will repeat the experiment in [4], measuring also the normalized standard deviation of the vertices load, and the edges load .
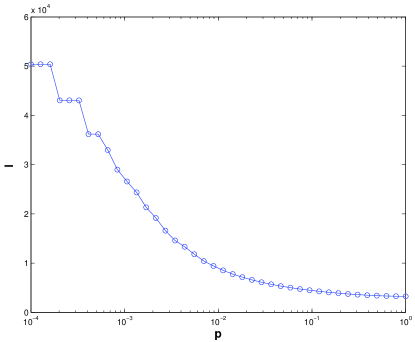
In Fig. 2 the average load in the graph is shown as the redirection probability is varied. It can be observed that the average load behaves as the characteristic path length of the graph, decreasing as increases.
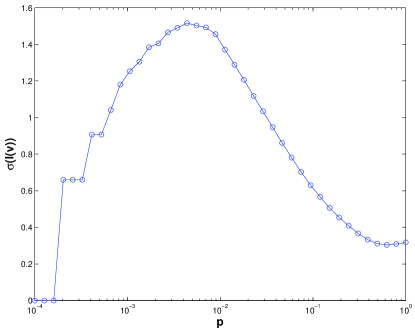
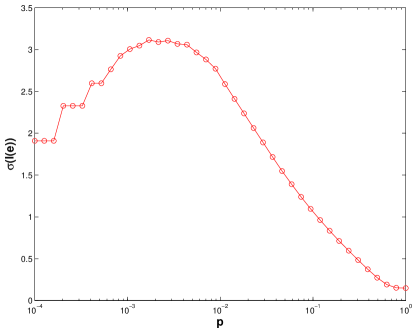
The normalized standard deviation of the vertices load is shown in Fig. 3. Here, we see that such quantity increases at first, then over a certain threshold value of the redirection probability, it is progressively reduced. In fact, as the redirected edges are few, the global reduction of the characteristic path length is achieved through the exploitation of the same shortcuts and the vertices situated at their endpoints.
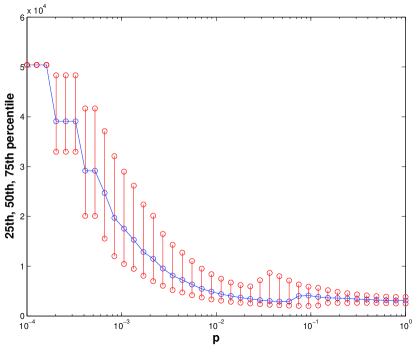
A further increase of (i.e. of the number of redirected edges) causes an increase of the number of different paths linking pairs of nodes in fewer steps. Thus, for higher , an higher load uniformity (lower ) is observed. In other words we observe that, starting from a regular configuration, and adding progressively some disorder to it, the parameter increases at first and then decreases after a critical point. So we have that at intermediate , at which local and global efficiency are both maximized [14], we get the least uniform load distribution between vertices. In Fig. 4 we report the median (in blue) of the load distribution with the 25th and 75th percentile (in red), showing that the interquartile range of the sample is larger for intermediate values of .
We can argue thus that the small-world effect, i.e. the reduction of the average distance between vertices caused by the addition of a relatively small number of shortcuts, can be associated with an unfair spread of the load distribution across the network. This would cause an unfair exploitation of some of the network resources, making some areas of the network more likely to be interested by higher traffic and therefore by congestion phenomena.
As shown in Fig. 5, similar results are obtained when the load standard deviation at the edges (rather than at the vertices) is computed.
4 Load Distribution And Degree
As discussed above, by adding shortcuts at a given vertex, a load increase is observed at the node as well as at the edges leaving from it. So we can notice two different effects of rewiring links on the load at the edges: (i) a bigger amount of packets is routed by the starting node through the outgoing edges; (ii) the load is shared between an higher number of edges. Therefore, the load distribution at the edges is influenced by both the load and the degree at the vertices which they leave from.
From this point of view, it is worth understanding the relationship between the two main measures of point centrality [13], the one based on the degree and the other on the betweenness.
A first contribution in that sense was given in [8], where it was shown that, in the case of a power law degree distribution, the load scaling were characterized by a function of the degree :
| (4) |
This means that nodes with more incident edges are the ones that draw on themselves more load, according to an assigned power of the degree.
Here, to define a more general link between load and degree, we introduce a new index, the load-degree ratio at each vertex i, defined as
| (5) |
This parameter measures the number of packets at each vertex, with respect to the number of incident links and moreover it is an average value of the load at the edges incoming or outgoing from .
We observe that, when the redirection procedure is applied, the degree of some vertices increases (as new edges are connected to them). Correspondingly a significant increase of the load at vertices is also detected. Therefore, the load-degree ratio of those vertices increases as well. On average this means that the load at the edges leaving from overloaded vertices becomes larger. This explains the behavior of in Fig. 5 below the threshold value of .
On the contrary, for further variations of the redirection probability, as the network approaches a random configuration, decreases similarly to what observed for .
5 CONCLUSION
In this work we have introduced a new load definition more suitable in the case of a dynamical process in which packets travel across the network in parallel. This new formulation differs from previous ones as it takes into account in the computation alternatively the contribution of the packets yet generated or of the ones delivered to destination; in fact in a parallel process packets outgoing from a given vertex move at the same time as the incoming ones arrive.
Moreover we have introduced two new indices with the aim of evaluating the role of the network topology in influencing the packets distribution within the network, the standard deviation of the load at the vertices , and at the edges . We have reworked through the WS experiment, computing the new quantities. We have noticed that as the small-world effect can be obtained by the addition of a relatively low number of shortcuts, this is made at the expenses of the uniformity of the load distribution within the network.
References
- [1] A.Arenas, A.Cabrales, A.Diaz-Guilera, R.Guimera, and F.Vega-Redondo. Search and congestion in complex networks. cond-mat, 1(0301124), 2003.
- [2] D.K. Arrowsmith, M. di Bernardo, and F.Sorrentino. Effects of variation of load distribution on network performance. Proc. IEEE ISCAS, Kobe, Japan, 2005.
- [3] D.K. Arrowsmith, R.J. Mondrag n, J.M. Pittsy, and M. Woolf. Phase transitions in packet traffic on regular networks: a comparison of source types and topologies. 2004.
- [4] D.J.Watts and S.H.Strogatz. Collective dynamics of ’small world’ networks. Nature, 393:440–442, 1998.
- [5] K.-I. Goh, B. Kahng, and D.Kim. Universal behavior of load distribution in scale-free networks. Phys.Rev.Lett., 87(27), 2001.
- [6] K.-I.Goh, B.Kahng, and D.Kim. Packet transport and load distribution in scale-free network models. Physica A, 318:72–79, 2003.
- [7] S. Manfredi, M. di Bernardo, and F.Garofalo. Small world effects in networks: An engineering interpretation. Proceedings of IEEE International Symposium on Circuits and Systems Vancouver, 2004.
- [8] M.Berth lemy. Betweenness centrality in large complex networks. cond-mat, 1(0309436), 2003.
- [9] T. Ohira and R. Sawatari. Phase transition in a computer network traffic model. Phys. Rev. E, (58):193–195, 1998.
- [10] R.Nelson. Probability, stochastic processes and queueing theory: the mathematics of computer performance modeling. Springer-Verlag, New York, 1995.
- [11] S.Manfredi. An aqm routing control for reducing congestion in communication networks. International Symposium on Circuits and Systems Kobe Japan, 2005.
- [12] R.V. Sole and S.Valverde. Information transfer and phase transition in a model of data traffic. Physica A, 289(595), 2001.
- [13] S.Wasserman and K.Faust. Social Network Analysis. Cambridge University Press, 1994.
- [14] V.Latora and M.Marchiori. Economic small-world behaviour in weighted networks. cond-mat, 1(0204089), 2002.