Desiccation and Relaxation Regimes in Fracture of Drying Clay Films
Dibyendu Mal1, Suparna Sinha1, Tapati Dutta2, S. Mitra3 and Sujata Tarafdar1
1Condensed Matter Physics Research Centre, Physics Department
Jadavpur University, Kolkata 700032, India
2 Physics Department, St. Xavier’s College,
Kolkata 700016, India
3 Department of Geological Sciences
Jadavpur University, Kolkata 700032
India
Abstract A study of crack patterns in laponite films of different thickness is presented. Two
cracking regimes are observed. The earlier with a higher rate of desiccation and shrinking has predominantly
four-fold vertices
in the crack network, while the later regime has less volume shrinking and forms mainly three-fold vertices. The pattern
shows a self-similarity under coarse-graining. The graph of
area covered by the cracks versus minimum crack-width resolved, scales with the film thickness. Curves representing
crack area for different thickness can thus be made to collapse onto a single curve.
PACS Numbers: 46.50.+a, 89.75.Da, 47.54.+r
Crack patterns in drying clay films have a distinctive hierarchical structure, this has been discussed in several earlier papers [1, 2, 3]. Common features noted in the crack pattern in all these works are - predominance of four-sided peds and cracks meeting each other at right angles. However, even with these features in common, two distinct classes of crack networks have been observed - (a) those with three-fold vertices [1] and (b) those with predominantly four-fold vertices [2]. Class (a) is seen for example, in cracks on ceramic glazes, where the fractures appear as hairline cracks. Though these form due to desiccation, the loss of fluid is not a significant fraction of the total volume of the material. Class (b) on the other hand, is seen in dry mud flats, colloidal gels, or a suspension of fine particles such as coffee powder, or laponite while losing solvent [2, 3, 4]. Here the cracks have a range of widths, the largest may be comparable to the ped size, so a considerable volume shrinking is involved in the formation process. The successively formed cracks, however, are narrower and narrower, so at some point of time the pattern becomes identical to the class (a) network, with the signature three-fold vertices. We call (b) the desiccation regime and (a) the relaxation regime. In this letter we present an experimental study of crack formation in drying laponite films and show the crossover between the two distinct regimes. The difference between the two regimes has been identified by three characteristics - (i) different rates of weight loss during drying, (ii) predominance of either four-fold or three-fold vertices, and (iii) different scaling rule with variation of film thickness for crack area as a function of crack width.
The experimental procedure is as follows - laponite (RD) is mixed with methanol and stirred for 1-2 hours to make a suspension. The mixture is poured in a Petri-dish and allowed to dry. The crack pattern is photographed at intervals as it forms. The Petri-dish is placed on a digital balance during drying, so the weight loss can be recorded continuously.
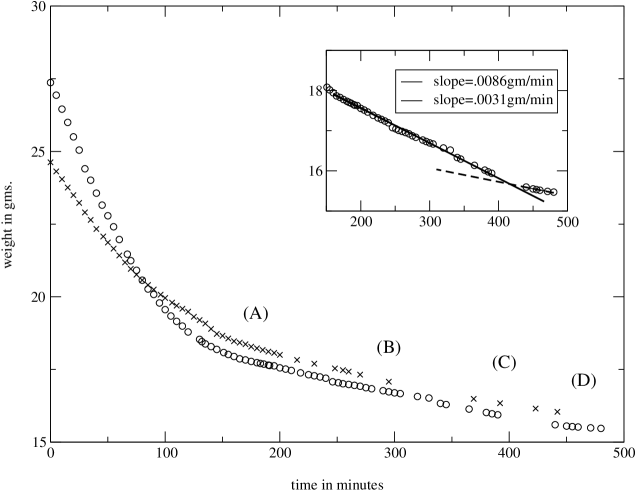
A typical sequence of photographs is shown in figure (1). The weight as a function of time for two samples is shown in figure (2), positions (A)-(D) on the graph indicate the time when the corresponding snapshots in figure(1) were taken. The initial rapid weight loss in figure 2 is due to excess methanol evaporating from the top of the sample. The end of this regime is marked by appearence of white spots on the film surface. We are henceforth concerned only with the region from (A)-(D) in figure (1).
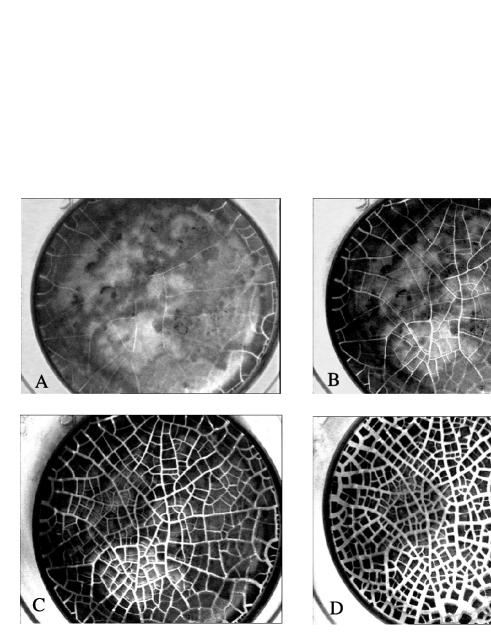
The cracks first appear at the edge of the Petri-dish. Figures (A)-(D), (1) show that the initial cracks are the longest and span the entire sample.The segments formed shrink rapidly and subsequently these cracks are the widest. The next generation cracks form when the segments again divide in a similar manner, these cracks are less wide. This hierarchical cracking process [2] is illustrated schematically in figure (3). The fractures appear near the centre of the segments where the stress is maximal [5]. Four-way crossings or four-fold vertices arise in the crack network due to this sequence of fracture. The time interval where this type of mechanism is operative is indicated in (A)-(C) in figure (2).

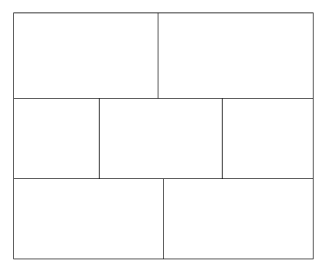
At the point shown in the inset of figure (2), a change in slope of the drying rate can be observed. We suggest that this is the point where a different mechanism takes over. Now the cracks are very narrow and desiccation is much less, the cracks are formed as the clay particles relax and rearrange to relieve the residual stress. The narrow cracks meet at three-fold vertices, similar to the pattern of laying bricks on a wall, the process is illustrated schematically in figure (4). four-fold vertices do not form because a second daughter crack does not meet the parent crack at a point where an earlier daughter crack has already relieved the stress [1]. This argument is not valid for the class (b) cracks, here the rapid shrinking makes the formed peds effectively independent of each other and the cracks appear at the middle. In regime (a) adjacent peds are in contact and should be regarded as parts of the same system.
In the second part of the analysis we concentrate on the self-similarity of the final pattern, manifest in the hierarchy of crack widths. When observed under slowly increasing resolution i.e. decreasing the minimum observable crack width the curve representing the cumulative area covered by the cracks shows a typical highly reproducible shape. This curve again reveals the two different regimes, as discussed earlier in [2]. We show in figure 5 the curves for a range of film thicknesses . The high resolution (low ) side of these curves all show the class (a) regime, where crack width is negligible and changes very slowly. The low resolution (high ) side can be explained on the basis of the formation process in figure 3 with a successive decrease in width of higher stage cracks by a factor of about [2]. So in systems involving desiccation of a large amount of solvent, both the processes described by figures (3,4) are found, and the resulting network has a combination of three and four fold vertices.
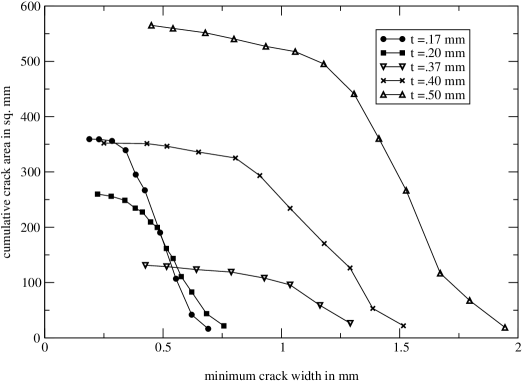
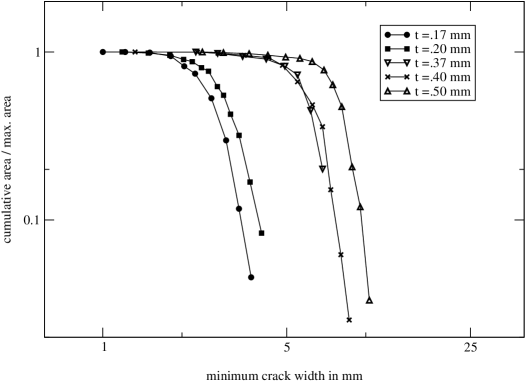
A very interesting feature of the two cracking regimes is their different scaling behaviour with variation in thickness of the film. If we plot the data shown in figure (5), as the fractional crack area (dividing by the maximum crack area), we find that the narrow crack regimes for all the curves merge showing that here the functional dependence of on is independent of the film thickness. This is shown in figure (6). Here is very weakly dependent on . It may be noted that the total sample area for all these patterns are not equal. In some samples small regions of very different thickness due to inhomogeity of the suspension had to be omitted during the analysis.
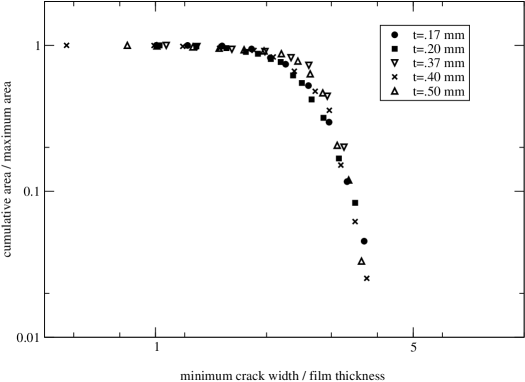
If we now scale the crack width (the x-axis) by the film thickness , we find that all the curves collapse quite well onto a single curve figure 7. This shows that for the wider crack regime
| (1) |
being some function.
For the widest cracks, this regime follows a power-law with an exponent close to 8. It was shown in [2] that this corresponds to cracks of successive stages in the pattern of figure (4) being reduced in width by a factor of 0.93.
The scaling of the cumulative area curves with can be explained qualitatively as follows - we assume following [4], that the cracking is due to the friction between the surface of the Petri-dish and the laponite-methanol mixture, which resists the shrinkage and this force is very weakly dependent on the thickness of the drying layer. The energy gained by shrinking of the mixture is more for the thicker samples in proportion to their thickness, so they can shrink more creating wider cracks before the gain in energy due to shrinking is balanced by the pinning frictional force. Our results are consistent with the observation that the linear size of the crack patterns scales with film thickness [4].
To quanitify our analysis further, we count the three and four-fold vertices in several patterns, the numbers compare as shown in table 1.
| Sample | no. of 4-fold vertices | no.of 3-fold vertices |
|---|---|---|
| (a) | 63 | 102 |
| (b) | 78 | 180 |
| (c) | 86 | 200 |
A very rough estimate of the number of vertices can be made on the basis of the scheme shown in figure (3). During earlier part of the crack formation regime (b), each successive stage increases the number of segments by a factor of 2, and two successive stages are required to create four new four-point vertices. We can estimate the number of stages in the (b) regime from the ratio of maximum crack width for each - to at the cross-over from regime (b) to (a). This ratio is seen from figure (5) to be close to 0.6 for all the samples. Since each stage reduces the crack width by 0.93, we have
| (2) |
from such an estimate is found to be 7. According to figure (3) starting with 1 four-fold vertex at stage 2 this should produce four-fold vertices. This is of course, an approximate ‘order of magnitude’ estimate, the irregularities in the substrate and inhomogeneity of the laponite suspension make the process highly stochastic. Moreover boundary effects due to the circular geometry of the periphery of the Petri-dish creates further disorder in the initial stages (see figure (A)-(B) (1).
The regime (a) which follows creates the three-fold vertices. Here the number of peds created in each stage is not well defined, but assuming three or four daughter peds produced from each ped after completion of regime (b), an increase by a factor of 2 in the number of new three-fold vertices, as observed in Table 1 is quite reasonable.
In spite of the uncertainties involved, the reproducibility of the overall features and the existence of the two different cracking processes seems quite unmistakable. In figure (5) the crossover from regime (b) to (a) occurs at around
for all . The cracks with width contribute most to the total area covered by the cracks.
Earlier work on crack-patterns deals mainly with ped size, shape and their relation with film thickness [1, 4]. Studies involving width of cracks and their distribution are lacking. Besides the studies on hierarchical crack patterns a whole body of literature deals with directional drying and patterns it creates e.g.[6, 5]. The geometry of such systems is somewhat different from ours. The fractal dimensions of branching cracks have also been studied [7, 8].
We have done this study on laponite as it is a synthetic clay with monodisperse nanosized particles. It has properties similar to natural clays but is free from heterogeneity and impurities in real clay and the structure is well known. Methanol is used to make the dispersion as it evaporates quickly, but being non-polar, it does not form a gel with laponite. We plan to study also the patterns of laponite gels using water as the solvent.
We hope this analysis may provide a basis for more quantitative studies in future and lead to a better understanding of the important phenomenon of crack formation. Authors are thankful to Connell Brothers (India) and Rockwood Additives (UK) for providing the Laponite(RD) samples free of cost. DM thanks UGC for providing a research fellowship under project No. F5-9/2003(SR). We are grateful to Surajit Sengupta for stimulating discussion on pattern formation.
References
- [1] S.Bohn, S.Douady,&Y.Couder Phys. Rev. Lett. 94,054503 (2005)
- [2] D.Mal, S.Sinha, S.Mitra, S.Tarafdar Physica A 346,110 (2005)
- [3] K. A.Shorlin & J. R.de Bruyn, M. Graham & S. W.Morris Phys. Rev. E 61,6950 (2000)
- [4] A.Groisman & E.Kaplan Europhys. Lett., 25,415 (1994)
- [5] T. S.Komatsu & Shin-ichi Sasa Jpn.J.Appl.Phys 36,391 (1997)
- [6] C. Allain, L. Limat, Phys. Rev. Lett. 74, 2981 (1995)
- [7] S. G. Wang, Physica A, 335, 1 (2004)
- [8] J.P. Bouchaud, E. Bouchaud, G. Lapasset, J. Planes, Phys. Rev. Lett. 71, 2240 (1993)