Current oscillation and low-field colossal magnetoresistance effect in phase-separated manganites
Abstract
Current-induced switching from metallic to insulating state is observed in phase-separated states of (La1-yPry)0.7Ca0.3MnO3 () and Nd0.5Ca0.5Mn1-zCrzO3 () crystals. Application of magnetic fields to this current-induced insulating state causes pronounced low-field negative magnetoresistance effect [ at kOe]. Application of a constant voltage also causes breakdown of ohmic relation above a threshold voltage. At voltages higher than this threshold value, oscillations in currents are observed. This oscillation is well reproduced by a simple model of local switching of a percolative conduction path.
pacs:
64.60.Ak, 64.75.+g, 71.30.+h, 75.47.LxIn this decade, manganites with perovskite-type structure have been attracting much attention because of their versatile physical phenomena caused by competing degrees of freedom of charge, spin, lattice, and orbital. Recent extensive studies were first motivated by a discovery of unusual decrease of resistivity by magnetic fields: colossal magnetoresistance (CMR) effects Kusters ; Helmolt ; Chahara ; Ju ; Jin ; Tokura . Producing the CMR effects at low fields has been a challenging issue.
The large magnetoresistance effect cannot be explained within the framework of the double-exchange (DE) model Anderson ; deGennes alone, and needs introduction of additional mechanisms such as electron-phonon coupling mediated by the Jahn-Teller effect Millis . Roles of additional mechanisms become prominent as the DE interaction is suppressed by a reduction of the effective one-electron bandwidth (). In (La,Pr)0.7Ca0.3MnO3, reduction of decreases transition temperature to ferromagnetic-metal phase (), and makes the CMR effect prominent just above Hwang . Recent systematic studies on crystals of Sr0.45MnO3 ( is a rare-earth ion) Tomioka1 clearly showed the role of short-range correlation of charge/orbital ordering that makes the sample insulating above and hence the CMR effect drastic. Further decrease in results in long-range charge/orbital ordering. Although magnetic field induced melting of the charge/orbital ordering results in a change in resistivity more than 10 orders of magnitude, the field needed is higher than 10 T Tomioka2 ; Kuwahara ; Tokunaga1 , which is beyond the scope of practical applications.
Another aspect of CMR effect is proposed by a scenario of phase separation (PS) into ferromagnetic metal and antiferromagnetic (or paramagnetic) insulator Dagotto . Although it is controversial whether the PS is a necessary condition to cause CMR effects, creation of percolative conduction paths can reproduce drastic change in resistivity Mayr . In some classes of manganites, the presence of co-existing domains with different phases have been directly observed Uehara ; Fath . In our previous work, we visualized percolative conduction paths in a phase-separated (La1-yPry)0.7Ca0.3MnO3 () (LPCMO-0.7) crystal Tokunaga2 . We found that percolative conduction in LPCMO-0.7 is collapsed by application of a large amount of current, which coincides with steep increase in resistivity.
In this study, we report anomalous transport properties in the large current/voltage-applied states of LPCMO-0.7: low-field CMR effects in large currents and current oscillations at a constant voltage. To clarify whether these effects are specific to LPCMO-0.7 or not, we carried out similar transport measurements on Cr-doped Nd0.5Ca0.5MnO3 in which occurrence of PS has been reported Kimura . The results described in this Letter are commonly observed in both samples; therefore, we think it is intrinsic to the PS state.
Crystals of LPCMO-0.7 and Cr-doped Nd0.5Ca0.5MnO3 were grown by the floating-zone method. Since we need metallic conduction in the ground state, Cr concentration was set to 3% (Cr3%-NCMO) so that fraction of metallic phase is larger than the percolation threshold. Details of sample preparation are described in our previous paper Tokunaga2 . Sample dimensions are for LPCMO-0.7 and for Cr3%-NCMO. Both samples show insulator-metal transition with decreasing temperature below K [insets of Figs. 1(a) and (b)].
For transport measurements, we utilized several current()/voltage() sources (YOKOGAWA-7651, KEITHLEY-2400, TAKASAGO-BPS40-15). We did not see any instrument dependence for the results shown in this Letter. Magneto-optical (MO) imaging is performed through a polarizing microscope with an indicator film mounted on the sample. Details of MO imaging are described in the previous paper Tokunaga2 . Temperature shown in this Letter is the value measured by a thermometer set close to the sample.
Figure 1(a) shows a - curve of LPCMO-0.7 at 30 K. - curves shown in this paper were obtained by the standard four-probe method. With increasing , voltage drop in the sample steeply increases by three orders of magnitude at around 13 mA. Above this threshold current (), the sample shows negative differential resistance. Successive decrease in causes a change to the low-resistivity state again at a threshold current () smaller than . This - characteristic is reproduced well, and hence, the whole curve is anti-symmetric against the origin. As reported in our previous paper Tokunaga2 , this abrupt increase in resistivity coincides with the change of conduction paths from inhomogeneous to homogeneous.
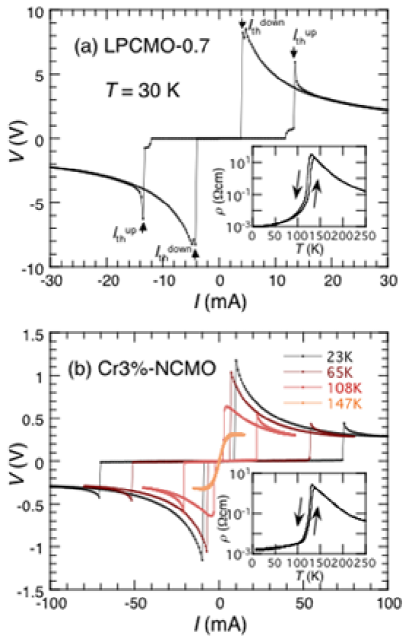
Such anomalous - curves are observed also in Cr3%-NCMO below as shown in Fig. 1(b). The is 74 mA at 23 K. Although the values of the threshold current density are different between the two samples, it is not clear whether this difference originates from intrinsic nature of these materials or not. By measuring many other pieces of the crystals, we find out that the value of the threshold current density depends not only on the composition, but also on many other factors such as the sample dimensions. Apart from the quantitative differences, qualitative features of - curves are common in the two systems. Both and decrease monotonically as temperature increases and go to zero at .
These - characteristics are sensitive to magnetic fields (). Figure 2(a) shows the first quadrant of the - curves of LPCMO-0.7 at various fields. Application of magnetic field increases both and . Field dependence of the is demonstrated in the inset of Fig. 2(a). This diagram implies that if we apply a current larger than and then reduce it to a certain value slightly higher than , we can cause an insulator-metal transition by application of low magnetic field.
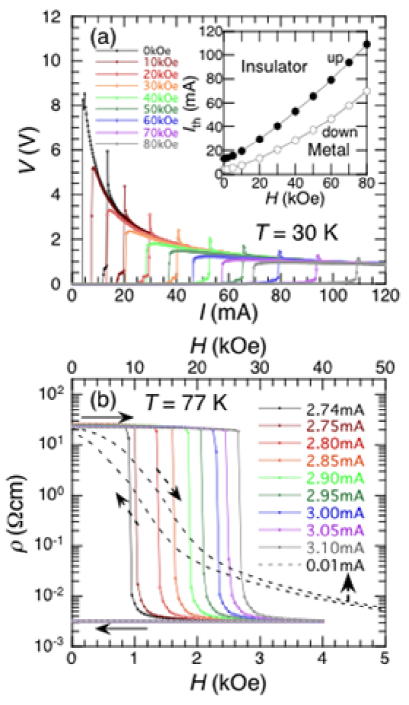
This low-field CMR effect is indeed observed. Figure 2(b) shows field dependence of resistivity in LPCMO-0.7 at 77 K. In these measurements, we first apply a current of 15 mA to cause a transition to the insulating state, and then reduce it to various values at which we measured magnetoresistance effect. We can see a steep drop of resistivity of 3 orders of magnitude at fields of several kOe. The transition field decreases as the current for measurement decreases toward . The sharpness of resistivity drop contrasts with the magnetoresistance effect at low current. The dotted line in Fig. 2(b) represents the magnetoresistance for A (with ten times larger horizontal scale) at 130 K where CMR effect becomes the largest for small currents. Note that resistance at zero field is almost the same in both cases. This fact indicates that although temperature of the environment is measured as 77 K, the sample is locally heated up to about 130 K by application of a current larger than . At A, kOe is needed to reduce resistivity down to 10-3 of the value at zero field, whereas 0.95 kOe is sufficient at mA. Further decrease in current causes spontaneous transition to metallic state without applying external field.
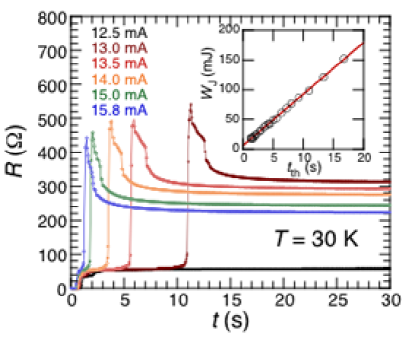
This low-field CMR effect is available only after the transition caused by a current larger than . This transition is not governed by the magnitude of the current, but by the energy applied to the sample. This is clear in the results of temporal variation of resistivity at various currents (Fig. 3). With increasing , less time is needed to cause transition (). Let us evaluate the energy spent to cause the transition. Taking into account thermal conductance () to a thermal bath with temperature , we can write the net energy needed to cause the transition () as We can evaluate the energy of Joule heating from experimental data. The cooling term, however, is difficult to estimate because of the unknown temperature dependence of . Inset of Fig. 3 shows relation between and . As seen in this figure, linearly increases as increases. This result means that we can approximate the cooling term by a constant value , i.e., . From the intercept and the slope of the inset of Fig. 3, we obtain mJ and mW. Both the and the tend to decrease as the increases. According to the specific heat data of a related material Kiryukhin , of 6 mJ corresponds to the energy to heat the sample volume between the voltage terminals from 30 K to 140 K, which is higher than .
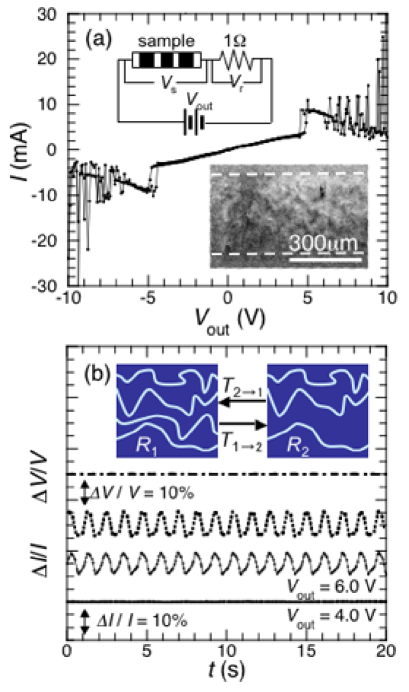
Application of a constant voltage manifests different aspects of anomalous conduction in PS states. Figure 4(a) shows an curve of LPCMO-0.7 at 30 K. For measurements at constant voltages, we used an experimental configuration schematically drawn in the inset of Fig. 4(a). The horizontal axis is the voltage applied by the power source (). The vertical axis is the current evaluated from the voltage drop at the standard resistance of 1 () connected in series to the sample. In this - curve, the ohmic relation at low voltage breaks down at around 5 V. In the state above 5 V contact , conduction is still inhomogeneous. The lower inset of Fig. 4(a) is a differential MO image at V. Inhomogeneous distribution of bright and dark area in the MO image indicates inhomogeneous current flow in the sample at this voltage Tokunaga2 .
The noisy - profile above 5 V originates from temporal variation of at a constant voltage. Solid lines in Fig. 4(b) show currents at and 6 V as a function of time. Data at V show a periodic oscillation of with the frequency of about 1 Hz. One has to be careful here because instability in the power source may cause such an oscillation when the sample shows negative differential resisitance Ogawa . However, this is not the case for the present observation. The dash-dotted line in Fig. 4(b) represents the voltage drop at the sample (). We cannot see significant change in . Thereby, observed oscillations of cannot be ascribed to instability of the voltage source. The current oscillation survives more than 1 hour unless we change the experimental condition. Such current oscillations are also observed in Cr3%-NCMO. Therefore, we think this phenomenon is intrinsic in PS states. The frequency and amplitude change with changing , temperature, and magnetic field. Details of the change in oscillation will be reported in a separate paper.
In the following, let us discuss the origin of this current oscillation. Application of large current or voltage causes heating of the sample and closes conduction paths. Let us consider a situation where a certain conduction path closes upon heating caused by an applied voltage [see insets of Fig. 4(b)]. We define the resistance with and without the path as and , respectively (). If the cooling power satisfies , the sample tends to warm up (cool down) at (). Let us assume the discontinuous change between the two states and hysteretic response against temperature change, i.e. annihilation (creation) of the path takes place at (), where . Introduction of the hysteresis is consistent with temperature dependence of resistivity shown in insets of Figs. 1(a) and (b). The observed oscillation of current at V corresponds to that of between 740 and 800 at a frequency Hz. Taking the heat capacity mJ/K Kiryukhin , we obtain this frequency when K for mW at which heating and cooling processes become symmetric pc . The essential point to cause periodic oscillation is discontinuity and hysteresis of resistance, which are characteristic of first-order transition. Since this simple model considers only two states with and , it cannot precisely reproduce the observed waveform. Introducing temperature dependence of resistance and spatial variation of the phase of oscillation, we obtain a smooth variation of as shown by a dotted line in Fig. 4(b). Temperature dependence of resistance mainly comes from that in the metallic paths for a fixed conduction-path geometry. In the calculation of Fig. 4(b), we used = 0.01 K-1 deduced from the curve at kOe, where the whole sample is metallic.
Optimization of low-field magnetoresistance and current oscillation is our future goal. We believe that it will open new applications of the phase-separated states.
In conclusion, we observed anomalous transport properties in phase-separated manganites of (La1-yPry)0.7Ca0.3MnO3 (=0.7) and Nd0.5Ca0.5Mn1-zCrzO3 (=0.03). Application of a large current causes a change from a metallic to an insulating state by Joule heating. This state supported by a large current is sensitive to magnetic fields and produces low field negative magnetoresistance effect. Application of a constant voltage causes oscillation of transport currents, which can be explained using a hysteretic and discontinuous transition between the metallic and insulating states.
Acknowledgements.
This work is supported by Grant-in-aid for Scientific Research from the Ministry of Education, Culture, Sports, Science and Technology.References
- (1) R. M. Kusters. J. Singleton, D. A. Kenn, R. McGreevy, and W. Hayes, Physica B 155, 362 (1989).
- (2) R. von Helmolt, J. Wecker, B. Holzapfel, L. Schultz, and K. Samwer, Phys. Rev. Lett. 71, 2331 (1993).
- (3) K. Chahara, T. Ohno, M. Kasai, and Y. Kozono, Appl. Phys. Lett. 63, 1990 (1993).
- (4) H. Ju, C. Kwon, Qi Li, R. L. Greene, and T. Venkatesan, Appl. Phys. Lett. 65, 2108 (1994).
- (5) S. Jin, T. H. Tiefel, M. McCormack, R. A. Fastnacht, R. Ramesh, and L. H. Chen, Science 264, 413 (1994).
- (6) Y. Tokura, A. Urushibara, Y. Moritomo, T. Arima, A. Asamitsu, G. Kido, and N. Furukawa, J. Phys. Soc. Jpn. 63, 3931 (1994).
- (7) P. W. Anderson and H. Hasegawa, Phys. Rev. 100, 675 (1955).
- (8) P. -G. de Gennes, Phys. Rev. 118, 141 (1960).
- (9) A. J. Millis, P. B. Littlewood, and B. Shraiman, Phys. Rev. Lett. 74, 5144 (1995).
- (10) H. Y. Hwang, S-W. Cheong, P. G. Radaelli, M. Marezio, and B. Batlogg, Phys. Rev. Lett. 75, 914 (1995).
- (11) Y. Tomioka, Y. Okimoto, J. H. Jung, R. Kumai, and Y. Tokura, Phys. Rev. B 68, 094417 (2003).
- (12) H. Kuwahara, Y. Tomioka, A. Asamitsu, Y. Morimtomo, and Y. Tokura, Science 270, 961 (1995).
- (13) Y. Tomioka, A. Asamitsu, H. Kuwahara, Y. Morimtomo, and Y. Tokura, Phys. Rev. B 53, R1689 (1996).
- (14) M. Tokunaga, N. Miura, Y. Tomioka, and Y. Tokura, Phys. Rev. B 57, 5259 (1998).
- (15) E. Dagotto, Phys. Rep. 344, 1 (2001), and references therein.
- (16) M. Mayr, A. Moreo, J. A. Verges, J. Arispe, A. Feiguin, and E. Dagotto, Phys. Rev. Lett. 86, 135 (2001).
- (17) M. Uehara, S. Mori, C. H. Chen, and S. -W. Cheong, Nature 399, 560 (1999).
- (18) M. Fth, S. Freisem, A. A. Menovsky, Y. Tomioka, J. Aarts, and J. A. Mydosh, Science 285, 1540 (1999).
- (19) M. Tokunaga, Y. Tokunaga, and T. Tamegai, Phys. Rev. Lett. 93, 037203 (2004).
- (20) T. Kimura, Y. Tomioka, R. Kumai, Y. Okimoto, and Y. Tokura, Phys. Rev. Lett. 83, 3940 (1999).
- (21) V. Kiryukhin, B. G. Kim, V. Podzorov, S. -W. Cheong, T. Y. Koo, J. P. Hill, I. Moon, and Y. H. Jeong, Phys. Rev. B 63, 024420 (2000).
- (22) In Fig. 4(a), the slope in the ohmic region mainly comes from the resistance of the current leads (manganin wires) and the contact resistance.
- (23) K. Ogawa, W. Wei, K. Miyano, Y. Tomioka, and Y. Tokura, Phys. Rev. B 57, R15033 (1998).
- (24) As estimated before, in the sample volume between voltage terminals is 9 mW. Since the distance between voltage terminals is about 1/5 of the sample length, 46.8 mW is a reasonable value for simulation.