Lateral–Pressure Profiles in Cholesterol–DPPC Bilayers
Abstract
By means of atomistic molecular dynamics simulations, we study cholesterol–DPPC (dipalmitoyl phosphatidylcholine) bilayers of different composition, from pure DPPC bilayers to a 1:1 mixture of DPPC and cholesterol. The lateral-pressure profiles through the bilayers are computed and separated into contributions from the different components. We find that the pressure inside the bilayer changes qualitatively for cholesterol concentrations of about or higher. The pressure profile then turns from a rather flat shape into an alternating sequence of regions with large positive and negative lateral pressure. The changes in the lateral-pressure profile are so characteristic that specific interaction between cholesterol and molecules such as membrane proteins mediated solely via the lateral-pressure profile might become possible.
I Introduction
From a macroscopic point of view a planar lipid membrane in equilibrium has, by definition, a vanishing surface tension. However, on a microscopic level there is, within the membrane, local lateral pressure, i. e., pressure tangential to the interface. Only when all of the local contributions are summed and averaged along the bilayer normal, the net pressure vanishes. The local lateral pressure arises from the different structural components of the lipid bilayer Marsh (1996) and, almost counter-intuitively, each of these contributions can be of the order of several hundreds of bars.
The importance of lateral pressure profiles has been discussed in several recent reviews Ben-Shaul (1995); Marsh (1996); Kinnunen (2000); Bezrukov (2000); Eckenhoff (2001). The increased interest in understanding lateral pressure profiles is easily understood as lateral pressure has been proposed to have an important role in, for example, general anaesthesia Cantor (1997a); Eckenhoff (2001) or inhibition and regulation of protein function de Kruijff (1997) (see references 25–50 in Ref. van den Brink-van der Laan et al., 2004 for a list of proteins for which a relation to lateral pressure has been suggested).
Due to the absence of good probes for lateral pressure, direct experimental measurements are difficult and only a single experimental study exists at the present Templer et al. (1998). In contrast, computer simulations have for the past ten years been able to supply direct, yet not straightforward, access to study pressure profiles and their response to changes in the membrane. Calculations of lateral pressure profiles are a delicate matter as already the introduction of small simplifications to the system can render the results questionable. For example, the reported results for pure lipid bilayer systems from coarse-grained simulations Goetz and Lipowsky (1998); Harries and Ben-Shaul (1997); Shillcock and Lipowsky (2002) disagree with their counterparts from atomistic simulations Lindahl and Edholm (2000); Gullingsrud and Schulten (2004).
In this paper, we study the effects of cholesterol on lateral pressure. Cholesterol is an essential component of all Eukaryotic cell membranes where it plays a crucial role for both static structure and dynamics Yeagle (1985); Simons and Ikonen (2000). In particular it regulates the fluidity of the cell membrane McMullen and McElhaney (1996). All of this goes along with changes in the lateral pressure profile. Indirect evidence for the importance of cholesterol on the lateral pressure comes from studies of membrane channels which are highly sensitive to the pressure of their environment Sukharev et al. (1997); Hamill and Martinac (2001). One such channel is the nicotinic acetylcholine receptor which ceases to function in the absence of cholesterol Rankin et al. (1997).
Apart from the fundamental importance of cholesterol and its effect on lateral pressure, the study of cholesterol is interesting for a second reason: cholesterol is a highly specific molecule. Already small modifications of its sterol structure lead to significant changes of the membrane properties Endress et al. (2002); Scheidt et al. (2003). Generic theories of lateral pressure describe a molecule basically only by its volume and its rigidity. When such theories are applied to cholesterol Cantor (1999b), they thus inevitably fail to capture many essential features of cholesterol, and even predict pressure changes of wrong sign in some parts of the bilayer.
In this article, we thus use atomistic molecular dynamics simulations to study lateral pressure profiles for six different systems, ranging from a pure DPPC bilayer to a bilayer consisting of a 1:1 mixture of DPPC and cholesterol. This paper is, to the author’s knowledge, the first detailed atomistic computational study addressing the effect of cholesterol or other small molecules on the build-up of the lateral pressure profile in phospholipid membranes.
II Local pressure
The pressure tensor can be computed as
| (1) |
from the kinetic energy density tensor and the configuration stress tensor . Both of the latter quantities can be expressed in terms of atomistic positions, velocities and forces as
| (2) | |||
| (3) |
and are thus accessible in a MD simulation. While the above expressions are, strictly speaking, defined only if the summations are extended over the entire simulation volume Heinz et al. (2004), in practise it is possible to divide the different contributions into slices according to the positions of the involved atoms Lindahl and Edholm (2000).
This implies, however, that the force between particles and is known explicitly. This is not the case if a multipole or lattice based method (such as PME) is used to evaluate electrostatic interaction. In the first reported atomistic computation of pressure profiles Lindahl and Edholm (2000) electrostatics was therefore truncated a distance of . As it is known by now, however, using abrupt truncation, especially at such a short distance, introduces significant artifacts into bilayer systems Patra et al. (2003); Anézo et al. (2003); Patra et al. (2004a, b) and thus needs to be avoided. We thus use reaction-field technique that has been shown to give results consistent with the application of long-range electrostatics Patra et al. (2004b) while at the same time employing explicit expressions for .
The global pressure is equal to the average of the local pressures, and any condition on the global pressure thus translates onto the pressure profile. Since the outside of a bilayer is at equilibrium with the environment (i. e., approximately in most cases), the average local pressure has to be equal to that value. If the global pressure would be different, the system would react by shrinking or expanding, and thus would not be in equilibrium.
Still, there is nonvanishing local pressure even in equilibrium. The existence of an interface between the water and the lipid goes along with an energy penalty which could be lowered by packing the bilayer more densely, thereby decreasing the area per lipid. Steric constraints between the lipid tails prevent this from happening. The equilibrium value of the area per lipid is thus a compromise between the “wishes” of the head groups and the tails. This is directly reflected in the lateral–pressure profile. Since the interface region prefers a further reduction of the area per lipid, the local lateral pressure there is negative (pointing inwards) whereas it is positive in the tail region (pointing outwards).
The lateral pressure profile in equilibrium thus is a direct reflection of the inhomogeneity of the bilayer along the bilayer normal. In contrast, the bilayer is homogeneous parallel to the bilayer interface. In equilibrium, the normal component of the local pressure thus has to vanish everywhere. (More correctly, it has to be constant and equal to the applied external pressure of .) In contrast to the above theoretical argument, a non-vanishing normal pressure component is found in the numerical simulations, in magnitude about of the lateral component. We attribute this to the use of distance-constraints in our simulation. For computational efficiency, the distance between bonded atoms is kept constant, meaning that the system cannot locally expand or contract to reduce the local pressure. This “constraint force” was studied in Ref. Lindahl and Edholm, 2000, and the values quoted there are able to explain the values of the normal pressure found in our simulation. Since effects of numerics are isotropic on average, we can thus improve the lateral component of the pressure by subtracting the normal component from it before the analysis. This will be done throughout this paper.
III Simulation details
We study lipid bilayers comprised of 128 molecules (64 per leaflet), at various ratios of dipalmitoyl phosphatidylcholine (DPPC) and cholesterol, hydrated by 3655 water molecules. DPPC molecules are described by the model from Ref. Tieleman and Berendsen, 1996, which utilises the description of lipids from Ref. Berger et al., 1997. Cholesterol was described by the model from Ref. Höltje et al., 2001 and the SPC model Berendsen et al. (1981) was used to describe water. The simulations were performed using the Gromacs package, both in the standard release Lindahl et al. (2001) and in an adapted version that allows the computation of local pressures Lindahl and Edholm (2000).
For computing electrostatics interactions, we employed a twin-range setup Bishop et al. (1997) in which the interactions within a distance were evaluated at every integration step, and those between and only every tenth integration time step. A reaction-field approach Tironi et al. (1995) was used to account for interaction outside of by assuming a homogeneous dielectric with . Lennard–Jones interaction was truncated at .
DPPC, cholesterol and water molecules were separately coupled to a heat bath at temperature , and the pressure was kept at , both using the Berendsen algorithms Berendsen et al. (1984). The size of the simulation box in the plane of the bilayer (- plane) was allowed to fluctuate independently of its height.
As initial configurations for all simulations we used the final configurations of simulations Falck et al. (2004b) where electrostatics were treated by particle-mesh Ewald (PME) Essmann et al. (1995); Frenkel and Smit (2002). The actual simulation procedure was divided into two steps. In a first step, trajectories were generated from these structures for all cholesterol concentrations using the standard version of Gromacs. Electrostatics was treated by reaction field technique Tironi et al. (1995), and the generated configurations were saved every . The bond lengths of DPPC molecules were constrained by the LINCS algorithm Hess et al. (1997) and water molecules were kept rigid by the SETTLE algorithm Miyamoto and Kollman (1992), such that an integrator time step of could be used. In the second step, the pressure profiles were generated from this trajectory using an adapted version of Gromacs (see below for details). In these runs, the SHAKE algorithm Ryckaert et al. (1977) was used to constrain bond lengths
Resolving the pressure spatially makes the simulations about one order of magnitude slower than a normal simulation. The pressure profiles were thus computed in a second step, based on the saved configurations. Starting at every saved configuration, a simulation was run to compute the pressure profile. The first were ignored to rule out effects of finite precision of the saved configurations. Unless mentioned otherwise, only the final of each simulation were included in the analysis.
The instantaneous pressure , computed from Eq. (1), is fluctuating quickly in time. Even when the instantaneous spatial average over the entire simulation box is considered, the pressure easily changes by several hundred bars within a single integration time step. Computing a statistically relevant pressure profiles thus is numerically challenging since one has to sample a large number of configurations. We evaluated the pressure profile for a number of simulation frames that is far larger than in previous studies where pressure profiles of bilayers were computed Lindahl and Edholm (2000); Gullingsrud and Schulten (2004). This allowed us to divide the simulation box into bins for computing the pressure profile, with the result having only negligible numerical noise. The remaining uncertainty in the pressure profile is mainly due to the temporal change of the area per lipid. To arrive at this data quality, a total of approximately 25 000 hours of cpu time was needed.
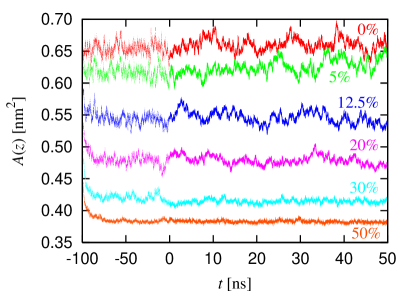
In previous MD studies on cholesterol–DPPC bilayers, electrostatics were handled either by plain cutoff Tu et al. (1998) or PME Hofsäß et al. (2003); Falck et al. (2004b). In our simulations we used reaction-field technique, motivated by the mutual consistency between reaction-field technique and PME found for pure DPPC systems Patra et al. (2004b). From our simulations we found that the results with reaction-field technique and PME are almost identical also for mixed cholesterol–DPPC bilayers. We thus refrain from reproducing the entire standard set of quantities that are used to characterise a bilayer. Rather, we show only the temporal development of the area per lipid in Fig. 1. The results of the earlier simulations Falck et al. (2004b) done using PME are also shown there in compressed form from to . From Fig. 1 it is then immediately obvious that changing the electrostatics treatment from PME to reaction field at has no relevant effect onto the systems, and that the systems are in equilibrium.
IV Pressure profiles
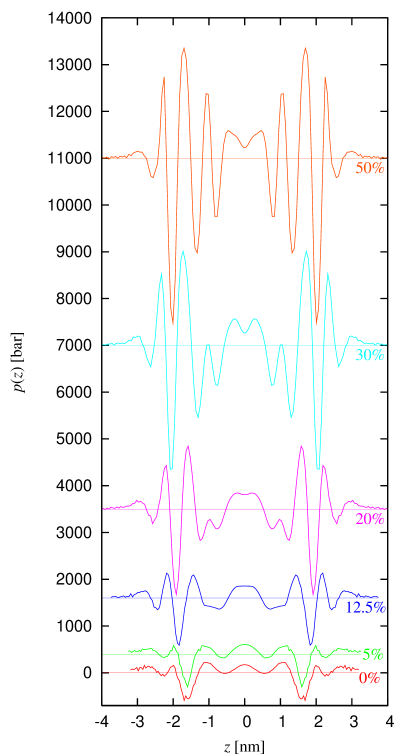
The computed lateral pressure profiles are summarised in Fig. 2. We first want to discuss a few general features.
First, for low cholesterol concentration, the pressure does not decrease to zero at the edges of the simulation box. This is a sign that the bilayer is not fully hydrated, and it was estimated that an additional – water molecules per lipid would be needed for complete hydration Lindahl and Edholm (2000). This number is in agreement with our results. Increasing cholesterol concentration means a decrease of the number of lipid molecules, hence an increase in the number of water molecules per lipid. At cholesterol, the number of water molecules per lipid has increased by . For this and higher cholesterol concentrations the pressure in the bulk water phase indeed becomes zero, as can be seen from Fig. 2.
Second, the lateral pressure profile is not flat but some parts of the bilayer would like to expand, at the same time that other parts would like to contract. While the net pressure, averaged over the entire bilayer, is small, the local pressure can be much higher than typical macroscopic pressures. A simple estimate shows that the local lateral pressure in the bilayer core can be well over and close to the interface can reach values exceeding Gullingsrud and Schulten (2004). Our results for pure DPPC agree both qualitatively and quantitatively with earlier results Lindahl and Edholm (2000) with small differences in the peak positions close the interface due to the different treatment of electrostatics in that study.
Third, the magnitude of the local lateral pressure becomes higher as the cholesterol concentration increases. While for small cholesterol concentrations the local pressure is of the order of few hundred bars, it increases to thousands of bar for the highest cholesterol concentrations. There is no straightforward explanation for this but this phenomenon is very likely related to higher bilayer rigidity at high cholesterol concentration since pressure gradients are ultimately related to the elastic modulus.
Finally, the pressure profiles possess additional structure in the presence of cholesterol. Without cholesterol, the lateral pressure in the lipid tail region of the bilayer is strictly nonnegative. Already for cholesterol, a small region of negative lateral pressure is seen in the figure. For cholesterol concentrations of and higher, additional structure is seen. This reflects that cholesterol is not some generic structureless object but rather possesses an internal structure. One could call this the specific effect of cholesterol, compared to the unspecific effects that are also observed.
V Partial pressures
The pressure tensor (1) arises from inter- and intramolecular pairwise forces [cf. from Eq. (3)] as well as from the kinetic motion of the atoms [cf. from Eq. (2)]. There are three components in the bilayer system (DPPC, cholesterol and water), which gives six possible combinations for the pairwise forces, and can thus be split into six contributions (DPPC–DPPC, DPPC–cholesterol, and so on), according to which kind of molecules the two atoms and causing the force belong to.
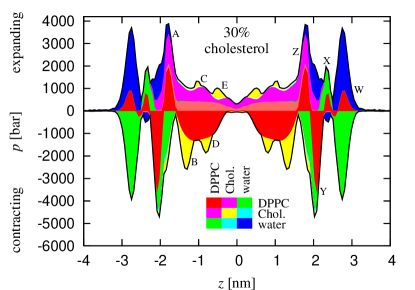
Similarly, the kinetic energy tensor can be split into three contributions. Thus, we divide the lateral pressure profile into nine contributions – six from and three from . The partial pressure profiles in Fig. 3 show the different contributions marked by different colours. The size of the coloured area directly gives the pressure due to that contribution. The arrangement of the colours, i. e., whether a given colour is close to the -axis or further away, has no physical meaning. The kinetic contribution from the DPPC molecules is marked with the same colour tone but somewhat lighter (i. e., light red) than the DPPC–DPPC contribution from the forces (i. e., dark red), and so on.
There exists a fundamental difference between the tensor , in that it depends only on positions and forces and thus describes only the static properties of the system, and , which depends only on the velocities and thus is a purely dynamic quantity. The kinetic energy per particle in Eq. (2) can be larger than as, e. g., bond vibrations or nonbonded interactions contribute energy to the translational degrees of freedom. The increase in kinetic pressure depends on whether these interactions are mainly oriented parallel to the - plane or normal to it. It thus complements the traditional deuterium or NMR order parameter that is used to quantify orientational orientation along a chain Tieleman et al. (1997).
Each contribution can be either expanding (positive pressure) or contracting (negative pressure). The sum of all expanding contributions is shown as black line in the figure. The same applies to the sum of all contracting contributions. The difference between these two values gives the pressure profile that was shown in Fig. 2. It should be noted that this difference is significantly smaller in magnitude than each of the two original terms.
As more cholesterol is added, the positions of the pressure profile peaks shift. Simultaneous analysis of both the pressure profile and the atom density profiles as a function of cholesterol concentration allows us to find correlations between pressure and atom positions. The result of this analysis is included in Fig. 3. Labels “A”–“E” refer to peak positions caused by cholesterol, and labels “W”–“Z” to DPPC.
Let us now take a closer look at the different regions in the bilayer.
V.1 Interface region
There is hardly any contact between water and cholesterol molecules, so one might be tempted to assume that the interface region (also referred to as headgroup region) of the bilayer should be hardly influenced by cholesterol at all. The opposite is the case, as is seen from Fig. 3. Cholesterol reduces the area per lipid of the bilayer, and that strongly influences also the interface region, but the effects there are mainly generic and unspecific – any substance that would reduce the area per lipid would have a similar effect.
The outermost part of the bilayer is formed by the choline group of the DPPC molecules (labelled as “W”), and the total pressure there is negative. The attraction is dominated by the solvation energy between water and the polar lipid headgroups. Most of the the contracting pressure is compensated by the positive pressure among the water molecules. Entropy plays an important role in the latter as water molecules become ordered in the electrostatic field from the zwitterionic headgroups Lindahl and Edholm (2000). The behaviour of this region of the pressure profile depends only weakly on cholesterol concentration as the hydration energy depends only weakly on the area per lipid Marsh (1996). Note that both the DPPC bilayer (red) and the water phase (blue) would like to expand, and it is only the interaction between these two (green), commonly called simply “hydrophobicity”, that is trying to reduce the area of the interface (green).
A bit further down in the bilayer, the phosphate groups of the DPPC molecules are located. The mutual arrangement between the choline and phosphate groups depends heavily on the area per lipid Gurtovenko et al. (2004); Falck et al. (2004b). For large area per lipid, and thus for low cholesterol concentration, both groups are, on average, located in the same plane. In this case, the effects of the phosphate and the choline group cannot be separated in the pressure profile. At sufficiently large cholesterol concentration, the choline group is tilted up, and an additional peak (“X”) thus appears. The pressure is positive as the water molecules are oriented according to the charge of the choline group and thus have an unfavourable interaction with the oppositely charged phosphate group.
The inner boundary of the interface region is marked by the carbon (labelled as “Y”). This is the furthest extension to where there is noteworthy penetration of water into the bilayer. Furthermore, this is the outermost position of cholesterol, occupied by its hydroxyl group (“A”). Only inside this peak, cholesterol has, in addition to its change of the area per lipid, also direct effects.
V.2 Acyl chain region
The acyl chain region is of special importance to the study of cholesterol-containing bilayer as here not only the acyl chains of DPPC are located (hence the name) but also the rigid four-ring structure of the cholesterol body. In the presence of cholesterol, a characteristic structure in the pressure profile develops, to the point that one might speculate on whether this is sufficient to explain specific effects, such as observed for the nicotinic acetylcholine receptor Rankin et al. (1997).
Upon increase of cholesterol concentration, an ordering of the DPPC acyl chains takes place. This ordering increases the attraction among the DPPC tails, thereby increasing the compressing pressure component, while at the same time introducing orientational correlations into the motion of the atoms of the tails, thereby increasing the expanding kinetic pressure. The kinetic pressure per DPPC molecule increases monotonously by almost a factor of from to cholesterol, and per cholesterol molecule it increases by a factor of . Cholesterol thus induces significant correlations into the motion of the atoms, and the ordering induced by cholesterol is reflected much stronger in the correlated motion of the atoms than it is in the order parameter .
The rigid four-ring structure of cholesterol offers a much more interesting chemical structure than the basically linear chains of the DPPC molecules. This shows also in the pressure profile that exhibits several well-pronounced peaks, making the pressure profiles of cholesterol-containing membranes very different from previously reported pressure profiles Lindahl and Edholm (2000); Gullingsrud and Schulten (2004). There are several atoms in the cholesterol molecules that are correlated with peaks in the pressure profile, see the labels in Fig. 3. Steric arguments can explain only same of the correlations. This should come as no surprise since the pressure at given depth in the bilayer cannot be computed solely from atomic information from that depth – the stresses in different parts of the membrane are coupled due to finite elastic modulus. The picture becomes even more difficult if one accounts also for chemistry, i. e., for favourable and unfavourable interactions between certain pairs of atoms.
The orientational correlations in the kinetic pressure, related to entropy and giving rise to kinetic pressure, complicate matters even more. There is thus little point in trying to explain the origin of every peak in the lateral partial pressure profile, especially since at the moment there is little possibility to prove or disprove any suggestion. What is sure, however, is that all the features of the lateral pressure profile are in some way related to the chemistry and structure of cholesterol.
Cholesterol is by far the most prominent steroid in any Eukaryote but it is only one member of a large group of chemically related substances that are varying only by seemingly minor changes in their structure, such as a single additional double bound or a different placement of the two carbon atoms that are sticking out from the rigid cholesterol body. Still, their properties in the membrane are distinguishably different Endress et al. (2002); Scheidt et al. (2003), and only in special cases one type of steroid can replace another in biological systems. Our results suggest that cholesterol relatives such as, e. g., lanosterol or ergosterol, would have a pressure profile that is different from the pressure profile of cholesterol systems. Unfortunately, no such simulations, let alone experimental measurements, are available at the moment.
V.3 Centre of the bilayer
The centre of the bilayer is formed by the ends of the acyl chains of the DPPC and cholesterol molecules. Both mass and electron density have a minimum at known as methyl trough. For low cholesterol concentration, there is a single peak in the pressure profile at that has been suggested to be related to interdigitation van den Brink-van der Laan et al. (2004). Understanding the centre of the bilayer is difficult as the peak in the pressure profile is found only in atomistic MD simulations Lindahl and Edholm (2000); Gullingsrud and Schulten (2004) whereas analytical theories and coarse-grained models fail to reproduce it van den Brink-van der Laan et al. (2004). Experimentally it was found that cholesterol reduces interdigitation but it should be noted that even pure DPPC bilayers are only moderately interdigitated Siminovitch et al. (1987). This is in agreement with our results in Fig. 4.
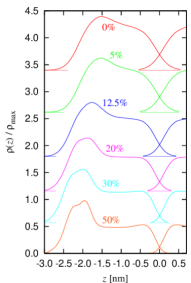
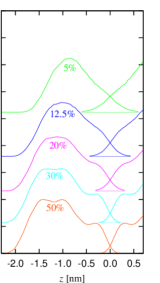
For increasing cholesterol concentration, the single peak in the pressure profile at splits into two peaks as the pressure close to increases faster than precisely at . Simultaneously, in addition to a reduction in interdigitation, the end point of the acyl chains becomes more strongly defined pronounced in the mass density profile. At the highest cholesterol concentrations, even a small peak in the mass density profiles in Fig. 4 develops near the end of the chains.
The relation between interdigitation and pressure profile in the centre thus is not obvious – our results are more consistent with the absence of such a relation. From Fig. 3 it is seen that the peak in the pressure profile around the bilayer centre does not originate in an increase of the expanding pressure components but rather from a sharp decrease of the condensing pressure. A possible explanation is that, as they are less ordered than the other atoms, the atoms at the end of acyl chains cannot make favourable contact with neighbouring chains, thereby loosing van der Waals-attraction. The shape of the pressure profile near the centre of the bilayer would thus be dominated not by the mass density profile itself but by the spatial distribution of end points of the chains. For cholesterol, this gives a peak at for small cholesterol concentration that splits into two peaks as interdigitation is reduced, in agreement with the computed pressure profiles.
VI Relation to membrane penetration
The lateral pressure profile is related to the ability of small molecules to penetrate into the bilayer. Negative pressure means that the system would like to contract. Regions with negative lateral pressure thus mark regions where it would be energetically favourable for additional particles or molecules to be inserted. Ultimately, the partitioning of a particular solute into the bilayer is determined by the free-energy profile Marrink and Berendsen (1996). The lateral pressure profile gives the volume contribution to the free-energy profile, and for nonpolar or moderately polar solutes, this is a good approximation to the full free-energy profile.
On first view, this seems to be related to free-volume theories which state that the amount of unoccupied space inside the bilayer determines its penetrability. In the context of pressure profiles, “occupied volume” is equivalent to large steric repulsive forces, resulting in a large expanding static pressure. Already from the discussion in Sec. V it should be obvious that free-volume theories face a big problem as much of the pressure inside the bilayer is either attractive or of kinetic origin.
One of the many reasons why cholesterol containing membranes are interesting systems to study is that cholesterol affects the membrane spatially inhomogeneously Lee and Petersen (2004). For example, the addition of cholesterol increases the penetration of water into most regions of the bilayer, while it reduces the water concentration in the very centre of the bilayer Marsh (2002).
These observations are easily explained within the context of lateral pressure profiles but not within free-volume theories. In the pure DPPC bilayer, the pressure in the acyl chain region is small but positive. As the cholesterol concentration is increased from to , the pressure in most of the acyl chain region becomes negative (allowing for easier penetration) while in the centre of the bilayer it becomes more positive (thus expelling particles there). Also at cholesterol, there are ample regions with negative pressure even though they become disconnected by high peaks of positive pressure.
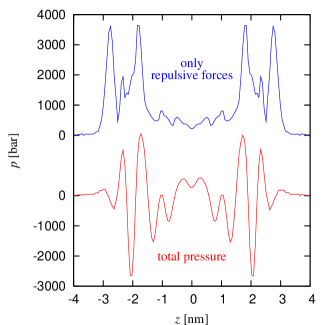
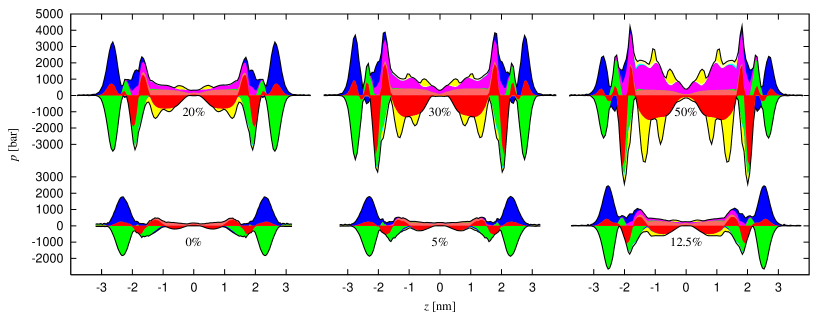
To make contact with free-volume theories, it is instructive to “compute” from Fig. 3 a “fake” pressure profile that only includes static expanding pressure contributions, shown in Fig. 5. The “correct” lateral-pressure profile changes strongly as cholesterol is added, with several new peaks appearing in the pressure profile, and the magnitude of the pressure changing by about one order of magnitude. In contrast, the free-volume profile lacks the additional structure induced by cholesterol and only changes monotonously as the cholesterol concentration is changed, and the changes are rather moderate (at least compared to the lateral-pressure profile) Falck et al. (2004b, a) – both observations apply also to the “fake” pressure profile.
The free-volume fraction is highest in the centre of the bilayer, which is simply a reflection of the bilayer trough with reduced atom density Falck et al. (2004a), and molecules such as water should thus preferably be located there. From this contradiction, it was thus realised already early that it is not the average amount of free volume that determines the penetration but rather rare fluctuations Marrink and Berendsen (1994).
Free-volume theory can be applied to compare penetration of solutes of different size through the same bilayer, as penetration then is rate-limited by a single point in the membrane, usually located at the bilayer interface Killian and van Meer (2001). Already when comparing the same bilayer at different temperatures, such a one-parameter approach may break down Sutter et al. (2004). The lateral-pressure profile, on the other hand, allows to compare also very different systems, such as bilayers with different cholesterol concentration, as the description of the bilayer is in full detail. (The description of the solute is still reduced to solely its volume, and the most straight-forward improvement to this simplification are free-energy profiles.)
VII Discussion
In this paper we have studied lateral-pressure profiles in cholesterol–DPPC bilayers at varying composition ratios. We found that the pressure profiles become more structured and complicated as the cholesterol fraction is increased (cf. Fig. 2). This is related to the structural changes in the bilayer upon addition of cholesterol. These changes can have biological consequences: proteins or other molecules are able to anchor at a given depth inside a cell membrane guided by the pressure profile van den Brink-van der Laan et al. (2004).
Biological interactions can be divided into specific and unspecific. The general view in the literature seems to be that changes via the lateral-pressure profile are rather unspecific, i. e., proteins or other molecules in a cell membrane are affected by the lateral-pressure profile but it is of secondary importance of how a change in pressure-profile was induced. For specific interaction, a direct contact between cholesterol and, e. g., a membrane channel, would be needed.
In view of the lateral-pressure profiles presented in this paper one could speculate whether a specific interaction via the pressure-profile is possible. The profile contains a wealth of additional structure, very different from what could be achieved by simply compressing the bilayer. This structure in the lateral-pressure profile might be specific enough to allow molecules such as the nicotinic acetylcholine receptor Rankin et al. (1997) to sense the presence or absence of cholesterol solely via the lateral-pressure profile
This might be an additional reason for abundance of cholesterol in eukaryotic cell membranes, and why there is so much cholesterol but so few other chemically closely related steroids – in contrast to the multitude of different lipids found in cell membranes. From that point of view, it would be interesting to see the difference between the different sterols on pressure profiles, e. g., how the pressure profile would change if cholesterol was replaced by lanosterol.
The results presented in this paper also demonstrate that the effects of cholesterol cannot be captured by simple models. Still, generic models have their advantages, and the importance of lateral pressure profiles would not have been accepted without the pioneering analytical work by Cantor in the late 1990’s Cantor (1997b, a, 1999b, 1999a). His most important contribution properly were not so much the results themselves – much of it was already known – but to cast them into a single consistent form that, e. g., allowed to relate pressure profiles to “nonbilayer lipids” or spontaneous membrane curvature.
Characteristic of such analytical theories is that they are very successful in describing plain acyl chains but already their treatment of the headgroups is rather crude Ben-Shaul (1995); van den Brink-van der Laan et al. (2004). Cholesterol is well beyond the reach of such models. In the headgroup region, the problem is the description of the mutual headgroup interactions and, even though this effect is generic, their change upon decrease in the area per lipid induced by cholesterol. In the acyl chain region, the problem is the non-generic nature of the rigid cholesterol body.
This and other atomistic studies show the power of computer simulations to resolve the details of molecular systems and to provide further insight to complex multicomponent systems. Pressure profiles are a superb example for this power due to the severe limitations encountered in experiment, coarse-grained simulations and analytical theories.
Acknowledgements.
I would like to acknowledge valuable discussions with Mikko Karttunen and support from the European Union (MRTN-CT-2004-512331).References
- Anézo et al. (2003) Anézo, C., A. H. de Vries, H.-D. Höltje, D. P. Tieleman, and S.-J. Marrink. 2003. Methodological issues in lipid bilayer simulations. J. Phys. Chem. B 107:9424–9433.
- Ben-Shaul (1995) Ben-Shaul, A. 1995. Molecular theory of chain packing, elasticity and lipid-protein interaction in lipid bilayers. vol. 1 of Handbook of Biological Physics. Elsevier, Amsterdam, 359–401.
- Berendsen et al. (1984) Berendsen, H. J. C., J. P. M. Postma, W. F. van Gunsteren, A. Di Nola, and J. R. Haak. 1984. Molecular dynamics with coupling to an external bath. J. Chem. Phys. 81:3684–3690.
- Berendsen et al. (1981) Berendsen, H. J. C., J. P. M. Postma, W. F. van Gunsteren, and J. Hermans. 1981. Interaction models for water in relation to protein hydration. In Intermolecular Forces, B. Pullman, editor. Reidel, Dordrecht, 331–342.
- Berger et al. (1997) Berger, O., O. Edholm, and F. Jahnig. 1997. Molecular dynamics simulations of a fluid bilayer of dipalmitoylphosphatidylcholine at full hydration, constant pressure, and constant temperature. Biophys. J. 72:2002–2013. The force field description is available at http://moose.bio.ucalgary.ca/Downloads/files/lipid.itp.
- Bezrukov (2000) Bezrukov, S. M. 2000. Functional consequences of lipid packing stress. Curr. Opin. Colloid Interface Sci. 5:237–243.
- Bishop et al. (1997) Bishop, T. C., R. D. Skeel, and K. Schulten. 1997. Difficulties with multiple time stepping and fast multipole algorithm in molecular dynamics. J. Comput. Chem. 18:1785–1791.
- Cantor (1997a) Cantor, R. S. 1997a. The lateral pressure profile in membranes: a physical mechanism of general anesthesia. Biochemistry 36:2339–2344.
- Cantor (1997b) Cantor, R. S. 1997b. Lateral pressures in cell membranes: a mechanism for modulation of protein function. J. Phys. Chem. 101:1723–1725.
- Cantor (1999a) Cantor, R. S. 1999a. The influence of membrane lateral pressures on simple geometric models of protein conformational equilibria. Chem. Phys. Lipids 101:45–56.
- Cantor (1999b) Cantor, R. S. 1999b. Lipid composition and the lateral pressure profile in bilayers. Biophys. J. 76:2625–2639.
- de Kruijff (1997) de Kruijff, B. 1997. Lipids beyond the bilayer. Nature 386:129–130.
- Eckenhoff (2001) Eckenhoff, R. G. 2001. Promiscuous ligands and attractive cavities: How do the inhaled anesthetics work? Mol Interv. 1:258–268.
- Endress et al. (2002) Endress, E., H. Heller, H. Casalta, M. F. Brown, and T. M. Bayerl. 2002. Anisotropic motion and molecular dynamics of cholesterol, lanosterol, and ergosterol in lecithin bilayers studied by quasi-elastic neutron scattering. Biochemistry 41:13078–13086.
- Essmann et al. (1995) Essmann, U., L. Perera, M. L. Berkowitz, T. Darden, H. Lee, and L. G. Pedersen. 1995. A smooth particle mesh Ewald method. J. Chem. Phys. 103:8577–8592.
- Falck et al. (2004a) Falck, E., M. Patra, M. Karttunen, M. T. Hyvönen, and I. Vattulainen. 2004a. Impact of cholesterol on voids in phospholipid membranes. J. Chem. Phys. 121:12676–12689.
- Falck et al. (2004b) Falck, E., M. Patra, M. Karttunen, M. T. Hyvönen, and I. Vattulainen. 2004b. Lessons of slicing membranes: Interplay of packing, free area, and lateral diffusion in phospholipid/cholesterol bilayers. Biophys. J. 87:1076–1091.
- Frenkel and Smit (2002) Frenkel, D. and B. Smit. 2002. Understanding Molecular Simulation: From Algorithms to Applications. Academic Press, San Diego, second ed.
- Goetz and Lipowsky (1998) Goetz, R. and R. Lipowsky. 1998. Computer simulations of bilayer membranes: Self-assembly and interfacial tension. J. Chem. Phys. 108:7397–7409.
- Gullingsrud and Schulten (2004) Gullingsrud, J. and K. Schulten. 2004. Lipid bilayer pressure profiles and mechanosensitive channel gating. Biophys. J. 86:3496–3509.
- Gurtovenko et al. (2004) Gurtovenko, A. A., M. Patra, M. Karttunen, and I. Vattulainen. 2004. Cationic DMPC/DMTAP lipid bilayers: Molecular dynamics study. Biophys. J. 86:3461–3472.
- Hamill and Martinac (2001) Hamill, O. P. and B. Martinac. 2001. Molecular basis of mechanotransduction in living cells. Physiol. Rev. 81:685–740.
- Harries and Ben-Shaul (1997) Harries, D. and A. Ben-Shaul. 1997. Conformational chain statistics in a model lipid bilayer: Comparison between mean field and Monte Carlo calculations. J. Chem. Phys. 106:1609–1619.
- Heinz et al. (2004) Heinz, H., W. Paul, and K. Binder. 2004. Local pressure tensor in computer simulations of molecular systems. arXiv.org:cond-mat/0309014.
- Hess et al. (1997) Hess, B., H. Bekker, H. J. C. Berendsen, and J. G. E. M. Fraaije. 1997. LINCS: A linear constraint solver for molecular simulations. J. Comp. Chem. 18:1463–1472.
- Hofsäß et al. (2003) Hofsäß, C., E. Lindahl, and O. Edholm. 2003. Molecular dynamics simulations of phospholipid bilayers with cholesterol. Biophys. J. 84:2192–2206.
- Höltje et al. (2001) Höltje, M., T. Förster, B. Brandt, T. Engels, W. von Rybinski, and H.-D. Höltje. 2001. Molecular dynamics simulations of stratum corneum lipid models: fatty acids and cholesterol. Biochim. Biophys. Acta 1511:156–167. The topology file is available from http://www.gromacs.org/topologies/uploaded_molecules/ cholesterol.tgz.
- Killian and van Meer (2001) Killian, J. A. and G. van Meer. 2001. The ‘double lives’ of membrane lipids. EMBO reports 21:91–95.
- Kinnunen (2000) Kinnunen, P. K. J. 2000. Lipid bilayers as osmotic response elements. Cell. Physiol. Biochem. 10:243–250.
- Lee and Petersen (2004) Lee, C. C. and N. O. Petersen. 2004. The triple layer model: A different perspective on lipid bilayers. J. Chin. Chem. Soc. 51:1183–1191.
- Lindahl and Edholm (2000) Lindahl, E. and O. Edholm. 2000. Spatial and energetic-entropic decomposition of surface tension in lipid bilayers from molecular dynamics simulations. J. Chem. Phys. 113:3882–3893.
- Lindahl et al. (2001) Lindahl, E., B. Hess, and D. van der Spoel. 2001. GROMACS 3.0: a package for molecular simulation and trajectory analysis. Journal of Molecular Modeling 7:306–317.
- Marrink and Berendsen (1994) Marrink, S.-J. and H. J. C. Berendsen. 1994. Simulation of water transport through a lipid membrane. J. Phys. Chem. 98:4155–4168.
- Marrink and Berendsen (1996) Marrink, S. J. and H. J. C. Berendsen. 1996. Permeation process of small molecules across lipid membranes studied by molecular dynamics simulations. J. Phys. Chem. 100:16729–16738.
- Marsh (1996) Marsh, D. 1996. Lateral pressure in membranes. Biochim. Biophys. Acta 1286:183–223.
- Marsh (2002) Marsh, D. 2002. Membrane water-penetration profiles from spin labels. Eur. Biophys. J. 31:559–562.
- McMullen and McElhaney (1996) McMullen, D. P. W. and R. N. McElhaney. 1996. Physical studies cholesterol-phospholipid interactions. Curr. Opin. Colloid Interface Sci. 1:83–90.
- Miyamoto and Kollman (1992) Miyamoto, S. and P. A. Kollman. 1992. SETTLE: An analytical version of the SHAKE and RATTLE algorithms for rigid water models. J. Comput. Chem. 13:952–962.
- Patra et al. (2003) Patra, M., M. Karttunen, M. Hyvönen, E. Falck, P. Lindqvist, and I. Vattulainen. 2003. Molecular dynamics simulations of lipid bilayers: Major artifacts due to truncating electrostatic interactions. Biophys. J. 84:3636–3645.
- Patra et al. (2004a) Patra, M., M. Karttunen, M. T. Hyvönen, E. Falck, and I. Vattulainen. 2004a. Lipid bilayers driven to a wrong lane in molecular dynamics simulations by subtle changes in long-range electrostatic interactions. J. Phys. Chem. B 108:4485–4494.
- Patra et al. (2004b) Patra, M., M. Karttunen, M. T. Hyvönen, E. Falck, and I. Vattulainen. 2004b. Long-range interactions in molecular simulations: Accuracy and speed. arXiv.org:cond-mat/0410210.
- Rankin et al. (1997) Rankin, S. E., G. H. Addona, M. A. Kloczewiak, B. Bugge, and K. W. Miller. 1997. The cholesterol dependance of activation and fast desensitization of the nicotinic acetylcholine receptor. Biophys. J. 73:2446–2455.
- Ryckaert et al. (1977) Ryckaert, J.-P., G. Ciccotti, and H. J. C. Berendsen. 1977. Numerical integration of the cartesian equations of motion of a system with constraints; molecular dynamics of n-alkanes. J. Comp. Phys. 23:327–341.
- Scheidt et al. (2003) Scheidt, H. A., P. Müller, A. Herrmann, and D. Huster. 2003. The potential of fluorescent and spin-labeled steroid analogs to mimic natural cholesterol. J. Biol. Chem. 278:45563–45569.
- Shillcock and Lipowsky (2002) Shillcock, J. C. and R. Lipowsky. 2002. Equilibrium structure and lateral stress distribution of amphiphilic bilayers from dissipative particle dynamics simulations. J. Chem. Phys. 117:5048–5061.
- Siminovitch et al. (1987) Siminovitch, D. J., M. J. Ruocco, A. Makriyannis, and R. G. Griffin. 1987. The effect of cholesterol on lipid dynamics and packing in diether phosphatidylcholine bilayers. X-ray diffraction and 2H-NMR study. Biochim. Biophys. Acta 901:191–200.
- Simons and Ikonen (2000) Simons, K. and E. Ikonen. 2000. How cells handle cholesterol. Science 290:1721–1726.
- Sukharev et al. (1997) Sukharev, S. I., P. Blount, B. Martinac, and C. Kung. 1997. Mechanosensitive channels of escheria coli – the MscL gene, protein and activities. Annu. Rev. Physiol. 59:633–657.
- Sutter et al. (2004) Sutter, M., T. Fiechter, and G. Imanidis. 2004. Correlation of membrane order and dynamics derived from time-resolved fluorescence measurements with solute permeability. J. Pharmaceutical Sciences 93.
- Templer et al. (1998) Templer, R. H., S. J. Castle, A. R. Curran, G. Rumbles, and D. R. Klug. 1998. Sensing isothermal changes in the lateral pressure in model membranes using di-pyrenyl phosphatidylchlonine. Faraday Discuss. 111:41–53.
- Tieleman and Berendsen (1996) Tieleman, D. P. and H. J. C. Berendsen. 1996. Molecular dynamics simulations of a fully hydrated dipalmitoylphosphatidylcholine bilayer with different macroscopic boundary conditions and parameters. J. Chem. Phys. 105:4871–4880. The topology file is available from http://moose.bio.ucalgary.ca/Downloads/files/dppc.itp.
- Tieleman et al. (1997) Tieleman, D. P., S.-J. Marrink, and H. J. C. Berendsen. 1997. A computer perspective of membranes: Molecular dynamics studies of lipid bilayer systems. Biochim. Biophys. Acta 1331:235–270.
- Tironi et al. (1995) Tironi, I. G., R. Sperb, P. E. Smith, and W. F. van Gunsteren. 1995. A generalized reaction field method for molecular dynamics simulations. J. Chem. Phys. 102:5451–5459.
- Tu et al. (1998) Tu, K., M. L. Klein, and D. J. Tobias. 1998. Constant-pressure molecular dynamics investigation of cholesterol effects in a dipalmitoylphosphatidylcholine bilayer. Biophys. J. 75:2147–2156.
- van den Brink-van der Laan et al. (2004) van den Brink-van der Laan, E., J. A. Killian, and B. de Kruijff. 2004. Nonbilayer lipids affect peripheral and integral membrane proteins via changes in the lateral pressure profile. Biochim. Biophys. Acta 1666:275–288.
- Yeagle (1985) Yeagle, P. L. 1985. Cholesterol and the cell membrane. Biochim. Biophys. Acta 822:267–287.