Present Address: ]Department of Applied Physics, Tokyo University of Science, Shinjuku-ku, Tokyo 162-8601, Japan Present Address: ]Hiroshima Synchrotron Radiation Center, Hiroshima University, Higashi-Hiroshima, Hiroshima 739-8521, Japan.
Present Address: ]National Synchrotron Research Center, PO Box 93, Nakhon-Ratchasima 30000, Thailand.
Unusual electron-doping effects in Sr2-xLaxFeMoO6 observed by photoemission spectroscopy
Abstract
We have investigated the electronic structure of electron-doped Sr2-xLaxFeMoO6 (=0.0 and 0.2) by photoemission spectroscopy and band-structure calculations within the local-density approximation+ (LDA+) scheme. A characteristic double-peak feature near the Fermi level () has been observed in the valence-band photoemission spectra of both =0.0 and 0.2 samples. A photon-energy dependence of the spectra in the Mo 4 Cooper minimum region compared with the band-structure calculations has shown that the first peak crossing consists of the (Fe+Mo) states (feature A) and the second peak well below is dominated by the Fe states (feature B). Upon La substitution, the feature A moves away from by 50 meV which is smaller than the prediction of our band theory, 112 meV. In addition, an intensity enhancement of A and B has been observed, although B is not crossing . Those two facts are apparently incompatible with the simple rigid-band shift due to electron doping. We point out that such phenomena can be understood in terms of the strong Hund’s rule energy stabilization in the 3 configuration at the Fe sites in this compound. From an observed band-narrowing, we have also deduced a mass enhancement of 2.5 with respect to the band theory, in good agreement with a specific heat measurement.
pacs:
79.60.-i, 71.20.Ps, 75.50.GgI Introduction
Industrial demands on seeking new materials with exotic magneto-transport properties have been expanding the basic research field of transition-metal oxides with unusual magnetic and transport properties. Recent re-investigations on the family of double perovskite-type oxides O6 are one of such examples. The revived interest on the double perovskites has its origin in the large tunneling magneto-resistance discovered in Sr2FeMoO6 and Sr2FeReO6,KobayashiNature ; KobayashiRe although it has already been known since 1960’s that Sr2FeMoO6 is a ferrimagnetic (or ferromagnetic) metal with a quite high ferrimagnetic transition temperature () of 420 K.Galasso
Several band-structure calculations and optical or electron-spectroscopic studies have confirmed that those iron-based compounds generally have the half-metallic density of states (DOS) at the Fermi level ().KobayashiNature ; MoritomoPRB ; Tomioka ; Fang ; Wu ; Kang ; SaitohDP Ferrimagnetism accompanied by metallic conductivity and the half-metallic density of states (DOS) naturally reminds us of the colossal magnetoresistive manganates and the double exchange (DE) mechanism. Indeed, several authors have pointed out that DE can explain the electronic properties of Sr2FeMoO6,Kang ; SaitohDP ; Martinez ; MoritomoPRBR while others have proposed a new mechanism of ferrimagnetic metal.SarmaPRL ; KT Nevertheless, it is common in any models that the carrier density or DOS at has much importance since the ferromagnetic interaction between Fe local spins is mediated by charge carriers (in DE models) or the Fe-O-Mo hybridized states (in hybridization models).
In this sense, a study of carrier-doping effects on the electronic structure of Sr2FeMoO6 is necessary to seek the origin of the ferrimagnetism of this compound. Navarro et al. have recently investigated this issue using polycrystalline samples of Sr2-xLaxFeMoO6.NavarroPES Sr2-xLaxFeMoO6 can be regarded as an electron-doped system of Sr2FeMoO6, where corresponds to the number of doped electron per one Fe/Mo site. They have found that the spectral weight linearly increases with , in accordance with a linear increase of . Although their result and argument seem to be clear and reasonable, there still remains an experimental and a theoretical concern: the former is about polycrystalline nature of their samples as well as the scratching surface treatment. In our previous paper,SaitohDP we have intensively discussed this issue and shown that spectra of Sr2FeMoO6 from a scraped and a fractured surface were quite different. In particular, the near- intensity was found to be considerably suppressed in scraping measurements. Since the near- intensity is directly relevant to which model is plausible, a study using single crystals should be needed to address the above issue. In connection with theoretical studies, on the other hand, electron-doping effects should be examined first by band theory before we consider the DE or other new models. For example, if the calculated DOS is increasing monotonically with electron energy, the DOS should linearly increase with .
In this paper, we study the electron-doping effects on the electronic structure of single-crystalline Sr2FeMoO6 to give insight into the mechanism of ferrimagnetism and the half-metallic DOS by photoemission spectroscopy combined with LDA+ band-structure calculations. To avoid possible complications rising from a structural phase transition and anti-site effects in heavily doped regionNavarro2001 and to probe only the electronic effects due to La substitution, we concentrate on a lightly-doped region.
II Experiment and Calculation
High quality single crystals of Sr2-xLaxFeMoO6 (=0.0 and 0.2) were grown by floating-zone method.MoritomoPRB The site disorder was about 1015% which lowers the from the ideal values,MoritomoJJAP2001 but will not seriously affect the microscopic electronic structure.SaitohDP The experiments have been performed at the beamline BL-11D of the Photon Factory using a Scienta SES-200 electron analyzer. The total energy resolution was about 5090 meV FWHM using 65200 eV photon energies. The vacuum was always better than 1.510-10 Torr and the temperature was about 20 K. To obtain the best quality of surface, we have fractured samples in situ at 20 K. The prepared surface was blackly shining like a cleaved surface, but was rough enough to get angle-integrated spectra although angle-resolved effects appeared in low photon energies to some extent. For comparison, we have also scraped samples with a diamond file.SaitohDP The spectral intensity was normalized by the total area of the full valence-band spectra and the near- spectra were scaled to them.
Band-structure calculations for non-doped Sr2FeMoO6 have been performed with the full-potential linearized augmented plane-wave (FLAPW) method within the local-density approximation (LDA)+ scheme. For effective Coulomb repulsions , we have adopted rather small values (2.0 eV for Fe and 1.0 eV for Mo, respectively). More detailed information is given in Ref. SaitohDP, .
III Results and discussion
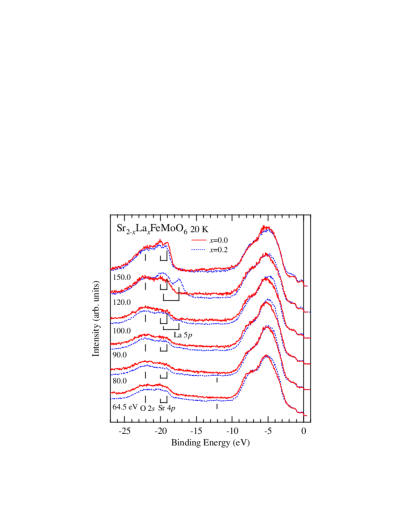
Figure 1 shows photoemission spectra of the valence-band of Sr2-xLaxFeMoO6 with shallow core levels at 20K. A doublet structure at and eV is the Sr 4 core level, which is on the long tail of the O 2 core level at eV. Upon La substitution, another doublet structure due to the La 5 core level appears at -17.4 and -19.6 eV. However, it is very weak due to a small photoionization cross section.Yeh The strong enhancement of the La 5 intensity at =120 eV is attributed to the La 44 giant resonance.Molodtsov A very small structure at 12.1 eV observed in lower photon-energy spectra is most likely due to surface aging effects.
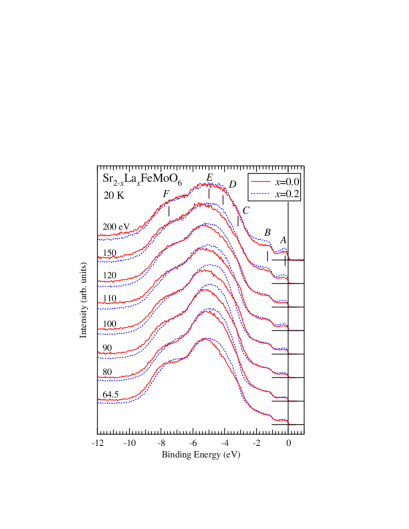
Figure 2 shows full valence-band spectra of Sr2-xLaxFeMoO6 at 20 K. One can observe six structures denoted as to . A comparison with the band-structure calculations clarifies that the double-peak structures and near correspond to the (Fe+Mo) and Fe bands, respectively.KobayashiNature ; Fang ; Wu ; Kang ; SaitohDP ; MoritomoPRBR ; SarmaPRL Also, and mostly originate from the Fe bands with a contribution from the O 2 intensity. is predominantly due to the O 2 non-bonding states. The Fe and bonding states contribute to to some extent. The features and are somewhat enhanced in the low photon-energy spectra upon La substitution. This can be primarily interpreted as angle-resolved effects because the enhancement becomes small with increasing photon energy and almost vanishes for all at the highest 200 eV spectrum.
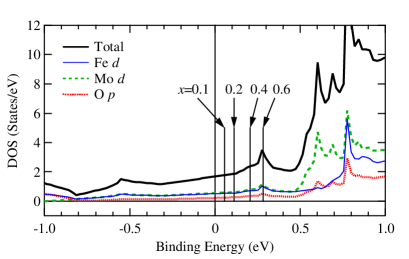
By contrast, substantial changes are observed in the near- region of all the spectra as shown in Fig. 3. Panel (a) of Fig. 3 shows near- spectra of Sr2-xLaxFeMoO6. Upon La substitution, the features and are shifted from to eV and from to eV, respectively. Although the direction of the shift is in accordance with electron doping, the amount of the shift (4050 meV)note5 is too small; Figure 4 illustrates the expected location of deduced from our LDA+ band-structure calculation assuming the rigid band shift. It predicts that =0.2 (0.2 electron doping per one Fe/Mo site) should correspond to a shift of 112 meV while the 50 meV shift of corresponds to =0.086.
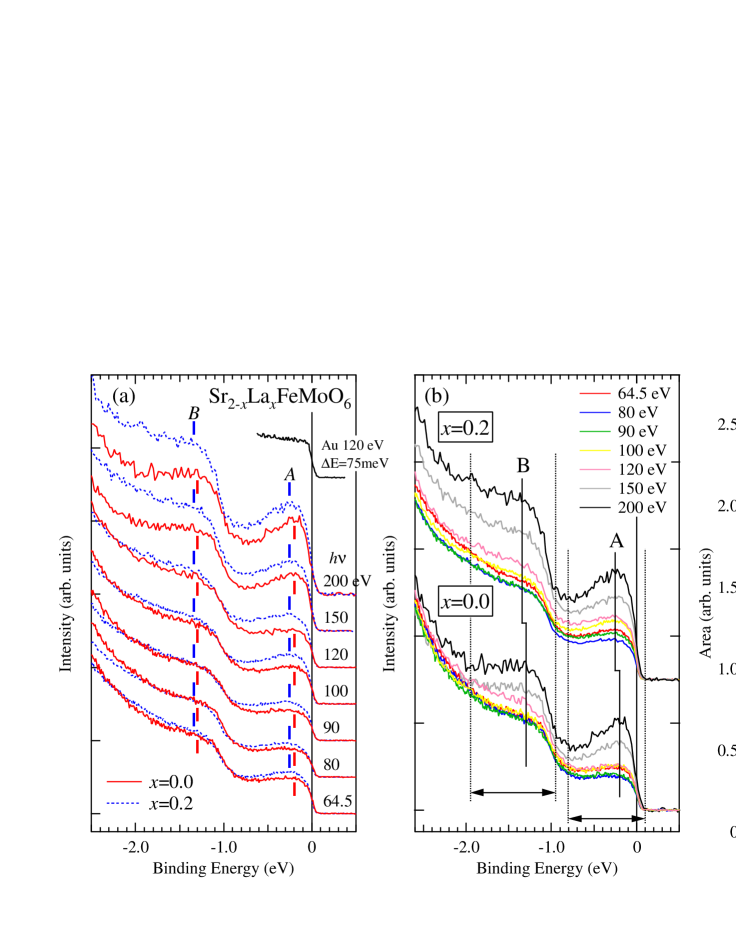
Panel (b) of Fig. 3 shows a photon-energy dependence of the near- spectra. The intensity of the features and tends to increase with , indicating that considerable Fe 3 weight compared to the O 2 one exists in those features.Yeh However, one can notice that the intensity at does not increase monotonically but has a minimum at 80 eV while such a clear minimum is not observed in . This is because the Cooper minimum of Mo 4 states strongly suppresses the Mo 4 weight around 8090 eV and only the feature has a substantial contribution from Mo 4 states.SaitohDP ; Yeh
These behaviors of the spectral weight of and vs. are summarized in Panel (c). Panel (c) shows a normalized spectral weight of and . Here we set the 64.5 eV to unity as a reference. A clear minimum around 80 eV for the feature is attributed to the Cooper minimum of Mo 4 states. The Cooper minimum is obviously enhanced in the =0.2 curve while the two curves are virtually parallel to each other above the minimum. This observation indicates that the Mo 4 contribution to the feature is larger for =0.2 than =0.0, but no significant change in the Fe 3 and O 2 contributions. Namely, the doped electrons are mainly introduced into the Mo 4 states, as inferred by Moritomo et al.MoritomoPRB More recently, Frontera et al. have observed by neutron diffraction that the MoO distance increases with La doping while the FeO one does not change.Frontera In terms of the ionic-radius argument, this implies that the doped electrons will mainly be located at the Mo sites,Frontera in agreement with the above argument. On the other hand, the spectral weight at the feature of =0.2 is also considerably enhanced in the high photon energies despite the fact that the two curves are virtually identical below 120 eV. This is indicating that the feature (Fe bands) also obtains electrons. However, it cannot be a simple consequence of electron doping because the feature is not crossing over owing to the half-metallic DOS.
Such an unusual behavior, the enhancement of both and due to electron doping, has also been reported in the recent photoemission study on polycrystalline samples by Navarro et al.NavarroPES The fact that two independent experiments using different samples with different surface treatments have given the same result apparently demonstrates that this is an intrinsic change of the electronic structure due to electron doping. This is of course not of the rigid-band type, but also incompatible with the behavior of typical electron- or hole-doped 3 transition-metal oxides such as La1-xSrxTiO3 or La1-xSrxMnO3. In these compounds, in-gap states induced by carrier doping always appear between the top of the valence band and the bottom of the conduction band and are crossing .FujimoriLSTO ; MorikawaYCTO ; SaitohMn ; JHPMn
We believe that the above strange behavior can be understood in terms of the strong Hund’s rule coupling in the Fe configuration as follows: the electron configuration in Sr2FeMoO6 is not completely -likenote6 but still has some weight of the configuration in which is the dominant electron configuration in the “original” SrFeO3-like environment for Fe ions.SaitohDP Here, denotes an O 2 ligand hole. Upon electron doping, the electron configuration will be changing from either or configuration to be more like a configuration because the strong Hund’s rule energy stabilization of the configuration prevents the Fe sites from having more than five electrons.SaitohDP As a consequence, the doped electrons will occupy either Mo 4 states or ligand-hole states, resulting in the enhancement of both features (Mo 4 states) and (Fe 3 states).note1 The enhancement in the feature due to electron doping, thus, reflects the strong Hund’s rule energy stabilization in this compound.
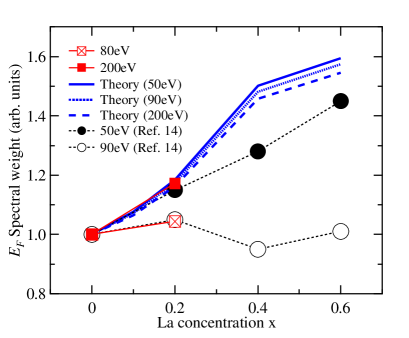
Figure 5 shows a comparison between experimental and theoretical spectral weight plotted as functions of La concentration . The photoionization cross sections are taken into accounted for theoretical curves. The theoretical weight almost linearly increases with . Here, the 50 eV and 200 eV curves predominantly represent both Fe 3 and Mo 4 weight and the 90 eV should represent only the Fe 3 weight.note3 It is noted that all the three theoretical curves have no significant difference although the 90 eV curve would have smaller weight due to the Mo 4 Cooper minimum. This comes from the small Mo 4 DOS due to the high valence of Mo ions. Nevertheless, the experimental weight for 80 eV and 200 eV displays a considerable difference. Here it is worthy to note that our 200 eV and 80 eV curves are almost identical to the 50 eV and 90 eV ones by Navarro et al., respectively.note4 On the other hand, they have reported a linear relationship between the spectral weight and (see Fig. 5).NavarroPES One may consider that it can be an evidence of the DE mechanism in this compound although they carefully mentioned that there were several possibilities. In our measurements, is not enhanced upon electron dopingMoritomoPRB due to the site disorder.MoritomoJJAP2001 It is noted, however, that the observed spectral weight is almost identical to their results. Therefore we infer that the enhancement of the weight in both experiments may not be a direct consequence of the DE mechanism although we also believe that the DE mechanism can basically describe the electronic structure of this compound.SaitohDP
The discrepancy between theory and experiment in the Cooper minimum region possibly indicates that the Mo 4 states have larger near- weight than expected from the band theory. It does not necessarily mean that more Mo 4 electrons nominally exist but the O 2 and Fe 3 states, which strongly hybridize with Mo 4 ones, may be able to contribute to the Mo 4 spectral weight to some extent. This argument can also explain a small (a factor of 1.5) suppression of the intensity at the feature A in an experimental spectrum compared with a band theory simulation shown in Fig. 5 of Ref. SaitohDP, . However, it would be inconsistent with Mössbauer measurements which concluded Fe2.5+.Linden ; Nakamura Hence this discrepancy is an open question at this stage.
On the other hand, both our 200 eV curve and the 50 eV curve by Navarro et al. coincides with the theoretical ones up to =0.2. Because we set all the spectral weights for =0.0 to unity as a reference, this implies , where and denote the experimental and theoretical spectral weight at , respectively. However, this is not a consequence of the rigid-band shift, as we have presented above. Instead, this situation can be realized if a band-narrowing occurs uniformly in the (Fe+Mo) band. We believe that such a band-narrowing is realized since the system is a good metal. In La1-xSrxTiO3+y/2 case, for example, this type of narrowing appears in the Fermi liquid phase whereas a narrowing occurs only in the vicinity of when the system is close to the metal-insulator transition.YoshidaLTO
Based upon the uniform band-narrowing assumption, the ratio of the theoretical chemical potential shift to that of the experiment should rerpresent the mass enhancement from the band mass. In Table 1, two estimations of mass enhancement and are listed. A theoretical electronic specific heat is deduced from the band-theory DOS at [] using the formula . describes a mass enhancement estimated from the band-narrowing. For =0.0, this number is deduced from the location of the feature (theory: eV, experiment: eV)SaitohDP and for =0.2, we make use of the ratio of the chemical potential shift (theory: 112 meV, experiment: 4050 meV) based on the above argument. They give of 2.5 (=0.0) and 2.22.8 (=0.2), in good agreement with the estimation from . Therefore, electron-doping effects on the (Fe+Mo) band can be understood in terms of a conventional electron doping into a renormalized (by a factor of two) band like the La1-xSrxTiO3 case.YoshidaLTO ; TokuraPRL Currently, we have no idea to determine how many electrons will be introduced into the Mo(+Fe) band and the Fe band, respectively, in our scenario of electron doping: + (). However, it is safe to say that the doping effects should appear in the feature more than in the feature because . In this sense, the observed enhancement in the feature is rather smaller than expected. This can be understood again in connection with the small photoionization cross section of the Mo 4 states, if we assume that the electrons doped into the (Fe+Mo) band will mostly occupy the Mo 4 states.
| 0.0 | 0.1 | 0.2 | 0.4 | 0.6 | |
| 111Rigid-band shift is assumed for . | 1.0 | 1.1 | 1.1 | 1.4 | 1.9 |
| 4.0 | 4.2 | 4.4 | 5.6 | 7.5 | |
| 222Taken from Ref. MoritomoPRB, . | 10 | 10 | 12 | ||
| 2.5 | 2.4 | 2.7 | |||
| 2.5 | 2.22.8 |
IV Conclusion
We have investigated the electronic structure of Sr2-xLaxFeMoO6 by photoemission spectroscopy and LDA+ band-structure calculations. A double-peak structure observed at about eV (feature ) and eV (feature ) was identified to be a Fe+Mo band and a Fe band, respectively. The chemical potential shift due to electron doping was observed to be about 4050 meV which was considerably smaller than the prediction of the band theory, 112 meV. Besides, the features and were both enhanced due to electron doping. We have pointed out that this unusual enhancement at the feature is probably indicating a characteristic distribution of doped electrons triggered by the strong Hund’s rule energy stabilization in the 3 configuration. From the observed band-narrowing, we have deduced a mass enhancement of 2.5 with respect to the band theory which is in good agreement with a specific heat measurement.
Acknowledgements.
The authors would like to thank T. Kikuchi for technical support in the experiment. The experimental work has been done under the approval of the Photon Factory Program Advisory Committee (Proposal No. 00G011). This work was supported by a Grant-in-Aid for Scientific Research from the Japanese Ministry of Education, Culture, Sports, Science, and Technology.References
- (1) K.-I. Kobayashi, T. Kimura, H. Sawada, K. Terakura, and Y. Tokura, Nature 395, 677 (1998).
- (2) K.-I. Kobayashi, T. Kimura, Y. Tomioka, H. Sawada, K. Terakura, and Y. Tokura, Phys. Rev. B 59, 11159 (1999).
- (3) F. Galasso, F. C. Douglas, and R. Kasper, J. Chem. Phys. 44, 1672 (1966).
- (4) Y. Moritomo, Sh. Xu, T. Akimoto, A. Machida, N. Hamada, K. Ohoyama, E. Nishibori, M. Takata, and M. Sakata, Phys. Rev. B 62, 14224 (2000).
- (5) Y. Tomioka, T. Okuda, Y. Okimoto, R. Kumai, K.-I. Kobayashi, and Y. Tokura, Phys. Rev. B 61, 422 (2000).
- (6) Z. Fang, K. Terakura, and J. Kanamori, Phys. Rev. B 63, 180407(R) (2001).
- (7) Hua Wu, Phys. Rev. B 64, 125126 (2001).
- (8) J.-S. Kang, H. Han, B. W. Lee, C. G. Olson, S. W. Han, K. H. Kim, J. I. Jeong, J. H. Park, and B. I. Min, Phys. Rev. B 64, 024429 (2001).
- (9) T. Saitoh, M. Nakatake, A. Kakizaki, H. Nakajima, O. Morimoto, Sh. Xu, Y. Moritomo, N. Hamada, Y. Aiura, Phys. Rev. B 66, 035112 (2002).
- (10) B. Martínez, J. Navarro, Ll. Balcells, and J. Fontcuberta, J. Phys.: Condens. Matter 12, 10515 (2000).
- (11) Y. Moritomo, Sh. Xu, A. Machida, T. Akimoto, E. Nishibori, M. Takata, and M. Sakata, Phys. Rev. B 61, R7827 (2000).
- (12) D. D. Sarma, Prya Mahadevan, T. Saha-Dasgupta, Sugata Ray, and Ashwani Kumar, Phys. Rev. Lett. 85, 2549 (2000).
- (13) J. Kanamori and K. Terakura, J. Phys. Soc. Jpn. 70, 1433 (2001).
- (14) J. Navarro, J. Fontcuberta, M. Izquierdo, J. Avila, and M. C. Asensio, Phys. Rev. B 69, 115101 (2004).
- (15) J. Navarro, C. Frontera, Ll. Balcells, B. Martínez, and J. Fontcuberta, Phys. Rev. B 64, 092411 (2001).
- (16) Y. Moritomo, N. Shimamoto, Sh. Xu, A. Machida, E. Nishibori, M. Takata, M. Sakata, and A. Nakamura, Jpn. J. Appl. Phys. 40, L672 (2001).
- (17) J. J. Yeh and I. Lindau, At. Data Nucl. Data Tables 32, 1 (1985).
- (18) For example, S. L. Molodtsov, Yu. Kucherenko, J. J. Hinarejos and S. Danzenbac̈her, V. D. P. Servedio, M. Richter, and C. Laubschat, Phys. Rev. B 60, 16435 (1999).
- (19) The accuracy of the location of A was meV but that of B was much worse due to the broader feature. Thus we have also estimated the shift of the spectra using the steep edge between the features A and B, with accuracy of meV.
- (20) C. Frontera, D. Rubi, J. Navarro, J. L. García-Muñoz, and J. Fontcuberta, and C. Ritter, Phys. Rev. B 68, 012412 (2003).
- (21) A. Fujimori, I. Hase, M. Nakamura, H. Namatame, Y. Fujishima, Y. Tokura, M. Abbate, F. M. F. de Groot, M. T. Czyzyk, J. C. Fuggle, O. Strebel, F. Lopez, M. Domke, and G. Kaindl, Phys. Rev. B 46, R9841 (1992).
- (22) K. Morikawa, T. Mizokawa, A. Fujimori, Y. Taguchi, and Y. Tokura, Phys. Rev. B 54, 8446 (1996).
- (23) T. Saitoh, A. E. Bocquet, T. Mizokawa, H. Namatame, A. Fujimori, M. Abbate, Y. Takeda and M. Takano, Phys. Rev. B 51, 13942 (1995).
- (24) J.-H. Park, C. T. Chen, S-W. Cheong, W. Bao, G. Meigs, V. Chakarian, and Y. U. Idzerda, Phys. Rev. Lett. 76, 4215 (1996).
- (25) We note that the expression is a simplified description. A more realistic expression is [] () because Mössbauer measurements have concluded Fe2.5+ (Ref. Linden, and Nakamura, ). However, this does not mean that the configuration does not exist at all; in terms of the local configuration-interaction description (around the Fe sites), still has a major weight and , , and , etc. have some weight, respectively. (This is one of the reasons why the nominal valences of Fe and Mo are often written as 3+ and 5+ in spite of the Mössbauer measurements .) Thus we have picked up the major configuration for simplicity.
- (26) If we assume that doped electrons may occupy the Fe 3 states, Fe states, namely the feature A, should be enhanced due to electron doping and no enhancement would be observed at the feature B. This consideration further reinforces our argument.
- (27) We note that the 80 eV curve is not shown because it is indistinguishable from the 90 eV curve.
- (28) In our measurements, the spectra are suppressed most at 80 eV while Navarro et al. have adopted 90 eV.
- (29) J. Lindén, T. Yamamoto, M. Karppinen, H. Yamauchi, and T. Pietari, Appl. Phys. Lett. 76, 2925 (2000).
- (30) S. Nakamura K. Ikezaki, N. Nakagawa, Y. J. Shan, and M. Tanaka, Hyperfine Intearctions, 141-142, 207 (2002).
- (31) T. Yoshida, A. Ino, T. Mizokawa, A. Fujimori, Y. Taguchi, T. Katsufuji, and Y. Tokura, Europhys. Lett. 59, 258 (2002).
- (32) Y. Tokura, Y. Taguchi, Y. Okada, Y. Fujishima, T. Arima, K. Kumagai, and Y. Iye, Phys. Rev. Lett. 70, 2126 (1993).