Present address: ] Department of Physics, Stanford University, Stanford, California 94305
From random walk to single-file diffusion
Abstract
We report an experimental study of diffusion in a quasi-one-dimensional (q1D) colloid suspension which behaves like a Tonks gas. The mean squared displacement as a function of time is described well with an ansatz encompassing a time regime that is both shorter and longer than the mean time between collisions. This ansatz asserts that the inverse mean squared displacement is the sum of the inverse mean squared displacement for short time normal diffusion (random walk) and the inverse mean squared displacement for asymptotic single-file diffusion (SFD) ( where is the q1D self-diffusion coefficient and is the single-file 1D mobility). The dependence of on the concentration of the colloids agrees quantitatively with that derived for a hard rod model, which confirms for the first time the validity of the hard rod SFD theory. We also show that a recent SFD theory by Kollmann 970 leads to the hard rod SFD theory for a Tonks gas.
pacs:
83.50.Ha, 82.70.Dd, 83.80.HjThe diffusion of particles in quasi-one-dimensional (q1D) pores and channels is a basic feature of ion transport in cell membranes, molecular motion in zeolites, and particle flows in microfluidic devices (see references in 879 ). The unique feature that separates q1D diffusion from diffusion in higher dimensions is the geometric confinement that forces the particles into a single file with a fixed spatial sequence. This confinement generates a self-diffusion mechanism that has different time dependences of the mean squared particle displacement in different time domains.
For time intervals shorter than the time between particle collisions, in the presence of a randomizing background fluid (e.g. a colloid particle in a solvent), the probability density for the particle displacement is
| (1) |
where is the displacement during time interval , and is the q1D self-diffusion coefficient. However, the fixed spatial sequence of the particles severely restricts the possibility for large single particle displacements and, therefore, drastically reduces the diffusion rate at long time. An analytic description of 1D diffusion in a system of hard rods with stochastic background forces was first reported by Harris 978 . Several other 1D systems have been examined with a similar approach 880 ; 882 ; 881 ; 883 ; 856 ; 857 ; 854 ; the results obtained converge to the same solution. For an infinite 1D system the long time behavior of the probability density for displacement is
| (2) |
where is a 1D mobility defined by
| (3) |
We denote the 1D mobility of the hard rods by . In Eq.(3) is the particle length, is the 1D number density, is the mean spacing between the particles, and is the mean time between collisions in the system. Equations (2) and (3) draw a remarkably simple picture of 1D diffusion at long time: the self-diffusion process, determined by the width of the probability density, is proportional to (i.e. ) , and the proportionality constant is determined by the short time individual particle dynamics.
Recently Kollmann reported an analysis of the long time behavior of 1D diffusion that is valid both for atomic and colloid systems 970 . For colloid systems he finds the asymptotic particle density function displayed in Eq.(2) with the 1D mobility, denoted by ,
| (4) |
where , , are the momentum transfer, static structure factor, and the short time collective-diffusion coefficient in -space, respectively. The small , small approximation for the dynamic structure factor, 907 , yields the relation
| (5) |
Kollmann’s analysis predicts that the long time character of 1D diffusion is determined by the short time collective dynamics of the system.
Although theoretical analyses of 1D diffusion have been reported for the past four decades, the first experimental studies were reported only in the past decade. Studies of molecular diffusion in zeolites, and of colloid particles confined in a channel lead to the result at long time 879 ; 868 ; 946 . Very recently, Lutz, Kollmann and Bechinger 979 reported the results of an experimental study of single-file diffusion in a strongly interacting colloid suspension. The 1D mobility, determined from at long time, agrees with that determined from Eq.(4) at short time, as predicted 970 . However, the 1D mobility they find is only qualitatively similar to .
The main difficulty encountered in the study of single-file diffusion is to obtain data at long time; this difficulty is most pronounced for low concentration samples. To obtain the required data one needs a long-lived experimental system and stable instruments, such as those cleverly devised for the studies reported in references 879 and 979 .
In this Letter, we report an experimental study of q1D diffusion in a weakly interacting colloid suspension confined in a narrow straight groove. We establish an ansatz that accurately approximates the q1D diffusion process from the short time region to the long time region, thereby allowing us to study the long time single-file diffusion within a reasonable time frame (requiring a sample lifetime of 1 hour), as well as diffusion in the cross-over time region. The experimentally determined q1D mobility of the system agrees quantitatively with .
We note that Kollmann states that is not equivalent to , and the experimental results in 979 support this statement. However, we show that these two theories are equivalent when applied to a system, such as ours, which obeys the Tonks equation of state 982 .
Our experimental system consists of silica colloid spheres (density ) suspended in water and confined in straight and narrow grooves. The grooves are printed on a polydimethysiloxane substrate from a master pattern fabricated lithographically on a Si wafer (Stanford Nanofabrication Facility). The small width of the groove () prevents the spheres from passing one other, and gravity keeps them from escaping the groove. The spheres are very weakly attractive (); the short-range attraction is derived from surface tension effects 941 . Digital video microscopy is used to directly track the time-dependent trajectories of the spheres along the groove (the motion transverse to the groove is very limited and, therefore, is not considered here). Details relevant to sample preparation and data analysis have been described elsewhere 946 ; 941 .
We have studied q1D diffusion at various colloid concentrations, characterized by a line packing fraction , where is the length of the groove in the field of view, and the number of spheres within . We used two different silica colloid suspensions. For =0.09, 0.17, 0.20, 0.38, 0.57, and 0.70 the samples had silica spheres with diameter in a groove that was wide and deep, and long. For =0.73 and 0.986 we used silica spheres with diameter in a groove that was wide, deep, and long. Care has been taken to assure that there were no blockages in the grooves. We used the large spheres for the higher concentration samples because the small spheres could not be contained inside the grooves when .
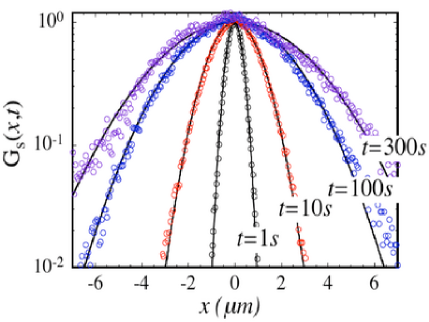
The self-diffusion process is usually described by the self-part of the van Hove function, , which is the probability density for finding a particle at a point at time given that it was at at (743 ). Figure 1 shows a typical for our system, derived from time-dependent trajectories. The deviation of from a Gaussian, characterized by , is found to be negligible (). We therefore assume to have the Gaussian form
| (6) |
Figure 1 also shows the Gaussian fits to . The mean squared displacement determined from the fitting is sensibly the same as that determined from .
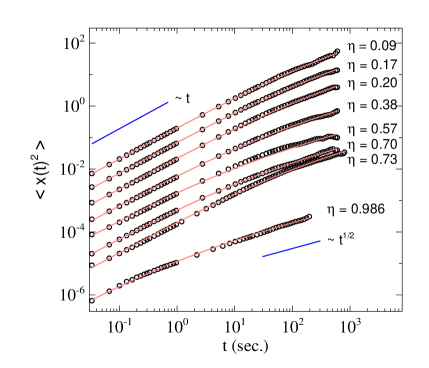
Figure 2 shows as a function of at various concentrations, extracted from fitting to Eq.(6). Qualitatively, is proportional to at short time, changes smoothly to (1) at later time, and reaches at long time for the higher concentrations. Because of the expected trend in the behavior of as a function of , it is reasonable to postulate that with long enough time the low concentration samples will also exhibit . Accordingly, we use the following ansatz to describe over the entire time range:
| (7) |
Equation (7) leads to
| (8) |
By construction, Eq. (8) satisfies both the short and long time limits, and it provides a characteristic cross-over time, . If , then (see Eq.(3)), so that for hard rods is, essentially, the mean time between collisions. The fits of to Eq.(8) shown in Fig.2 indicate that Eq.(8) is a reasonable approximation for all time, and the fitting yields three pertinent parameters describing the q1D diffusion: the short time self-diffusion coefficient, , the long time q1D mobility, , and the cross-over time, .
When the fitted values for are and , respectively, for the small and large spheres (the lower concentration data for large spheres are not shown here). These values are, within the experimental precision, the same as those calculated for isolated colloids confined by the three walls of the groove 946 and, therefore, are used to determine in Eq.(3) and in Eq.(8). At higher concentrations the fitted self-diffusion coefficient is slightly smaller (, suggesting that hydrodynamic interaction between colloid particles comes into play even at the shortest time accessible in our experiment 946 ; 948 .
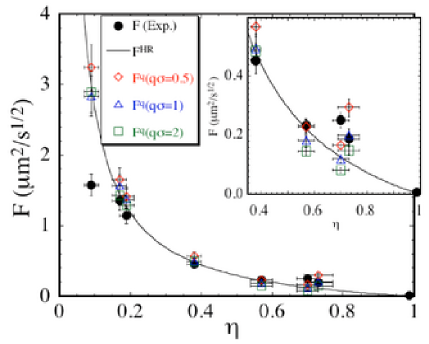
Figure 3 shows the fitted as a function of . When , within the experimental precision. However, when and when . Using the fitted and we find for , correspondingly, to be compared with , respectively (note for large spheres and are scaled by a factor ). For we can force by replacing the colloid diameter in with a larger effective diameter. We speculate that at higher concentration the colloid-colloid interaction, though weak, must be accounted for. Since the first peak of the pair correlation function is at a separation slightly larger than the sphere diameter 941 , the effective sphere diameter is thereby increased.
The accuracy of the fitted and depends on the range of relative to . If the range of extends both to and we can extract and accurately from Eq.(8); if not the values obtained are less accurate, as shown by the discrepancies between the fitted and for , and the fitted and expected at higher .
We now show that, as is to be expected, for a q1D system that is described by Tonks equation of state ( is the linear force) 982 . The relative isothermal compressibility of a Tonks gas is
| (9) |
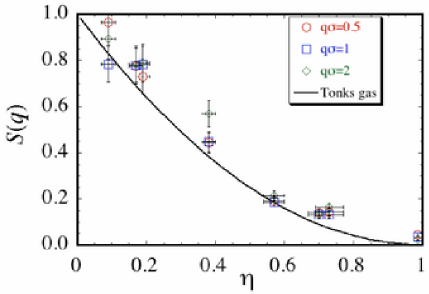
where for 1D, and . Figure 4 shows for our system for small () as a function of ; the agreement with Eq.(9) clearly indicates that our system behaves like a Tonks gas. The slight shift of experimental values of to larger from that of a Tonks gas is consistent with the weak colloid-colloid attraction 886 .
Kollmann’s theory relates to the collective diffusion coefficient, , and the relative isothermal compressibility, . Substituting given in Eq.(9) and 907 ( is the hydrodynamic factor) into Eq.(4), we obtain , if , i.e. if hydrodynamic interaction is negligible.
We have calculated as follows. First, was determined from the trajectories using , where . Then was fitted to the short time approximation (Eq.(5)) to extract at small (). Within the short time range , is well described by Eq.(5) except for the case . Finally, was calculated using Eq.(4) for all the concentrations except . As shown in Fig.3, agrees with within the experimental precision. The data in Fig.3 also show that depends on , which we attribute to hydrodynamic interaction in the system. In a q1D system hydrodynamic interaction is screened on the length scale of the channel width, so it can be treated as generating a pair-interaction 948 . Then the effect of on is not significant. A full discussion of in the q1D system will be published separately.
It is worth noting that in Eq.(8) is the width of a Gaussian which is the product of the short time probability density (Eq.(1)) and the long time probability density (Eq.(2)). The success of the approximation given in Eq.(8) suggests that the van Hove function displayed in Eq.(6) is valid for all time for our system. It is further implied that the randomizing background that determines the short time behavior and the correlated motion that determines the long time single-file diffusion are coexisting independent processes with time dependent weights. For and the system exhibits normal diffusion and single-file diffusion, respectively. However, for , the motion of a particle in 1D is hindered by its neighbors and the short time displacement distribution is modified by the long time distribution.
We thank Tom Witten and Sidney Nagel for helpful discussions. This research was supported by the NSF (CTS-021174 and CHE-9977841), the Israel Science Foundation (77/03), and the NSF-funded MRSEC laboratory at The University of Chicago.
References
- (1) M. Kollmann, Phys. Rev. Lett. 90, 180602 (2003).
- (2) Q.-W. Wei, C. Bechinger, and P. Leiderer, Science 287, 625 (2000).
- (3) T. E. Harris, J. Appl. Prob. 2, 323 (1965).
- (4) D. G. Levitt, Phys. Rev. A 8, 3050 (1973).
- (5) S. Alexander and P. Pincus, Phys. Rev. B 18, 2011 (1978).
- (6) P. M. Richards, Phys. Rev. B 16, 1393 (1977).
- (7) P. A. Fedders, Phys. Rev. B 17, 40 (1978).
- (8) J. Karger, Phys. Rev. A 45, 4173 (1992).
- (9) J. Karger, Phys. Rev. E 47, 1427 (1993).
- (10) K. Hahn and J. Karger, J. Phys. A: Math. Gen. 28, 3061 (1995).
- (11) P. Pusey, in Liquids, freezing, and glass transition, J. Hansen, D. Levesque, and J. Zinn-Justin (eds.) (North-Holland, Amsterdam, 1989), p. 763.
- (12) K. Hahn, J. Karger, and V. Kukla, Phys. Rev. Lett. 76, 2762 (1996).
- (13) B. Lin, B. Cui, J.-H. Lee, and J. Yu, Europhys. Lett. 57, 724 (2002).
- (14) C. Lutz, M. Kollmann, and C. Bechinger, Phys. Rev. Lett. 93, 026001 (2004).
- (15) B. Cui, B. Lin, and S. A. Rice, J. Chem. Phys. 116, 3119 (2002).
- (16) J.-P. Hansen and I. R. McDonald, Theory of Simple Liquids, 2nd ed. (Elsevier Academic Press, London, 1986).
- (17) B. Cui, H. Diamant, and B. Lin, Phys. Rev. Lett. 89, 188302 (2002).
- (18) L. Tonks, Phys. Rev. 50, 955 (1936).
- (19) S.-K. Ma, Statistical Mechanics (World Science, Singapore, 1985).