Laboratoire de Physique Théorique (UMR 8627 du CNRS), Bâtiment 210, Université de Paris-Sud, 91405 Orsay Cedex, France
Granular systems Pattern formation
Towards a continuum theory of clustering in a freely cooling inelastic gas
Abstract
We performed molecular dynamics simulations to investigate the clustering instability of a freely cooling dilute gas of inelastically colliding disks in a quasi-one-dimensional setting. We observe that, as the gas cools, the shear stress becomes negligibly small, and the gas flows by inertia only. Finite-time singularities, intrinsic in such a flow, are arrested only when close-packed clusters are formed. We observe that the late-time dynamics of this system are describable by the Burgers equation with vanishing viscosity, and predict the long-time coarsening behavior.
pacs:
45.70.-npacs:
45.70.Qj1 Introduction
A gas of hard spheres is a standard model of statistical physics and kinetic theory [1]. It is surprising that a minor change in this model - the introduction of energy loss in the binary collisions - leads to consequences so dramatic. Among the many fascinating properties of the gas of inelastically colliding hard spheres [2], the clustering instability [3, 4] plays a special role. No matter how small (but finite) is the inelasticity of collisions, the homogeneous cooling state (HCS) of this gas is always unstable if the system size is large enough. When studying macroscopic properties of matter, a physicist deals, first of all, with the thermodynamic limit . From this perspective the gas of elastically colliding hard spheres is a singular limit of the inelastic gas problem. The practical importance of the inelastic gas model stems from its being the simplest model of granular flow [2, 5, 6].
The clustering instability of a freely cooling inelastic gas involves formation of clusters of particles and generation of vortices [3, 4, 7]. The basic physics of the initial stage of cluster formation is simple: the inelastic cooling of the gas causes a pressure drop in the regions of enhanced density. This pressure drop drives an inflow of gas from the periphery and therefore provides a positive feedback to the instability. A traditional framework for quantitative theory here is granular hydrodynamics (GH), which assumes scale separation and is derivable from the Boltzmann equation, properly modified to account for the inelasticity of collisions [2]. Though the general criteria of its validity remain controversial [8], GH is well established at least when the following two criteria are met: (i) the granular gas is dilute, , and (ii) the particle collisions are nearly elastic, . Here is the local number density of the gas, is the particle diameter, is the dimension of space, is the inelasticity of collisions, and is the coefficient of normal restitution (assumed constant throughout this paper). In this case the GH equations, linearized around the HCS, provide an accurate theory of the initial stage of the instability in terms of the (linear) hydrodynamic modes of the system: the shear mode (spontaneous formation of vortices) and the entropy, or clustering mode (formation of clusters) [3, 4, 7].
The further evolution of the instability is a hard problem. One difficulty here is technical, as the growing nonlinear shear and clustering modes become strongly coupled. Another difficulty is conceptual: GH breaks down in high-density regions. All previous attempts to develop a theory beyond linearization of the GH equations attempted to circumvent these difficulties. Ben-Naim et al. [9] considered point-like particles inelastically colliding on a line. This strictly one-dimensional (1D) geometry makes a GH description problematic [8]. Still, Ben-Naim et al. observed that, at long times, the 1D system is describable by the Burgers equation with vanishing viscosity. Ernst et al. [10] considered a small two-dimensional (2D) system, where the entropy mode is suppressed, and dealt with the unstable shear mode. Baldassarri et al. [11] also studied instability of the velocity field in a homogeneous gas, by introducing a lattice model.
Focusing on the entropy, or clustering, mode, Efrati et al. [12] had the shear mode suppressed, by working with a quasi-1D setting, see below. They solved numerically the low-density GH equations and found that, as the unstable system cools down, the shear stress becomes negligibly small, and a flow by inertia sets in. Formally, this flow develops a finite-time singularity: the velocity gradient and the gas density diverge at some location. Efrati et al. argued that the flow by inertia is an important intermediate stage of the clustering instability. However, they did not address still later stages of the instability, when finite-density effects come into play. We report here the first MD simulations which probe the quasi-1D clustering of a dilute inelastic gas. We find that the simulated low-density stage of the clustering instability is in excellent agreement with the hydrodynamic predictions of Ref. [12]. What happens at later times? We observe that the attempted singularities are arrested only when hexagonally packed clusters are formed. The still later dynamics are describable by the Burgers equation with vanishing viscosity, in a striking analogy with the purely 1D result by Ben-Naim et al. [9]. Based on this observation, we predict the very-late-time coarsening dynamics of the system, all the way to its simple final steady state.
2 Model system and clustering instability
Consider an assembly of identical hard disks of mass , diameter , and inelasticity in a 2D box with dimensions and (). The initial number density of the gas is very small compared to the hexagonal close packing density . The initial particle velocity distribution is gaussian with temperature . The parameters are chosen so that the low-density GH equations [5] are accurate until relatively late times, when the local value of is not a small parameter anymore. The boundary conditions are periodic at and and elastic (specular reflection) at and . Assuming a homogeneous cooling, one arrives at Haff’s law [5] , where is the characteristic cooling time. The GH equations, linearized around the HCS, show that the HCS is unstable if and/or are large enough [3, 4, 7]. The density perturbations grow in time algebraically. The temperature and velocity perturbations decay, but the decay rates are smaller than that described by Haff’s law. As a result, the flow tends to become supersonic [7]. A strong quasi-1D instability requires two criteria: , and ; the latter one guarantees suppression of the shear and clustering modes in the -direction [3, 4, 7, 12].
3 Flow by inertia
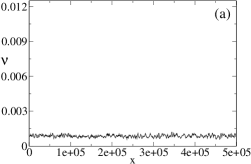
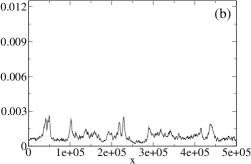
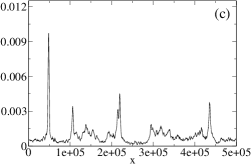
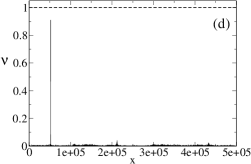
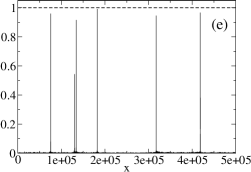
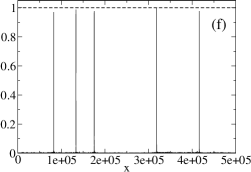
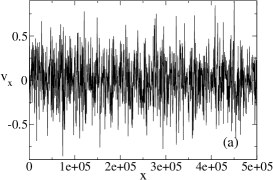
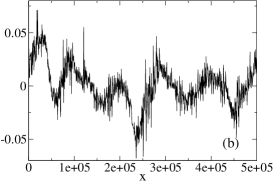
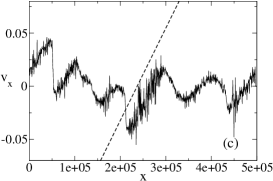
We performed extensive event-driven MD simulations in this regime of parameters. We verified that no structure in the -direction appears, as expected. Therefore, our diagnostics focused on 1D coarse-grained fields: the density , the mean velocity and the - and - components of the velocity fluctuations: and . We report here a typical simulation with , , and . The initial gas density is , while . Strong clustering instability is clearly seen in Fig. 1, which exhibits formation of multiple clusters, and Fig. 2, which shows an inflow of gas into the forming clusters. Meanwhile, the gas temperature (not shown) rapidly decays with time. Throughout the simulated dynamics and remain close to each other, while their spatial inhomogeneity is small compared to the strong inhomogeneity of and .
The average particle energy versus time, , follows Haff’s law at early times, but deviates from it at later times, when strong hydrodynamic motions develop, see Fig. 3 (left). In the hydrodynamic description , where is the thermal energy density, and is the macroscopic kinetic energy density. The role of each term is elucidated in Fig. 3. Both , and initially decay; decays faster. At later times and the -component of continue to decay rapidly, while the -component of decays much slower. As a result, is dominated by at early times and by the -component of at later times. Remarkably, continues to follow Haff’s law quite closely until the latest simulated times.
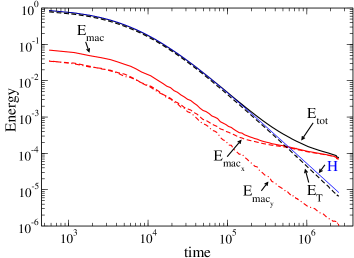
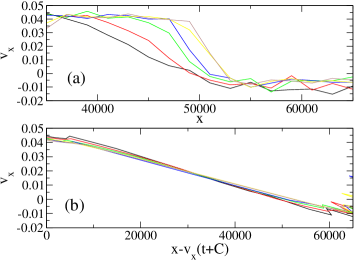
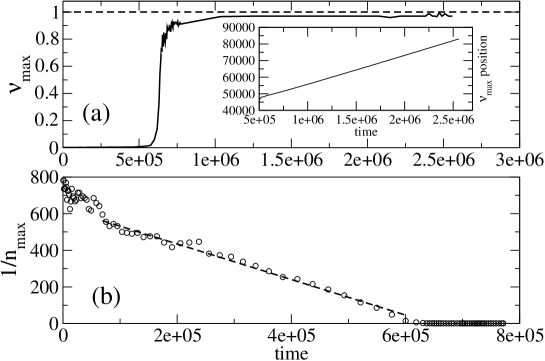
Figure 4a shows the time history of a typical cluster (the leftmost density peak in Fig. 1 c-f). The rapid density growth is saturated when approaches . A snapshot of the density peak region (Fig. 5) indeed shows almost perfect hexagonal packing. The rapid density growth is shown in more detail in Fig. 4b which depicts versus time. The linear dependence, observed at intermediate times, indicates an “attempted” finite-time singularity . The same density singularity was observed in hydrodynamic simulations [12]; it is caused by a flow by inertia which develops when the forces acting on a fluid element vanish. The reason for it in the freely evolving inelastic gas is the continued rapid cooling, which makes the pressure and viscous stresses negligible [12]. The flow-by-inertia equations read
| (1) |
These equations are soluble analytically in Lagrangian coordinates [13, 14]:
| (2) |
where is an arbitrary constant, , while and are the and , respectively, at the “initial” moment of time . The relation between Eulerian coordinate and Lagrangian coordinate is . The finite-time singularities of both the velocity gradient, and the density occur when the denominator in Eq. (2) b vanishes for the first time; it requires .
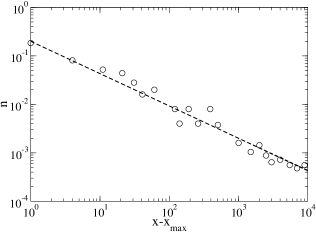
The results of our MD simulations quantitatively agree with the flow-by-inertia scenario. Using in Eq. (2b) the straight-line fit, shown in Fig. 4b, we obtain and , where is Lagrangian coordinate of the density peak. Now we verify Eq. (2) by observing [see Fig. 3 (right)] collapse of versus , at different times, in the region of the leftmost density peak. The slope of the obtained straight line yields an independent estimate of which agrees within 3 percent with the value of found earlier. Still another prediction deals with the shape of the density peak close to the time of attempted singularity. The flow-by-inertia theory predicts a density profile [14]. The simulations confirm this prediction, see Fig. 5 (right).

As we observed, the density growth in the clusters is suppressed only when the density approaches . At a fixed temperature, the pressure of an assembly of nearly elastic hard spheres diverges like as approaches . Is there a pressure “revival” at ? We used the empiric relation , which interpolates between the dilute limit and the close-packing limit [15], to calculate the pressure field . We found that, though approaches , continues to decay with time, apparently because of the very rapid temperature decay. Therefore, the pressure revival mechanism can be ruled out.
4 The Burgers model
As the system approaches close packing it gets jammed. Faster particles cannot overrun slower ones, and the singular growth of the velocity gradient and density is arrested. A natural continuum model for a jammed flow is the Burgers equation [13]
| (3) |
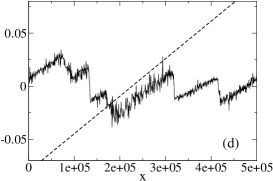
in the limit of vanishing viscosity , together with the continuity equation (1)b. We shall call this model “the Burgers model”. Equation (3) is soluble exactly by the Hopf-Cole transformation [16, 17]. The zero-viscosity limit of the solution, which is the subject of our interest, has the following properties. The solution is identical to that predicted by the flow-by-inertia model until the time moment when the flow by inertia would have developed a singularity. The attempted singularity gives way, in the Burgers model, to a “shock”: a jump in the velocity field which carries a density peak (cluster). In this coarse-grained description, the close-packed clusters have zero sizes but finite masses. At long times, when the shocks have “matured” [17], the quantitative predictions of the Burgers model are especially simple and can be conveniently tested in our MD simulations. One prediction is that is equal to everywhere between the shocks, where is the same constant ( in the reported simulation) as above. This prediction is tested in Fig. 2c and d. While the agreement in Fig. c is only fair (as the shocks have not yet matured), it improves considerably in Fig. d. Another prediction that we verified (see the inset of Fig. 4a) is that each shock moves with a constant speed until it collides with another shock. Furthermore, a collision between two shocks leads to their merger, without any thermalization of the system. Such a merger event can be seen in the left part of Figs. 1 e and f. Finally, we verified that the zeros of , belonging to the “ramps”, stay at rest as expected [17].
5 Late-time coarsening dynamics
Event-driven MD simulations become very slow once the hexagonal close packing in the clusters is achieved. Fortunately, the times reached in our simulations were large enough to have verified the Burgers model as a proper late-time continuum model of the quasi-1D clustering process. Therefore, we can give a detailed prediction of the still later coarsening dynamics of the system, without a need to simulate it. If the number of clusters is large, the coarsening dynamics, which proceed via cluster mergers, can be addressed statistically. At this level of description the problem coincides with that of the decaying Burgers turbulence [16, 17], or the ballistic agglomeration model [18]. For uncorrelated initial conditions, the average cluster mass grows with time like , the average velocity decreases like , and the average distance between two neighboring clusters grows like [18]. This yields a long-time asymptotic scaling law . At this stage, is dominated by the kinetic energy of the clusters. The energy decay stops when an ultimate steady state of the system is reached: a single “super-cluster”, moving with a small constant speed (which can be determined from the initial data, by employing the momentum conservation in the -direction and assuming that all particles are absorbed by this super-cluster).
6 Summary and Discussion
Our MD simulations fully support the hydrodynamic flow-by-inertia scenario [12]. The attempted singularities of this flow are suppressed when almost perfect hexagonally packed clusters are formed. At still later times the dynamics are describable by the Burgers equation with vanishing viscosity, in a striking analogy with the purely 1D results by Ben-Naim et al. [9]. Therefore, clustering instability in a quasi-1D setting is now well understood. What about a fully multi-dimensional geometry? It has been conjectured that, prior to the first attempted singularity, the system should be describable by a multi-dimensional flow-by-inertia model [12]. One can expect that an interplay between vorticity, produced during the early stage of the instability, and jamming provides a saturation mechanism for the multi-dimensional singularities. Unfortunately, the multi-dimensional Burgers model [16, 17] assumes a potential velocity field and misses the important physics, caused by the presence of vorticity. The formulation of a continuum model free of this flaw should be the next step of theory.
Acknowledgements.
We thank Efi Efrati for a useful discussion. The work was supported by grants from the Israel Science Foundation and German-Israeli Foundation for Scientific Research & Development, and by the Marie Curie grant No. MEIF-CT-2003-500944.References
- [1] \NameLandau L.D. Lifshitz E.M. \BookStatistical Physics, Part 1 \PublPergamon, Oxford \Year1980; \NameLifshitz E.M. Pitaevskii L.P. \BookPhysical Kinetics \PublPergamon, Oxford \Year1981.
- [2] \BookGranular Gases\EditorPöschel T. Luding S. \PublSpringer, Berlin \Year2001; \BookGranular Gas Dynamics \EditorPöschel T. Brilliantov N. \PublSpringer, Berlin \Year2003; \NameGoldhirsch I. \REVIEWAnnu. Rev. Fluid Mech. 35 2003 267.
- [3] \NameGoldhirsch I. Zanetti G. \REVIEWPhys. Rev. Lett. 70 1993 1619.
- [4] \NameMcNamara S. \REVIEWPhys. Fluids A 5 3056; \NameMcNamara S. Young W. R. \REVIEWPhys. Rev. E 53 1996 5089.
- [5] \NameHaff P.K. \REVIEWJ. Fluid Mech. 134 1983 401.
- [6] \NameCampbell C.S. \REVIEWAnnu. Rev. Fluid Mech. 22 1990 57.
- [7] \NameDeltour P. Barrat J.-L. \REVIEWJ. Phys I France 7 1997 137.
- [8] \NameKadanoff L.P. \REVIEWRev. Mod. Phys. 71 1999 435.
- [9] \NameBen-Naim E., Chen S.Y., Doolen G.D. Redner S. \REVIEWPhys. Rev. Lett. 83 1999 4069.
- [10] \NameWakou J., Brito R., Ernst M.H. \REVIEWJ. Stat. Phys. 107 2002 3.
- [11] \NameBaldassarri A., Bettolo U., Puglisi A. \REVIEWEurophys. Lett. 58 2002 14; \REVIEWPhys. Rev. E 65 2002 051301.
- [12] \NameEfrati E., Livne E., Meerson B. \REVIEWPhys. Rev. Lett 94 2005 088001.
- [13] \NameWhitham G.B. \BookLinear and Nonlinear Waves \PublWiley, New York \Year1974.
- [14] \NameShandarin S.F. Zeldovich Ya. B. \REVIEWRev. Mod. Phys. 61 1989 185.
- [15] \NameGrossman E. L., Zhou T., Ben-Naim E. \REVIEWPhys. Rev. E 55 1997 4200.
- [16] \NameBurgers J.M. \BookThe Nonlinear Diffusion Equation \PublReidel, Dordrecht \Year1974.
- [17] \NameGurbatov S.N., Malakhov A.N., Saichev A.I. \BookNonlinear Random Waves and Turbulence in Nondispersive Media\PublManchester University Press, Manchester \Year1991.
- [18] \NameCarnevale G.F., Pomeau Y. Young W.R. \REVIEWPhys. Rev. Lett. 64 1990 2913.