Goldstone-Mode Phonon Dynamics in the Pyrochlore Cd2Re2O7
Abstract
We have measured the polarized Raman scattering spectra of Cd2Re2O7, the first superconducting pyrochlore, as a function of temperature. For temperatures below the cubic-to-tetragonal structural phase transition (SPT) at 200K, a peak with B1 symmetry develops at zero frequency with divergent intensity. We identify this peak as the first observation of the Goldstone phonon in a crystalline solid. The Goldstone phonon is a collective excitation that exists due to the breaking of the continuous symmetry with the SPT. Its emergence coincides with that of a Raman-active soft mode. The order parameter for both features derives from an unstable doubly-degenerate vibration (with Eu symmetry) of the O1 atoms which drives the SPT.
pacs:
05.70.Fh, 63.20.-e, 63.20.Dj, 78.30.-jThe Goldstone theorem, originally formulated in particle physics, states that there exists a massless particle if a continuous symmetry is spontaneously broken Goldstone62 ; Ryder96 . In the condensed state of matter, the massless particle corresponds to a collective excitation with wave vector and frequency . One simple example in which Goldstone modes are found is the Heisenberg model, the Hamiltonian of which is invariant under simultaneous rotation of all spins in the lattice. Indeed, experimentally Goldstone-like magnons have been found in a number of magnetic systems undergoing both finite temperature and quantum phase transitions Ruegg04 . Goldstone vibrational modes are expected in ferroelectric liquid crystals due to the isotropy of the high-symmetry parent phase Chandra92 . In contrast, such a behavior is not expected in crystalline solids because the nonlinear contributions to the lattice vibrational Hamiltonian are usually highly anisotropic for degenerate phonons Acoustic .
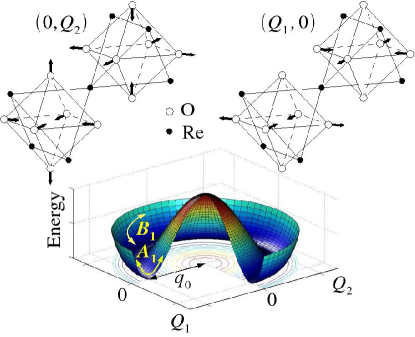
In this Letter, we report polarized Raman investigations of the superconducting oxide Cd2Re2O7 Hanawa01 ; Sakai01 ; Jin01 , which shows evidence of Goldstone phonon mode behavior. To the best of our knowledge, this is the first observation of a Goldstone optical phonon mode in a crystalline solid. Cd2Re2O7, a cubic pyrochlore (space group ) at room temperature, exhibits two structural phase transitions (SPT) at the temperatures of 200 K and 120 K Castellan02 ; Yamaura02 ; Arai02 . The corresponding low temperature space groups are and , both tetragonal and non-centrosymmetric. The order parameter corresponds to a Brillouin zone centered () doubly degenerate phonon of symmetry dominated by the displacements of oxygen atoms occupying position 48(f) of space group Sergienko03 ; Sergienko04 . These atoms, which comprise 6 of the 7 oxygen per formula unit, are collectively referred to as the O1 atoms to distinguish them from the O2 atom at the 8(a) site. The displacements of the O1 oxygen atoms corresponding to the soft mode are shown in Fig 1. The Cd and O2 atoms are not shown.
The effective Hamiltonian for the soft mode is
| (1) |
where are the symmetric coordinates, are the corresponding momenta and is the effective mass. The coefficients and are in general temperature dependent due to the coupling to all the other phonon modes of the crystal. A crucial feature of is the absence of anisotropic terms in the third-order or fourth-order part of the potential energy. We note that this is not an assumption but an exact result of the symmetry analysis Sergienko03 . The first anisotropic contribution is of the form . This term is important in lifting the degeneracy between the tetragonal phases. However, it is not expected to be significant for the dynamical properties at least close to the second-order phase transition at 200 K. The smallness of is supported by the fact that the observation of the 120 K SPT is sample dependent and is related to crystal imperfections Lu05 as well as by first-principles calculations Sergienko04 . Consequently, is invariant with respect to arbitrary “rotations” in the order parameter space , as depicted in Fig. 1. When the cubic symmetry is broken at 200 K, this continuous symmetry leads to the existence of a Goldstone mode with vanishing frequency and excitation energy.
The soft mode is Raman inactive in the room temperature centrosymmetric pyrochlore structure. Below 200 K, it transforms into and modes, both of which can be observed in Raman scattering. The integrated Raman intensities of these modes are given by , where is the non-vanishing component of the order parameter at equilibrium and is the mode frequency Fleury72 ; Cummins83 . The mode represents the ordinary massive oscillations of the amplitude of the order parameter with frequency leading to a finite value of . Conversely, the Goldstone mode () should give a zero-frequency peak of divergent intensity. The experimental results presented below are in good agreement with this preliminary consideration.
Polarized Raman scattering was measured on surfaces cut and polished along crystal axes. The identical crystal was measured using resonance ultrasound spectroscopy Sergienko04 , and Raman results were confirmed on a second crystal. Smooth surfaces reduced the scattered light and allowed for intrinsic intensity measurements very close to the laser line. Consistency between 514.5 nm and 676.4 nm laser excitations confirm the Raman nature of the observed peaks. The experimental resolution was 1 cm-1 (676.4 nm) and 3 cm-1 (514.5 nm). The focal area was 50m X 500m, and the laser power was kept low (40 W/cm2) to reduce local heating. Collected photons were dispersed using a Dilor XY500 triple grating spectrometer in subtractive mode (to reduce the stray light) and collected using a LN-cooled CCD.
By selecting the polarization of incident and scattered photons along certain crystallographic directions, phonons can be identified by symmetry. For the cubic pyrochlore at room temperature, XX polarization (where the first letter indicates the incident and the second the collected vector) measures the channels. The corresponding components of the polarizability tensor are for and and for . XY polarization (incident and collected photons polarized along orthogonal crystal axes) selects the symmetry (, , ). X′Y′ polarization (polarized along orthogonal axes 45o rotated from the crystal axes) selects the symmetry. Therefore, and species are accessed directly while is derived from XX-X′Y′. In the tetragonal phases, XX selects channels, XY selects and X′Y′ measures the symmetry. is derived from XX-X′Y′ for this case.
Below 200 K, tetragonal domains form within the crystal, thereby mixing the X, Y and Z axes. Although no reliable data on the domain size have been reported thus far, the domains are estimated to be of the order of 0.1-10 m Dodge , which is smaller than the focal area used in this work. The presence of these tetragonal domains therefore mixes YY and ZZ polarizations into the nominally and spectra. This mixing, however, does not affect , which is invariant under the permutations of , and . Therefore, it is expected that the data derived from XX-X′Y′ only corresponds to , whereas the X′Y′ data contains both and below 200 K. For the same reason, ZX and ZY polarizations corresponding to Raman scattering by phonons of symmetry are seen in the nominally data (not reported here). The selection rules are also compromised by possible slight deviations of the polished planes from the crystal axes. However, strong symmetry dependence is still observed and we can identify mode species by observing the polarization in which the intensity dominates.
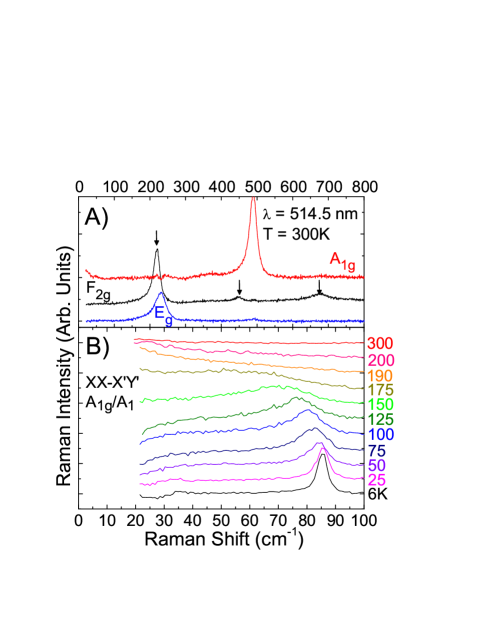
Raman spectra were measured between our lowest Rayleigh-free frequency (6 cm-1 for crossed polarizations XY and X′Y′ - 20 cm-1 for parallel polarizations XX and X′X′) and 800 cm-1 for the temperatures from 300 K down to 5 K. The symmetry analysis of the Raman active modes in the pyrochlore structure gives one , one and four modes Sergienko03 . This is in good agreement with the room temperature data presented in Fig. 2(A). Only one of the modes is either too weak or almost degenerate and cannot be resolved. Below 200 K and 120 K, a large number of new Raman peaks are observed which is consistent with the symmetry lowering from centrosymmetric cubic to non-centrosymmetric tetragonal. A detailed report of the high-frequency region of the spectra will be the subject of a subsequent publication. For the remainder of this manuscript we concentrate on the symmetry dependent Raman spectra measured at frequencies below 100 cm-1.
In Fig. 2(B) the low frequency temperature dependence clearly shows the development of the soft mode (the component of ). It remains overdamped in a small temperature interval below 200 K but clearly becomes stiffer as the temperature is lowered to 150 K. We therefore associate this soft mode with the cubic-tetragonal SPT. We note that “parallel” experimental polarizations, such as XX, generally have strong diffuse scattering which can lead to extrinsic low frequency intensity. Because we do not observe this down to very low frequencies and because such scattering is temperature independent, we conclude that the sample is sufficiently smooth to allow for the resolution of the Goldstone mode.
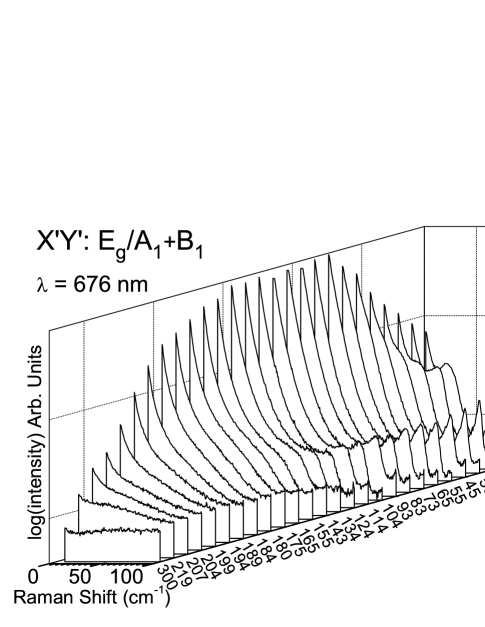
The log10 of the low frequency temperature dependent X′Y′ (/) Raman intensity is presented 3 dimensionally in Fig. 3. Consistent with the presence of different tetragonal domains, the 85 cm-1 soft mode observed in is clearly evident in the X′Y′ polarization data below 200 K. It first appears as a shoulder of the high-intensity central peak and becomes clearly resolved below 155 K. Before turning our attention to the pronounced central peak, we note that another mode (30 cm-1 at 6 K) of relatively high intensity is seen at low temperature. It is a temptation to regard this mode as the soft mode for the 120 K SPT. However, this fails due to the following arguments. First, it is well known that the 120 K SPT is first-order and hence the soft mode behavior is not expected. Second, a soft mode is always expected to generate fully symmetric fluctuations of the magnitude of the order parameter below the corresponding SPT. In contrast, the 30 cm-1 mode practically disappears in the component obtained by the XX-X′Y′ subtraction (Fig. 2). Therefore, we conclude that it belongs to a low frequency phonon of symmetry which becomes Raman active below 120 K due to the symmetry change. We cannot simply derive the true temperature dependence of its frequency from our data because a large part of the intensity is hidden under the central peak. Another obstacle is a complicated fitting procedure that must be employed in the low frequency region in which the damping constant is comparable to the frequency and, consequently, the line shape is not Lorentzian.
The Goldstone mode is manifested by a large central peak which appears below the phase transition at 200 K. Actually, it starts developing slightly above this temperature, which we attribute to the enhanced fluctuations of the order parameter Jin02 . The central peak is absent for all temperatures in the and spectra (to be reported elsewhere). It is also not seen in the room temperature data. Therefore, the usual Rayleigh scattering can be ruled out as its possible origin. We further conclude that Cd2Re2O7 does not demonstrate the relaxor behavior which leads to the notorious fully symmetric central peak of finite intensity in certain ferroelectrics Jona due to fluctuations of the same symmetry as the soft mode Cowley . Such a peak would be observable in A1 symmetry.
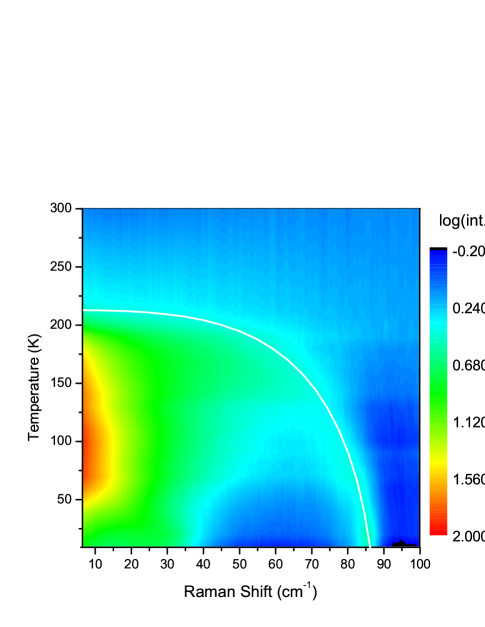
Fig. 4 is a contour plot of the / low frequency temperature dependence. Log(Intensity) is plotted on a false color scale to portray the scattering intensity over a wide dynamic range. The white curve is a guide to the eye highlighting the behavior of the soft mode. Roughly speaking, the Goldstone mode comprises the red and yellow areas of the Figure. As noted, it begins just above 200K at the lowest frequency and reaches its maximum intensity (height in Fig 3 or width in Fig. 4) at ( 85K, well below the lower SPT at 120K. At the lowest temperatures, the intensity goes back down although it remains strong at 6K. There are two reasons for the low temperature decrease. First, Raman lines in general tend to narrow at low temperatures because the nonlinear mode-mode coupling effects causing damping become less pronounced, and therefore more intensity is concentrated around zero frequency. Second, well below the SPT at 200 K, as the order parameter grows in value, one has to take into account higher order terms in , which introduce anisotropy and break the continuous symmetry. Under such circumstances, the mode acquires finite frequency resulting in lower Raman intensity, even though the mode may still remain overdamped.
Further insight into the nature of the Goldstone mode dynamics can be achieved by neutron scattering experiments which could fully resolve the central peak at very low frequency and measure the phonon frequency dispersion at finite wave vector . Here we present a simple model which predicts some of the results of neutron diffraction in Cd2Re2O7. We consider a three dimensional network of anharmonic oscillators described by the Hamiltonian (1) connected by harmonic springs of stiffness . Every oscillator represents a unit cell with the lattice constants , . We introduce the polar coordinates and , where is the unit cell number. Assuming and , we approximate the potential energy by a parabola in the vicinity of its minimum (see Fig. 1). The resulting Hamiltonian is
| (2) | |||||
where and are the momenta conjugated to and , respectively, and is the frequency of the mode at .
The equations of motion can be easily linearized for small deviations from the equilibrium value . As a result, we obtain the two branches of dispersion
| (3) |
for the “amplitude” (soft) mode and “phase” (Goldstone) mode, respectively. For small , is linear for any direction in the reciprocal space. The observation of a mode with linear dispersion in a neutron scattering experiment would constitute a valuable validation of the results of Raman scattering presented in this Letter.
In summary, we present the evidence of a Goldstone phonon mode in Cd2Re2O7 obtained by Raman scattering in a wide temperature range. Using theoretical models, we show that this observation is consistent with the previous experiments which established the symmetry of the structural order parameter. We also predict the dispersion of the frequency of the Goldstone mode which can be measured by neutron diffraction.
Acknowledgements.
∗ These authors contributed equally to this work. We thank P. Blaha, S. H. Curnoe, M. D. Lumsden, and D. J. Singh for useful discussions. C. A. K. acknowledges support through ONR/NRL. I. S. was supported in part by NSERC Canada. Oak Ridge National Laboratory is managed by UT-Battelle, LLC, for the U.S. Department of Energy under Contract No. DE-AC05-00OR22725. Work at UT was supported by NSF DMR-007 2998.References
- (1) J. Goldstone et al., Phys. Rev. 127, 965 (1962).
- (2) L.H. Ryder, Quantum Field Theory, 2nd. ed., (Cambridge Univ. Press, Cambridge, 1996).
- (3) P. Böni et al., Phys. Rev. B 52, 10142 (1995); I.B. Spielman et al., Phys. Rev. Lett. 87, 036803 (2001); Ch. Rüegg et al., Phys. Rev. Lett. 93, 257201 (2004).
- (4) I. Muševic, R. Blinc, and B. Zekš, The Physics of Ferroelectric and Antiferroelectric Liquid Crystals (World Scientific, Singapore, 2000).
- (5) Sometimes, the acoustic phonons are regarded as Goldstone modes resulting from the breaking of translational symmetry at a hypothetical liquid-crystalline solid phase transition. Here we deal with a Raman active optical Goldstone phonon, which develops due to a solid-solid structural phase transition.
- (6) M. Hanawa et al., Phys. Rev. Lett. 87, 187001 (2001).
- (7) H. Sakai et al., J. Phys. Condens. Matter 13, L785 (2001).
- (8) R. Jin et al., Phys. Rev. B 64, 180503(R) (2001).
- (9) J.P. Castellan et al., Phys. Rev. B 66, 134528 (2002).
- (10) J.-I. Yamaura and Z. Hiroi, J. Phys. Soc. Jpn. 71, 2598 (2002).
- (11) K. Arai et al., J. Phys. Condens. Matter 14, L461 (2002).
- (12) I.A. Sergienko and S.H. Curnoe, J. Phys. Soc. Jpn. 72, 1607 (2003).
- (13) I.A. Sergienko et al., Phys. Rev. Lett. 92, 065501 (2004).
- (14) C. Lu et al., Phys. Rev. B 70, 092506 (2004).
- (15) P.A. Fleury, Comments Solid State Phys. 4, 167 (1972).
- (16) V.L. Ginzburg et al. in Light Scattering near Phase Transitions, Eds. H.Z. Cummins and A.P. Levanyuk (North-Holland, Amsterdam, 1983), p. 3.
- (17) J. S. Dodge and B. D. Gaulin, private communication.
- (18) O. Svitelskiy et al., Phys. Rev. B 68, 104107 (2003).
- (19) A. D. Bruce and R. A. Cowley, Adv. Phys. 29, 219 (1980).
- (20) R. Jin et al., J. Phys.: Condens. Matter 14, L117 (2002).