Crossover from Kramers to phase-diffusion switching in hysteretic DC-SQUIDs
Abstract
We have measured and propose a model for switching rates in hysteretic DC-SQUID in the regime where phase diffusion processes start to occur. We show that the switching rates in this regime are smaller than the rates given by Kramers’ formula due to retrapping of Josephson phase. The retrapping process, which is affected by the frequency dependent impedance of the environment of the DC-SQUID, leads to a peaked second moment of the switching distribution as a function of temperature. The temperature where the peaks occur are proportional to the critical current of the DC- SQUID.
pacs:
74.40.+k, 85.25.Dq, 74.50 +rThe phenomenon of phase-diffusion in Josephson junctions has been extensively studied over the past 20 years Martinis ; Iansiti ; Vion ; Koval . These studies, in general, focused on deep sub-micron junctions with very low critical currents, so that the Josephson coupling energy was of the order . Extensive diffusion of the phase typically occurred before the junction switched to the so-called running state with voltage near the superconducting gap. With the advent of research on flux qubits for quantum computing using SQUID magnetometers with much larger, unshunted junctions for readouts (A, this phase-diffusion process has reappeared, rather dramatically, in a different regime. In these larger junctions, which are the focus of this work, the crossover from simple Kramers activation to phase-diffusion before switching tends to occur at higher temperatures and involves only a small number of phase slip events before the switching process. Nevertheless the effects of this crossover can be quite pronounced, appearing, perhaps most dramatically, as a significant narrowing of the switching distribution and thus, in a sense, a greatly increased sensitivity of the magnetometer, albeit, at the expense of greater back action on the qubit.
The standard picture for the dynamics of a Josephson junction, shown in Fig. 1a, is that of a particle with a mass proportional to the junction capacitance moving in a potential where is the phase and is the bias current of the junction. For sufficiently low damping around the plasma frequency () of the Josephson junction, the energy gain as the particle moves from one barrier to the next will exceed the loss due to damping. So, switching from the supercurrent state to running state is triggered by a single event, the phase particle escaping from a potential well, and no phase diffusion occurs. This situation is usually realized in large area Josephson junctions. On the other hand, if the damping around the junction plasma frequency is sufficiently high then at low bias the phase particle will always retrap in a local minima after escape and a finite resistance phase-diffusion branch exists on the I-V curve of the junction. This case is usually realized in ultra-small Josephson junctions and can be observed down to lowest temperatures attainable with a dilution refrigerator Vion . For low damping, the switching rate equals to the thermally activated (TA) escape rate from the potential minima which is given by well known Kramers’ formula Kramers
| (1) |
where is the effective attempt frequency , is the height of potential barrier from a local minimum to the next maximum (see also Fig. 1a) and is a damping dependent factor () Li . For the case of high damping, where phase diffusion is always present at low bias, a similar expression can be given for the switching rate although the meaning of the potential barrier and attempt frequency are very different Vion . For intermediate damping a third regime occurs that bridges the previous two. At lower temperatures a single escape can trigger the switching of the junction from the metastable minima but at higher temperatures, where the mean escape current is reduced, the energy gain is less and phase diffusion occurs. In this case the switching rate is not only determined by the escape rate but also by the probability of retrapping of the phase particle after it has escaped.
The total transition rate from metastable minima to running state can be written as a sum of rates through different escape and retrapping sequences as . Here stands for the switching rate of a process where the particle retraps times before the runaway starts and for the probability of such a process. can be expressed in terms of the retrapping probability (), which we define as the probability that after the ascent of the phase particle to a local maximum it will be retrapped in one of the subsequent minima . For the case relevant to our data, where this gives
| (2) |
In Eq. 2, the switching rate factorizes into two parts, one of which is the Kramers rate (1) and the other a function of the retrapping probability. Since the latter is always less than or equal to one, the actual switching rate is smaller than or equal to the rate predicted by Kramers equation (1). At zero temperature, consideration of the balance between energy gain from the bias source and energy losses due to the damping leads to the conclusion that will abruptly switch from 1 to 0 at some bias current the retrapping current. For ohmic damping and ( BenJacob ; Tinkham .
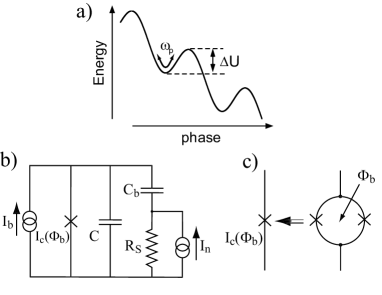
To find for finite temperatures and frequency dependent damping, we rely on Monte Carlo simulations. We calculate for the RCSJ model with a series RC shunt added to account for the stronger high frequency damping (Fig. 1.b), e.g. due to the leads. Extensive discussion of this model along with equations of motion for the phase can be found in ref. Kautz . The damping at is assumed to be much stronger than that at low frequency as required for the coexistence of phase-diffusion and hysteresis. However, the exact value of the low frequency damping is not important here, so we omit the quasiparticle resistance and bias resistors which are much larger than the typical transmission line impedance ( seen by the junction near To obtain the particle is initiated repeatedly at the top of a barrier and its subsequent motion in the presence of Nyquist noise is monitored until it is retrapped in one of the metastable minima or switches to the running state.
Figure 2 shows this calculated as a function of bias current for a range of temperatures that is important for our data. At zero temperature, switches abruptly, as expected from energy balance. At higher temperatures, however, the retrapping probability curve broadens and shifts to higher bias currents with where is defined as . Even though the overall shift is toward higher bias as increases, also decreases slightly from unity for where is the actual retrapping current for the circuit model in Fig. 1a, i.e. calculated at . For , the simulations show decreases essentially exponentially as decreases. For this to occur, the frequency dependence of the damping is crucial. If thermal fluctuations give enough initial velocity to the particle, the linear component of will increase, lowering the velocity dependent damping and thereby permitting switching even though . Due to high probability of retrapping the switching rate deviates substantially from Kramers’ rate in this range of bias currents.
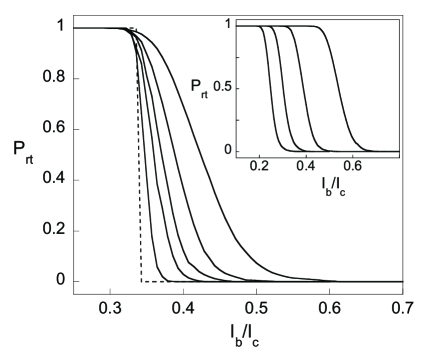
The effects of the choices of the circuit parameters and have been investigated using the simulations. The inset in Fig. 2 shows for a range of . As can be seen, shifts to lower bias currents with as predicted by where for our non-Ohmic circuit model . We have chosen values of to be sufficiently large (15-20 pF) that the damping is nearly frequency independent for frequencies near . For these and larger values of is essentially independent of for Only in the region , does its exact value become important. For determining the onset of phase-diffusion as increases, the exact value of is not critical. However, the details of the regime where more extensive phase diffusion takes place do depend on the exact frequency dependence of the damping.
| DC-SQUID | (A) | (fF) | (pH) | |
|---|---|---|---|---|
| A | 4.25 | 90 | 37 | 0.025 |
| B | 2.90 | 260 | 70 | 0.05 |
The samples we used in this study were DC-SQUIDs fabricated using a self-aligned Nb trilayer process Wei . The inductances of the SQUIDs were chosen small enough that . So, for most flux biases, , the potential of the SQUIDs could be approximated well by that of a single junction with an effective critical current (Fig. 1c). Two samples with different parameters were measured in our two laboratories. The results of these two measurements are essentially identical. The parameters of the samples are listed in Table 1. We determined the total critical current of the SQUIDs by fitting the switching rates in the temperature interval 0.4-1.0 K, where, for the rates followed the Kramers rate (Eq. 1) well. We estimate the total capacitance of two junctions of the SQUID from their area and the specific capacitance of 45 fF/m2 and calculate the inductances () by using a 3D inductance calculation program Khapaev .
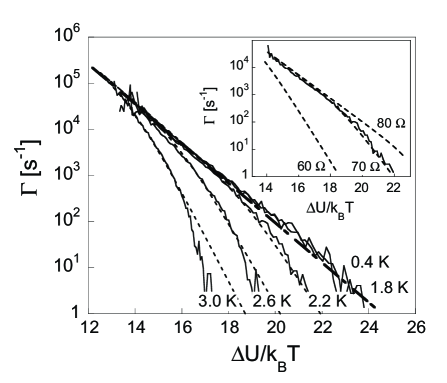
The sample is placed in a copper can filled with He exchange gas and located on a temperature regulated stage of a dilution refrigerator. Extensive electrical filtering is used to prevent interference and higher temperature thermal noise from reaching the sample. The bias current of the SQUID is ramped at constant rate. When a voltage appears across the device, the value of bias current at which switching occurred is recorded. This is typically repeated over 104 times at a given temperature and flux bias and a histogram of the switching currents is compiled. In Fig. 3, typical switching rates versus the ratio of barrier height to temperature from sample are plotted. Here the barrier height is calculated from the full two dimensional (2D) potential of the DC-SQUID for each value of bias current. According to Eq. (1) the rates should fall onto one straight line in this plot if the ln dependence of rate on the bias current is neglected. In the temperature range 0.4..1.8 K this is indeed the case. At higher temperatures and larger value of , however, the switching rates increasingly deviate from the simple exponential dependence described by Eq. (1). Following our earlier argument we expect this to happen when retrapping takes place. To verify this, we also plot the modified rate calculated from simulations of Eq. (2) in the same figure. To achieve a reasonable speed, a 1D approximation to the full 2D potential with an effective is used to obtain . The agreement between measurement and the model is very good despite the simplicity of the circuit model.
Next we study the crossover to phase diffusion as a function of temperature and For clarity, in this large data set, only the first two moments of switching histograms, and rather than the complete curves, are presented. Figure 4. shows and for different values of for sample . One can notice three distinct regions in the temperature dependence of the width . For flux bias and mK the escape is by quantum tunneling (QT) giving a width that is nearly independent of . For higher , in the range of K, and for larger values of agrees well with the predictions of TA (Eq. 1).The cross-over temperature to QT decreases with , as expected, with the very lowest data never completely reaching the QT regime. At still higher temperatures, we observe a third regime where the width of the distribution decreases as temperature is increased . Based on our earlier discussion, this results from retrapping of the system after its initial escape Kivioja . Similarly to the second moment, agrees well with theory in the QT and TA regimes. It is greater than predicted by TA after the onset of retrapping since a greater tilt to the potential is required to overcome the retrapping and initiate switching.
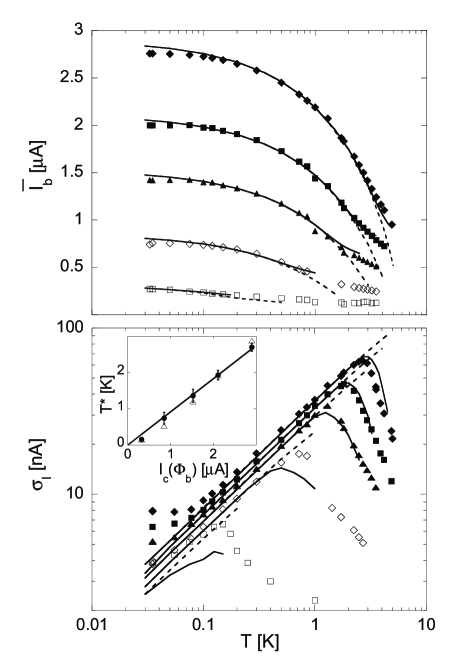
Figure 4 also shows calculations based on Eq. (2) (solid lines). As one can see Eq. (2) predicts well the anomalous temperature dependence of the width for 0.239 and 0.324 but gives only a fair fit for and 0.474 . For , the 1D potential of a single junction with effective critical current is a rather poor approximation to the actual 2D potential of the DC-SQUID which can explain the discrepancy. Nevertheless, for all values of effective critical currents, calculations based on Eq. (2) predict reasonably accurately the temperature at which the width of the switching distribution is a maximum. The inset of Fig. 4. shows as a function of the effective critical current along with predictions of Eq. (2). As this figure shows, spans more than one order of magnitude for a given SQUID and scales linearly with the effective critical current. Our calculations also show that the observed linear vs. dependence follows only for sufficiently small values of high frequncy damping, i.e. large . For larger damping, this dependence deviates from linear and approaches quadratic. The simulations of dynamics of the phase particle (near ) show also that at the temperature the retrapping probability around the mean of the switching distribution is relatively low (), so most escapes of the phase particle from local minima lead to switching. In those cases when retrapping occurs, the number of wells the phase particle moves before retrapping is, on average 2..3. As the temperature rises further and the average switching current decreases advances of the phase particle before retrapping become shorter due to smaller energy input from bias source but more frequent due to the increased level of current fluctuations. This leads eventually to the appearance of a stable phase diffusion state where the phase particle diffuses down the tilted Josephson potential with uniform average speed giving rise to a measurable phase diffusion voltage. We observe such a phase diffusion voltage (1 V) for and 0.474 (sample ) at K.
In summary, we observe the crossover from Kramers escape to escape affected by phase diffusion in relatively large Josephson junctions having of the order of 1 A. This is manifested by a peak in the width of the switching distribution vs T at a temperature which scales linearly with . For , can decrease significantly below that expected for Kramers escape. Our data are in good agreement with the results of Monte Carlo simulations based on a simplified circuit model for the junction in which the higher damping at the plasma frequency is represented by a series RC shunt.
The authors are grateful to D. V. Averin and K. K. Likharev for useful discussions. Work is supported in part by NSF (DMR-0325551) and by AFOSR, NSA and ARDA through DURINT grant (F49620-01-1-0439).
References
- (1) J. M. Martinis and R. L. Kautz, Phys. Rev. Lett. 93, 1507 (1989).
- (2) M. Iansiti et al., Phys. Rev. B39, 6465 (1989).
- (3) D. Vion et al., Phys. Rev. Lett. 77, 3435 (1996).
- (4) Y. Koval, M. V. Fistul and A. V. Ustinov, Phys. Rev. Lett. 93, 087004 (2004).
- (5) H. A. Kramers, Physica 7, 284 (1940).
- (6) S. X. Li et al. Phys. Rev. Lett. 89, 098301 (2002).
- (7) E. Ben-Jacob et al. Phys. Rev. A 26, 2805 (1982).
- (8) M. Tinkham, Introduction to Superconductivity, 2nd edn. (1996) McGraw-Hill.
- (9) R. L. Kautz and J. M. Martinis, Phys. Rev. B 42, 9903 (1990).
- (10) W. Chen, V. Patel, J. E. Lukens, Microelectronic Engineering, 73-74, 767 (2004).
- (11) M. M. Khapaev, A. Y. Kidiyarova-Shevchenko, P. Magnelind, M. Y. Kupriyanov, IEEE Trans. Appl. Superconductivity 11, 1090 (2001).
- (12) Similar dependence was reported very recently in J. M. Kivioja et al., cond-mat/0501383 and in V. M. Krasnov et al., cond-mat/0503067.