The charge ordered state in half-doped Bi-based manganites studied by 17O and 209Bi NMR
Abstract
We present a 209Bi and 17O NMR study of the Mn electron spin correlations developed in the charge ordered state of Bi0.5Sr0.5MnO3 and Bi0.5Ca0.5MnO3. The unusually large local magnetic field indicates the dominant character of the lone electron pair of Bi3+-ions in both compounds, probably, responsible for the high temperature of charge ordering . The observed difference in for Bi0.5Sr0.5MnO3 to Bi0.5Ca0.5MnO3 is suggested to be due to a decrease in the canting of the staggered magnetic moments of Mn3+-ions from adjacent ab layers. The modification of the 17O spectra below demonstrates that the NMR line due to the apical oxygens is a unique local tool to study the development of the Mn spin correlations. In the AF state the analysis of the 17O spectrum of Pr0.5Ca0.5MnO3 and Bi0.5Sr0.5MnO3 points towards two different types of charge ordering in these systems: a site-centered for the first manganite and a bond-centered one for the second material.
pacs:
75.30.Et, 76.60.CqI INTRODUCTION
Among doped transition metal oxides, one of the most interesting systems to study charge ordering (CO), orbital ordering (OO), and spin ordering phenomena is the half-doped manganites R0.5A0.5MnO3 (R - rare-earth ion or Bi; A - Ca, Sr). Furthermore, manganites show the colossal magnetoresistance effect which results from the competition between the insulating charge-ordered state and metallic ferromagnetic state. Nevertheless, the role of charge ordering and/or orbital ordering in the magnetotransport properties of manganites remains unclear.
At high temperature R0.5A0.5MnO3 is in the charge-disordered (CD) paramagnetic (PM) state. The disorder is related to the thermally activated hoping of -holes. This hoping causes ferromagnetic (FM) correlations between the electron spins of the neighboring Mn-ions, Kajimoto et al. (1998); Liu et al. (1998); Yakubovskii et al. (2003) the spin-fluctuation parameters being controlled by the double-exchange mechanism proposed by Zener. Zener (1951) Below the localization of the mobile holes induces transition to the CO phase. The spatial ordering of electrons over given Mn-orbitals leads to an excess in the kinetic energy that is compensated by the elastic energy due to the cooperative Jahn-Teller distortions in the MnO6-octahedra sublattice. The orbital ordering is related to the Jahn-Teller distortions.
In the present work, OO and CO have been studied in Bi- based manganites. The critical temperature of charge ordering is K for Bi0.5Ca0.5MnO3 Bokov et al. (1967) and 475 K for Bi0.5Sr0.5MnO3.Garcia-Munoz et al. (2001) One open problem is why the critical temperature of charge ordering in Bi-based manganites is so much higher than in their rare-earth counterparts. It was established for the rare-earth manganites RE0.5(Ca,Sr)0.5MnO3 that the -band width is controlled by the (Mn-O-Mn)-bond bending which in turn depends on - the average radius of (RE,A)-cations. A smaller narrows -band and favors the hole localization thus increasing . Recently it was shown, Garcia-Munoz et al. (2001) that such correlation between and is not observed in Bi-based manganites Bi0.5(Ca1-x,Srx)0.5MnO3. While increases smoothly with for these manganites belong to one of the space subgroups in the CO-phase. The Sr-rich manganites () belong to space subgroup and show the opposite tendency, i.e. decreases with . Beran et al. (2002); Frontera et al. (2003); Hejtmanek et al. (2003) Thus, the high values of for Bi0.5Ca0.5MnO3 and Bi0.5Sr0.5MnO3 cannot be properly explained considering only the average buckling of the (Mn-O-Mn)-bonds. It was suggested Garcia-Munoz et al. (2001) that an increase of 6 character in the stereoactivity of the Bi3+ lone electron pair could favor the growth of for but the mechanism of the influence of lone pairs, as well as the detailed orbital structure of these pairs in different Bi manganites, have not been clarified.
We have performed 209Bi zero-field NMR measurements on Bi0.5Ca0.5MnO3 and Bi0.5Sr0.5MnO3 in the AFM-ordered state. According to Ref. Frontera et al., 2001, below the Neel temperature ( K) Bi0.5Sr0.5MnO3 exhibits a static spin order of the CE′-type (see Fig. 1). For Bi0.5Ca0.5MnO3 in the AFM state the magnetic structure ( K) has not been reported yet. For both compounds, we have observed a very large value of , the local field at Bi. It depends on the short-range spin order of the nearest Mn. For both samples the analysis of has been performed in the frame of the CE′-type magnetic order, although it is not known for Bi0.5Ca0.5MnO3. Our results favors the dominant character of the lone pair of Bi rather than the one. To assertain magnetic structure of Bi0.5Ca0.5MnO3 the 17O NMR spectra were measured in zero external magnetic field at low temperature.
The purpose of the 17O NMR study reported in this paper is to trace the Mn-Mn electron spin correlations which develop when cooling Bi0.5Ca0.5MnO3 and Bi0.5Sr0.5MnO3 in the CD/CO PM phase. In the first NMR investigation of the CO state of a half-doped manganite, Yakubovskii et al. (2003) it was shown that the 17O NMR probe is a powerful tool to study the orbital ordering and the spin ordering. Compared to other techniques, NMR is a local probe, which enables us to obtain valuable information on the spin correlation of Mn-ions through the orbital hybridization of Mn with the probed oxygen nucleus. Indeed it was shown by 17O NMR Yakubovskii et al. (2003) that in Pr0.5Ca0.5MnO3 the CE-type magnetic correlations develop gradually below . The AF correlations between the -layers appear first, and only at a lower temperature the CE-correlations in the -planes are formed. In this work we compare the formation of the Mn-Mn spin correlations in Bi-based manganites to that in Pr0.5Ca0.5MnO3.
For half-doped manganites two possible scenario of CO/OO-transition are considered. The first relates to the localization of holes at -orbital of the transition metal cation. It results in the conventional CE-order of the ions of different valence (Mn3.5+δ/Mn3.5-δ) in the -plane. Wollan and Koeler (1955); Jirak et al. (1985) This scenario is based on an ionic description of the charge ordering, it is also named site-centered. Efremov et al. (2003)
The second scenario suggests the formation of the Zener-polaron state, which consists of FM-correlated dimers of Mn3.5+-ions. Daoud-Aladine et al. (2002)
This option is also named bond centered. Efremov et al. (2003) The relation between the kinetic energy of the electrons in the -band and the -plane superexchange coupling of -electrons defines, in many respects, which type of CO is formed in a crystal. Efremov et al. (2003, 2004) The details of CO in manganites are still an open question. Nevertheless, it was suggested in the -ray diffraction study Hejtmanek et al. (2003) performed on a single crystal of Bi0.5Sr0.5MnO3 that the CO-state in this system is formed by Zener pairs. We address the questions concerning the detailed form of the CO phase by studying the relative intensity of the lines in the 17O spectra measured for the completely formed AF-CO state of manganites.
II EXPERIMENT
We used powder samples of Bi0.5Ca0.5MnO3 ( = 330 K) Garcia-Munoz et al. (2001) and Bi0.5Sr0.5MnO3 ( = 475 K), Garcia-Munoz et al. (2001) which were prepared by the standard solid state reaction technique. The powders were enriched in 17O isotope up to . The single-phase nature of the enriched samples was confirmed by -ray diffraction at room temperature.
The NMR measurements were performed with several commercial and home-built pulse phase-coherent NMR spectrometers operated in the frequency range 20 - 500 MHz using a spin-echo technique. The 209Bi and 17O NMR spectra were obtained by measuring at each frequency () the intensity, 209Int(), of the spin-echo signal formed with the radio-frequency () pulse sequence . The width of a () -pulse did not exceed (1.5 - 2) s. The 17O NMR signal in H2O was used as the frequency reference () to determine the shift of NMR line .
The measurements of the broad 17O NMR spectra in the antiferromagnetic state (see Section D) were performed with a special care. We used a single NMR coil for the whole frequency range. Its quality factor Q was chosen smoothly dependent on the frequency . At each frequency the impedance of the resonance circuit was matched to the 50 Ohm input impedance of the receiver, and the gain of the power amplifier was adjusted to the maximum of the echo intensity, 17Int, keeping the width of the () -pulse constant. Such a care had to be paid in order to provide at every point of the broad spectrum the echo-signal voltage, , which is proportional to spectral intensity the 17O NMR spectrum multiplied by . The spectral intensity normalized in such a manner yields the fraction of oxygen contributing to the echo at the given frequency point.
III RESULTS AND DISCUSSION
III.1 209Bi zero-field NMR spectra
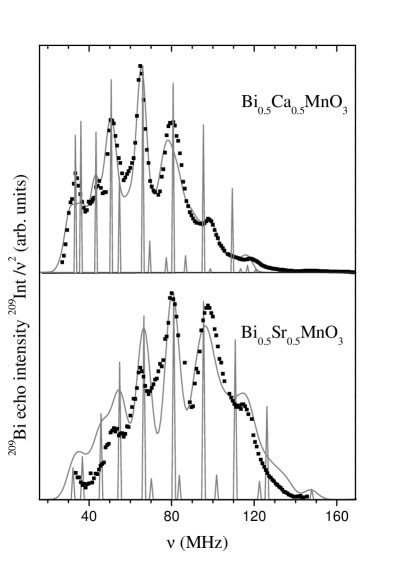
Figure 2 shows the 209Bi NMR spectra measured in the AFM-ordered state of Bi0.5Ca0.5MnO3 ( K) Bokov et al. (1967) and Bi0.5Sr0.5MnO3 ( K) Hejtmanek et al. (2003) in zero external magnetic field (ZFNMR) at K. The spectral intensity of the very broad line of 209Bi (nuclear spin , quadrupolar moment barns) is presented as the echo intensity, 209Int(), corrected by the factor . The components of the local magnetic field () as well as the parameters of electric field gradient (EFG, ) - quadrupole frequency, , and asymmetry parameter, with , - were determined from the exact diagonalization of the Hamiltonian, including both the magnetic and the electric quadrupole interactions of the 209Bi nuclei with the corresponding local magnetic field and EFG. The calculation was performed for the matrix representation in the frame of reference, XYZ, where the corresponding term of electric quadrupole interaction is diagonal. The calculated transitions are indicated by narrow peaks in Fig. 2 and the corresponding results for 209H and are listed in Table 1. We have taken into account distributions of both and the EFG parameters, that can appear due to the Bi/Sr or Bi/Ca charge disorder. The distribution functions were taken in the Gaussian form with the corresponding width and . The calculated broadened spectrum representing the result of such a convolution is drawn by the grey curve in Fig. 2. With a single set of NMR parameters it reproduces the experimental data points rather well in a wide frequency range.
| Sample | Bi0.5Sr0.5MnO3 | Bi0.5Ca0.5MnO3 |
|---|---|---|
| (kOe) | 101(5) | 85(5) |
| (kOe) | 9 | 0 |
| (kOe) | 37 | 33 |
| (kOe) | 94 | 78 |
| (kOe) | 10 | 6 |
| (MHz) | 16(1) | 14(1) |
| (MHz) | 3 | 3 |
| 0.90(5) | 0.75(5) |
The line of central transition peaks at = 80 MHz for Bi0.5Sr0.5MnO3 and at = 65 MHz for Bi0.5Ca0.5MnO3. It corresponds to a very large local magnetic field at the Bi-site in the AFM-state = 101 kOe and = 85 kOe in Bi0.5Sr0.5MnO3 and Bi0.5Ca0.5MnO3, respectively. For comparison, the local field at 139La nuclei is = 3.5 kOe in the AFM ordered LaMnO3. Kumagai et al. (1999) Moreover, in the FM-ordered domains of the half-doped La0.5Ca0.5MnO3 the fully polarized eight nearest Mn moments create at the 139La the field = 36.3 kOe Yoshinari et al. (1999); Allodi et al. (1998), which is much less than those observed in this study.
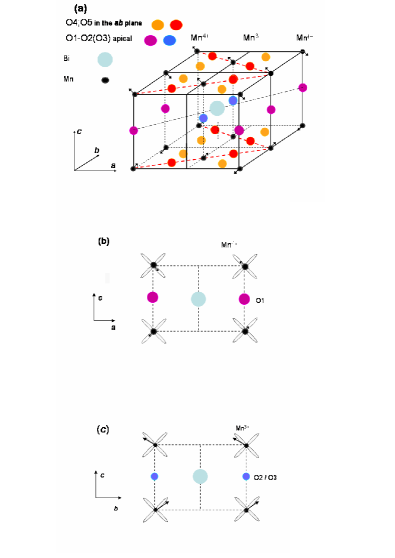
Two types of magnetic order, namely A-type and CE′-type magnetic structures were revealed at K in neutron diffraction studies of polycrystalline Bi0.5Sr0.5MnO3. Frontera et al. (2001) The A-type magnetic order should result in the complete cancellation of at the Bi-site similar to the situation of La-site in LaMnO3. Kumagai et al. (1999) For CE′-type, the AFM-order leads to a net transfer of spin polarization from the four neighboring Mn3+-ions to Bi (see Fig. 1 c).
The resulting local field is aligned along [001] direction and its magnitude is proportional to (Mn- the c-projection of the staggered magnetic moment of Mn3+. For further comparison of different hyperfine couplings it is more convenient to consider the local field created at the Bi-nuclei by one electron spin. By specifying Mn = 1.4 Frontera et al. (2001) we obtain
| (1) |
for Bi0.5Sr0.5MnO3 with the CE′-type AFM-order. This value exceeds more than four times the corresponding value of = 4.5 kOe/ found in La0.5Sr0.5MnO3 at the FM state. Yoshinari et al. (1999)
It is worth noting that in the insulating state of manganites the -orbital of La3+-ion is nearly empty, while the Bi+3-ion holds two electrons at the valence shell. As it was suggested in Ref. Yoshinari et al., 1999, the -orbital of the La3+ cation can hybridize with one of the three (Mn) atomic orbitals with a single unpaired spin. In the Bi-based manganites the similar (Mn)-(Bi) overlap is one of the possible ways to transfer -electron spin polarization of Mn-ions to the central Bi-cation. Another possibility is the Mn spin polarization transfer via (Mn)-(O)-(Bi) orbitals but it seems less effective in providing a local field comparable in magnitude with the observed one. Indeed, the corresponding hyperfine field due to the core polarization kOe per electron is approximately two orders of magnitude less than the Fermi contact hyperfine field kOe per electron. Carter et al. (1977) The former case would lead to an unrealistic high value of the -wave spin polarization , which is transferred from Mn to the -orbital of Bi - . In the case of (Mn)-(Bi) overlap, the large Fermi-contact field yields a much more reasonable estimate of the corresponding transferred -wave spin polarization .
Thus, taking into account the large Fermi-contact hyperfine field created at the nuclei by a single unpaired electron located at the -orbital, , one can suggest that the observed very large strongly favors the dominant character rather than the character of the lone electron pair of Bi in both Bi0.5Sr0.5MnO3 and Bi0.5Ca0.5MnO3.
We do not think that the reduced value of in Bi0.5Ca0.5MnO3 compared to Bi0.5Sr0.5MnO3 is due to a change in character of the Bi lone electron pair as suggested in Ref. Garcia-Munoz et al., 2001, since the decrease is not as large as expected for such change when considering the values of and .
The difference in the observed is more probably due to variation of the canting of the staggered magnetic moments of Mn3+ ions in Bi0.5Ca0.5MnO3 compared with Bi0.5Sr0.5MnO3 as shown below. As the magnetic structure of the AFM state in Bi0.5Ca0.5MnO3 at low temperature has not been reported yet we make an attempt to clarify this point by measuring 17O ZFNMR in the same samples at 4.2K.
III.2 17O Zero Field NMR spectra
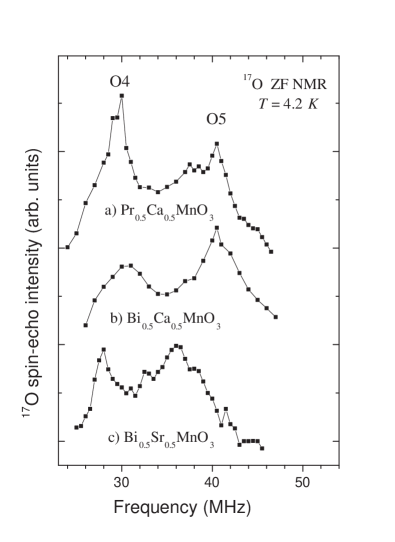
Figure 3 shows the zero field 17O NMR (ZFNMR) spectra in the AFM ordered state of Pr0.5Ca0.5MnO3 (a), Bi0.5Ca0.5MnO3 (b), and Bi0.5Sr0.5MnO3 (c) oxides at 4.2 K. 111In both Bi-based manganites the ZFNMR spectrum shows a partial overlap of the low-frequency tail of the 209Bi signal with the 17O spectrum (see Fig. 2 and 3). The spin-echo spectra of 17O (Fig. 3) were obtained by applying a pulse sequence, which parameters were adjusted to obtain the maximum ratio I = 17Int/209Int where 17Int and 209Int are the spin echo intensities. In these conditions the ratio exceeds 10. Furthermore, we have compared the ZFNMR spectra measured in the 17O enriched and in a natural Bi0.5Ca0.5MnO3 sample. The latter is a non-enriched fraction of the very same Bi0.5Ca0.5MnO3 material. Its 209Bi ZFNMR spectrum is shown on the top panel of Fig.2. From this comparison, we found that the difference of the spectra reproduces rather well the two-peaks line shape and each peak position of the 17O ZFNMR spectrum presented on Fig. 3 b.
| Sample | Bi0.5Sr0.5MnO3 | Bi0.5Ca0.5MnO3 | Pr0.5Ca0.5MnO3 | |||||||||||||
|---|---|---|---|---|---|---|---|---|---|---|---|---|---|---|---|---|
| (O4) (MHz)/(O4) (kOe)/ | 28/48.5/ | 31/54/ | 30/52/ | |||||||||||||
| (O4) (MHz)/(O4) (kOe)/ | 36/62/ | 40/69/ | 40/69/ | |||||||||||||
| () |
|
|
|
|||||||||||||
| (∘) | 33 | 25 | 0 | |||||||||||||
All three spectra consist of two rather broad peaks, the positions of their maxima are listed in Table 2. For proper attribution of the peaks to each of the (O1)-(O5) Jirak et al. (2000) oxygen sites in the Bi-based manganites we first focus on Pr0.5Ca0.5MnO3 which has the canonical CE-type magnetic structure at low temperature.
The perfect CE-type CO/OO implies a zigzag arrangement of the ordered and orbitals of Mn3+-ions in the -plane of the orthorhombic lattice, with the FM correlated magnetic moments in the zigzags. The neighboring zigzags are AF-coupled, the ordering in -direction is also AF. Oxygen in the apical positions of MnO6 octahedra is located between two Mn3+-ions (O1-site, Fig. 3 in Ref. Jirak et al., 2000) or between two Mn4+-ions (O2/O3-site). As shown in Ref. Yakubovskii et al., 2003, the local magnetic field is created mainly by the spin polarization of oxygen transferred via the -(Mn)-(O) overlap from the neighboring Mn. This spin arrangement causes complete cancellation of the local magnetic field at the apical O1-O3 sites, and its corresponding ZFNMR line is out of the frequency range presented in Fig. 3. The O4-O5 sites correspond to the oxygens in the -plane. The oxygen (O4-site) participates in the AF-coupling of neighboring Mn4+, Mn3+ from adjacent zigzags. The other oxygen (O5-site) is located inside a zigzag surrounded by two FM-coupled Mn4+ and Mn3+ ions.
The high-frequency peak in the 17O ZFNMR spectrum is attributed to oxygen positioned in O5-sites whereas the low-frequency peak is presumably due to oxygen located in O4-sites. Indeed for oxygen in O5-site the transferred -wave spin density is maximal since within the zigzag the lobe of the partially occupied orbital of Mn3+-ion points toward this oxygen. Furthermore two neighboring Mn-ions are FM-correlated. For O4-site a rather large transferred hyperfine field is expected for the following reason. Although the Mn spins from adjacent zigzags are antiparallel, the O4-oxygen is ”sandwiched” between Mn3+ and Mn4+-ions with different spin values and different orbital occupations, i.e. with different covalency. So the transferred polarizations from these two Mn-ions should not compensate each other as they do for the apical oxygens (O1,O2/O3). It results in a substantial but smaller shift than for the O5-site. Moreover the transferred -wave polarization from Mn4+-ion is expected to be negative due to effects of covalent mixing with the empty -orbitals. Indeed, the charge transfer from the occupied O- orbital to the empty -orbital is spin-dependent since it is regulated by the intra-atomic exchange coupling with electrons on -orbitals.
In the CE spin ordered state the transferred static s-wave polarization at the oxygen site may be expressed through the transferred spin densities (Mn3+) or (Mn4+) of the neighboring Mn (with and ), and the following expressions can be considered for at the O5-site:
| (2) |
and at the O4-site:
| (3) |
respectively. , (Mn3+) and (Mn4+) are vectors. The sign ”+”/”-” in 2, 3 refers to the FM/AF spin correlations of the neighbor Mn3+- and Mn4+-ions. Here, =0.0216 cm-1 is the isotropic hyperfine coupling constant for oxygen ion. Fraga et al. (1976) = 1.1 MOe is the corresponding hyperfine magnetic field due to the Fermi-contact interaction with the electron located on the -orbital. Following Ref. Shulman and Jaccarino, 1957, the corresponding isotropic spin density transferred to oxygen from neighboring Mn-ions may be defined with the factor .
Using the 17O ZFNMR results and the neutron diffraction data from Ref. Jirak et al., 2000, listed in Table 2, for Pr0.5Ca0.5MnO3 we can quantify the factors in Eqs. (2), (3) as: and , which are somewhat less than (Ref. Yakubovskii et al., 2003) estimated in a similar way in the CD PM state for the very same sample.
Let us now consider Bi0.5Sr0.5MnO3. As the degree of the spatial overlap of (Mn)-(O) orbital decreases rather slowly with the interatomic Mn-O distance in the series of manganites considered here, we assume that the ratio is not changed from Pr0.5Ca0.5MnO3 to Bi-manganites. With this assumption and using the value of deduced from the refined neutron diffraction data for CE′-phase in Bi0.5Sr0.5MnO3, Frontera et al. (2001) equations (2) and (3) yield the values and . Thus one can conclude that the admixture of the -wave character to the -wave function slightly increases in Bi0.5Sr0.5MnO3 compared to Pr0.5Ca0.5MnO3
For Bi0.5Ca0.5MnO3, there are no available refined staggered magnetization data. We have used the following assumptions in order to calculate the magnetic moments with the help of Eqs.(1)-(3):
- the same CE′-type magnetic structure as in Bi0.5Sr0.5MnO3 takes place in Bi0.5Ca0.5MnO3 at low temperature.
- the -wave admixture to a character of the lone electron pair of the Bi3+-ion, , is kept constant from Sr to Ca manganite.
As can be seen in Table 2, from BiSrMnO to BiCaMnO to PrCaMnO the magnitude increases. Furthermore, it is accompanied by a decrease of which indicates a decreasing canting. Compared to the CE structure of Pr0.5Ca0.5MnO3, the CE′ structure of the Bi-based samples may be related to a stronger interplane coupling and/or a specific anisotropy of the Jahn-Teller distortion along axis. Our results show that the CE′-type structure in Bi0.5Sr0.5MnO3 is more pronounced than in Bi0.5Ca0.5MnO3.
III.3 17O NMR in the paramagnetic charge-disordered and charge-ordered states
Figures 4 (a,b) show the 17O NMR spectra measured at different temperatures on Bi0.5Ca0.5MnO3 and Bi0.5Sr0.5MnO3 in the PM state. The spectra were obtained at 90 kOe above K and at 120 kOe below 320 K. The comparison (not shown) of the spectra obtained with both fields around 300K demonstrates the negligible effect of the quadrupolar interaction. For comparison we reproduce in Fig. 4 (c) the 17O NMR spectra ( 70 kOe) of Pr0.5Ca0.5MnO3 in the PM state. Yakubovskii et al. (2003) All the spectra were taken when cooling the samples from the highest temperature indicated in Fig. 4 (a-c) to avoid any hysteresis. According to resistivity data, Tomioka et al. (1996); A.Kirste et al. (2003) cooling our Bi-samples in the external magnetic field indicated above does not suppress the CO-transition.
For all compounds, in the CD-state above the 17O spectrum consists of a single line. With decreasing temperature its shift increases following the Curie-Weiss law with positive indicating the presence of FM electron correlations of Mn: K in Bi0.5Sr0.5MnO3, 170(10) K in Bi0.5Ca0.5MnO3 and 130(20) K in Pr0.5Ca0.5MnO3. Yakubovskii et al. (2003)
We have used static magnetic susceptibility data for Bi0.5Ca0.5MnO3 Bokov et al. (1967) and Bi0.5Sr0.5MnO3 Hejtmanek et al. (2003) to estimate the corresponding -wave spin density transferred to oxygen from neighboring Mn in the CD state. The slope of plot corresponds to the local magnetic field =12.0(5) kOe/ (Bi0.5Sr0.5MnO3) and = 12.4(5) kOe/ (Bi0.5Ca0.5MnO3 ). For Pr0.5Ca0.5MnO3 we refined the estimation of = 7.1(3) kOe/ in an accurate 17O NMR study performed at 120 kOe as compared to the earlier published value. Yakubovskii et al. (2003) In comparison to Pr0.5Ca0.5MnO3, the increase of in the Bi-based manganites evidences a larger (Mn)-(O) admixture.
For Pr0.5Ca0.5MnO3, K. Jirak et al. (2000) is defined as the temperature at which the transition from the high- cubic to the orthorhombic structure occurs and thus it is related to the onset of orbital ordering. As seen in Fig. 4 (c), below K the 17O spectrum of Pr0.5Ca0.5MnO3 substantially broadens and splits into three lines as the temperature approaches . According to Ref. Yakubovskii et al., 2003, the low-frequency line is attributed to apical oxygens while the two other lines corresponding to the shift and are attributed to the oxygens located in -plane (O4- and O5-site, respectively). As said before, the magnetic shift of the apical line is greatly reduced due to the vanish of the local field. The NMR signal of the apical oxygen appears at a characteristic temperature , below which AF spin correlations between -layers occur. It is not surprising that coincides with since the localization of the itinerant electrons at -orbitals should manifest itself both in the appearance of AF spin correlations between -layers and in the cooperative Jahn-Teller distortions in the MnO6-octahedra sublattice.
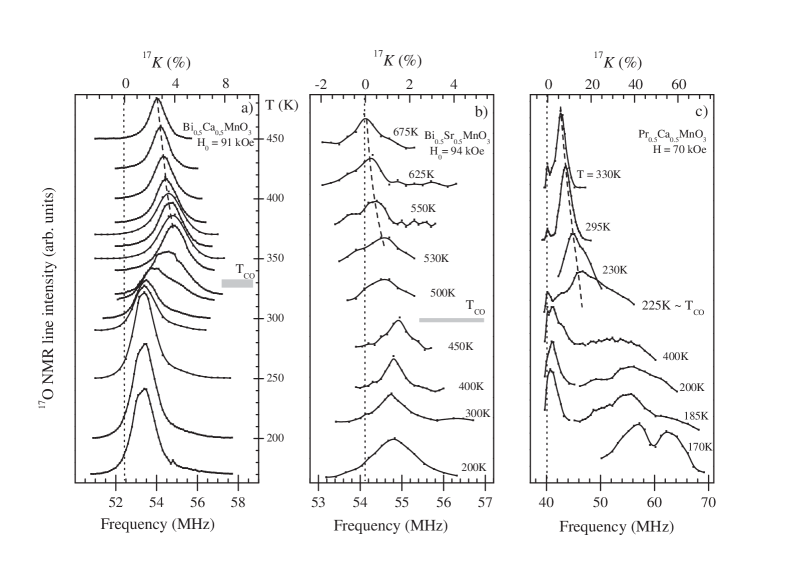
For Bi0.5Ca0.5MnO3, the 17O NMR spectra drastically change below , indicated by the narrow grey stripe in Fig. 4 (a). Moreover, the line shape shown in Fig. 5 becomes extremely sensitive to - the time delay between the -exciting pulses. The solid curve shows the echo intensity frequency () measured at short time delay = 12 s, while the open squares indicate the echo intensity observed at large delay, =100 s. By measuring the rate of the echo decay () at several representative points of the spectrum, we have reconstructed the high-frequency part of the spin-echo spectrum at = 0 (solid squares), its intensity being the difference between the spectra measured with = 12 s and 100 s. It worth noting that, (Fig. 5) is consistent with K (Ref. Bokov et al., 1967) defined as the temperature of the cubic-to-orthorhombic structural transition. With further decrease of temperature a substantial part of the high-frequency tail becomes undetectable due to a too small value of ( 5 s). Although only Bi0.5Ca0.5MnO3 is shown in Fig. 5, a very similar effect on the high-frequency tail of the 17O spin-echo spectrum occurs in the CO-phase of Bi0.5Sr0.5MnO3 below .
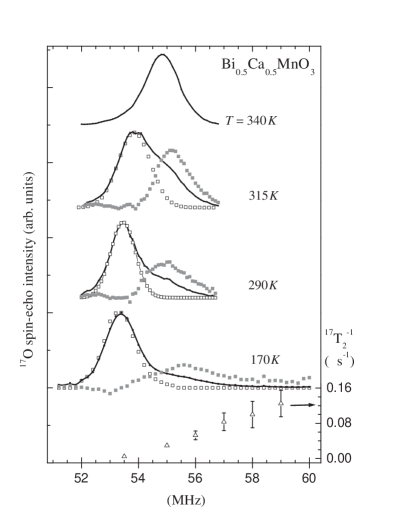
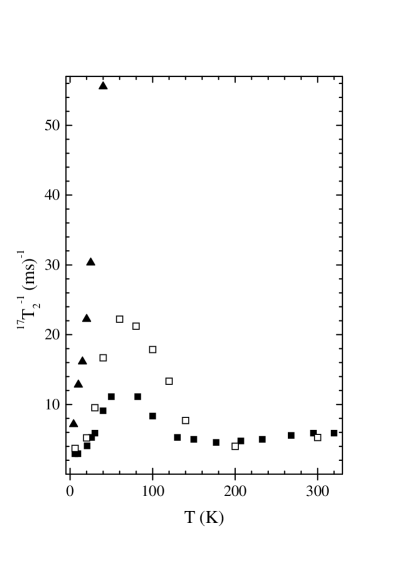
In order to understand why in contrast to Pr0.5Ca0.5MnO3 below , the high-frequency part of the spectrum in Bi0.5Ca0.5MnO3 and Bi0.5Sr0.5MnO3 is difficult to be detected, we have studied thermal behaviour in both CO phases, paramagnetic and antiferromagnetic. , measured in Bi0.5Ca0.5MnO3 on the low frequency peak of the ZF NMR spectrum (O4 site, = 30 MHz; see Fig. 3 b) is shown by up-triangles in Fig. 6. It evidences a divergent increase with temperature. The data set shown by the closed and open squares correspond to measured on the apical line in Bi0.5Sr0.5MnO3 and in Bi0.5Ca0.5MnO3 respectively. For the apical line there is also an enhancement of which occurs in the same temperature range for both Bi-based compounds. Furthermore, though weaker, this enhancement occurs in the same temperature range as for O4 site. The detailed study of the Mn-spin fluctuation probed by will be discussed elsewhere. Here we just point out the which is more than one order of magnitude shorter than in Pr0.5Ca0.5MnO3 and thus the difference in the Mn spin fluctuation in the Bi-based manganites compared to Pr0.5Ca0.5MnO3.
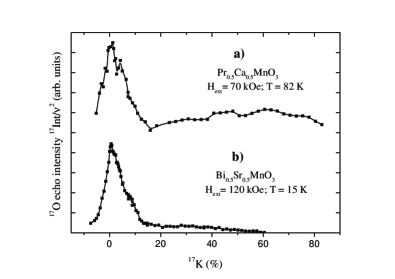
The thermal behaviour of explains why in the Bi-based compounds the high frequency lines corresponding to O4 and O5, which are not detected in the PM CO phase ( 100 ms-1), are well observed at very low temperature. Indeed, they appear at = 4.2 K as a two-peaked spectrum in zero field NMR (Figs. 3 b; 3 c) and as a very broad high-frequency tail at = 15 K for the 17O NMR spectrum measured at 12 T as shown in Fig. 7 for Bi0.5Sr0.5MnO3.
III.4 17O NMR in the antiferromagnetic charge-ordered state
In this section we consider the peculiarities in the 17O NMR spectrum measured in the antiferromagnetic charge-ordered state of Bi0.5Sr0.5MnO3 far below the Neel temperature, when the development of the static spin correlations is completed. We show that our analysis of the spectrum yields some constrains for the theoretical model of the CO phase in manganites.
The 17O NMR spectra of Pr0.5Ca0.5MnO3 and Bi0.5Sr0.5MnO3 are shown in Figure 7. The intensity is a result of two corrections. First, the intensity being related to the value at a given frequency, the spectra were recalculated for a time delay = 0, between exciting -pulses. Second, the spectral intensity is proportional to the intensity of the echo signal, 17Int, normalized by the factor at each frequency point of the spectrum. Thus, it yields directly the fraction of oxygen at (O1-O5) sites, which contributes to the echo-signal at a given frequency point .
For Pr0.5Ca0.5MnO3 the spectrum was measured in the same magnetic field of 70 kOe as in the CO paramagnetic phase shown in Fig. 4 c. The narrow line-A is due to oxygen in the apical (O1-O3) sites, while the broad line-(B+C) originates from oxygen in the -plane (O4-O5 sites). The unresolved pattern of this line is a result of additional magnetic broadening below K. The ratio of the integral NMR line intensities is very close to the structural ratio of the oxygen atoms occupying the apical sites and those placed in the -plane.
It is worth emphasizing that this estimate of allows the scenario of the site-centered CE-type charge ordering which develops in Pr0.5Ca0.5MnO3 among the ions of different valence (Mn3.5+δ/Mn3.5-δ). Wollan and Koeler (1955); Jirak et al. (1985); Efremov et al. (2003) Indeed, such a value is expected only for the magnetic structure of the conventional CE-type, i.e., in the ionic model.
Let us address now to the 17O NMR spectrum of Bi0.5Sr0.5MnO3 measured at 120 kOe and 15 K . The essential feature of the spectrum is that the gravity center of the broad high-frequency line is substantially shifted towards smaller , compared with the rather well resolved spectrum of Pr0.5Ca0.5MnO3. The integral intensity of line-A is approximately twice as larger as that of the broad line integrated in the range of above . The corresponding ratio is a clear indication that in the CO state of Bi0.5Sr0.5MnO3 a sizeable fraction of oxygen located in the -plane experiences a reduced local field. The reduction of this local field is mainly controlled by the occupancy of the (Mn) orbital. The inequality is expected for the bond-centered models of CO suggested for half doped manganites. Daoud-Aladine et al. (2002); Efremov et al. (2003, 2004) In these OO models there is a reduction of at some oxygen sites in the -plane. As an example, for the Zener polaron state, Daoud-Aladine et al. (2002) the local field should vanish at the oxygen atom located between the AF-correlated adjacent dimers of Mn3.5+. Thus, we incline to consider the (Mn) orbital ordering in the CO state of Bi0.5Sr0.5MnO3 in the frame of the CO bond-centered models. It’s worth noting that for the CE′-type magnetic structure, the Mn magnetic moments do not lie in the -plane and the -component . In the CE′-type structure, the conventional theoretical treatment of the OO order in the frame of 2D-models is not appropriate approach to consider in join the -orbital and spin order, observed in Bi0.5Sr0.5MnO3 at low .222For the CE′ magnetic structure of the Mn3+/4+ ions ordered in the ab-plane like a checkerboard (see Fig. 2 a in Ref. Frontera et al., 2001) one might expect , since an apical oxygen surrounded by Mn3+ ions (see Fig. 1 c) experiences the local field not cancelled along -axis. It should be required to involve the interplane couplings into consideration.
IV CONCLUSION
We have studied the development of the Mn electron spin correlations in two half-doped Bi-based manganites Bi0.5Sr0.5MnO3 and Bi0.5Ca0.5MnO3 in going from the charge-disorder paramagnetic phase to the charge-ordered antiferromagnetic phase and compared it to Pr0.5Ca0.5MnO3.
In the Bi-based manganites, the ZF NMR results show that the unusually large local magnetic field strongly favors the dominant character of the lone electron pair located at the Bi3+-ions in both compounds. The mechanism which connects the character of the lone pairs of Bi3+ to the high value of is still not clarified.
Compared to Bi0.5Sr0.5MnO3 the small decrease of in Bi0.5Ca0.5MnO3 is attributed to a slight difference in the magnetic structure of the CE′-type spin order presumed for both manganites rather than to a change of the wave character of the lone electron pair as it was suggested for Ca-doped oxide in Ref. Garcia-Munoz et al., 2001. Our 17O and 209Bi ZF NMR data show that, more probably, the difference in the observed is due to a decrease in the canting of the staggered magnetic moments of Mn3+-ions in Bi0.5Ca0.5MnO3 compared to Bi0.5Sr0.5MnO3. For Bi0.5Ca0.5MnO3 it would be interesting to compare the distribution of staggered magnetization deduced from NMR data with neutron diffraction data that are still not available. It would help us to make more definite conclusion on the role of the stereoactivity of the Bi3+ lone electron pair in the high value of of the Bi1-xSrxMnO3 () manganites.
Comparing the evolution of 17O NMR spectra from CD to CO PM state, we have demonstrated the qualitative modification of the spectra at the temperature of order-disorder transition, below which the localization of itinerant -electrons manifests itself in two specific phenomena, namely, the appearance of interlayer AF spin correlations and the cooperative Jahn-Teller distortions in the MnO6-octahedra sublattice. Indeed, this is well demonstrated by the proximity of , below which AF interlayer spin correlations occur, to , at which structural changes occur. This 17O NMR study demonstrates that the line corresponding to the apical oxygens is a unique local tool to study the development of the interlayer Mn-Mn spin correlations. Indeed for all three manganites this line occurs as soon as the charge-ordered phase develops on decreasing the temperature below . It also could be a useful local probe to study the influence of a magnetic field or an external pressure on the phase diagram.
In the CO state, is much shorter in the high frequency part of the spectrum, which corresponds to oxygens in the -plane in both Bi-manganites, compared to Pr0.5Ca0.5MnO3. This great increase of the rate of the 17O spin-echo decay can be interpreted in the following way. The time-dependent fluctuations of the local field can greatly increase the spin-spin relaxation rates of these oxygens. The effect becomes important when the characteristic correlation time of the Mn electron spin fluctuations is comparable to , where is the Larmor precession of the 17O nuclear spin in the magnetic field. The maximum of is expected near . Thus, compared with the spin fluctuation spectrum for the CE-ordered Pr0.5Ca0.5MnO3, in Bi-compounds the spectral intensity of the Mn electron spin fluctuations is shifted to low frequencies, comparable to .
It is shown on an example of Pr0.5Ca0.5MnO3 and Bi0.5Sr0.5MnO3, that the analysis of the 17O spectrum imposes some constraints for the theoretical description of the charge ordered phase in the AF state of manganites. In this analysis the relative intensity of the low and high frequency 17O lines is calculated and compared to the site-centered and bond-centered models. As the result the fine structure of the 17O spectrum in Pr0.5Ca0.5MnO3 is well consistent with predictions of the site-centered model of CO among the ions (Mn3.5+δ/Mn3.5-δ). While 17O NMR analysis of the Mn-Mn spin correlations developed in the AF state of Bi0.5Sr0.5MnO3 indicates on the bond-centered models of CO as the more appropriate approach for the Bi-based manganite.
Acknowledgements.
We are very grateful to Dr. A.Inyushkin for 17O isotope enrichment. The work is supported partly by Russian Foundation for Basic Research (Grants 02-02-16357a) as well as by CRDF PR 2355.References
- Kajimoto et al. (1998) R. Kajimoto, T. Kakeshita, Y. Oohara, H. Yoshizawa, Y. Tomioka, and Y. Tokura, Phys.Rev. B 58, R11837 (1998).
- Liu et al. (1998) H. L. Liu, S. L. Cooper, and S.-W. Cheong, Phys. Rev. Letters 81, 4684 (1998).
- Yakubovskii et al. (2003) A. Yakubovskii, A. Trokiner, S. Verkhovskii, A. Gerashenko, and D. Khomskii, Phys.Rev. B 67, 064414 (2003).
- Zener (1951) C. Zener, Phys.Rev. 82, 403 (1951).
- Bokov et al. (1967) V. Bokov, N. Grigoryan, and M. Bryzhina, Phys. Status Solidi 20, 745 (1967).
- Garcia-Munoz et al. (2001) J. Garcia-Munoz, C. Frontera, M. Aranda, A. Llobet, and C. Ritter, Phys.Rev. B 63, 064415 (2001).
- Beran et al. (2002) P. Beran, S. Malo, C. Martin, A. Maignan, M. Nevriva, M. Hervieu, and B. Raveau, Solid State Sci. 4, 917 (2002).
- Frontera et al. (2003) A. Frontera, J. Garcia-Munoz, M. Aranda, M. Hervieu, C. Ritter, L. Manosa, X. Capdevila, and A.Galleja, Phys. Rev. B 68, 134408 (2003).
- Hejtmanek et al. (2003) J. Hejtmanek, K. Knizek, Z. Jirak, M. Hervieu, C. Martin, M. Nevriva, and P. Beran, J. Appl. Phys. 93, 7370 (2003).
- Frontera et al. (2001) C. Frontera, J. Garcia-Munoz, M. Aranda, C. Ritter, A. Llobet, M. Respaud, and J. Vanacken, Phys.Rev. B 64, 054401 (2001).
- Jirak et al. (2000) Z. Jirak, F. Damay, M. Hervieu, C. Martin, B. Raveau, G. Andre, and F.Bouree, Phys.Rev. B 61, 1181 (2000). 61, 1181 (2000).
- Wollan and Koeler (1955) E. Wollan and W. Koeler, Phys.Rev. 100, 543 (1955).
- Jirak et al. (1985) Z. Jirak, S. Krupicka, Z. Simsa, M. Dlouha, and Z. Vratislav, J. Magn. Magn. Mater. 53, 153 (1985).
- Efremov et al. (2003) D. Efremov, J. van den Brink, and D. Khomskii, cond-mat/0306651 (2003).
- Daoud-Aladine et al. (2002) A. Daoud-Aladine, J. Rodriguez-Carvajal, L. Pinsard-Gaudart, M. Fernandez-Diaz, and A. Revcolevschi, Phys. Rev. Letters 89, 97205 (2002).
- Efremov et al. (2004) D. Efremov, J. van den Brink, and D. Khomskii, Nature: materials 3, 853 (2004).
- Kumagai et al. (1999) K. Kumagai, A. Iwai, Y. Tomioka, H. Kuwahara, Y. Tokura, and A.Yakubovskii, Phys. Rev. B 59, 9 (1999).
- Yoshinari et al. (1999) Y. Yoshinari, P. Hammel, J. Tompson, and S.-W. Cheong, Phys. Rev. B 60, 9275 (1999).
- Allodi et al. (1998) G. Allodi, R. D. Renzi, F. Licci, and M. W. Pieper, Phys. Rev. Letters 81, 4736 (1998).
- Carter et al. (1977) G. Carter, L. Bennett, and D. Kahan, Metallic Shifts in NMR, in Progress in Material Science, edited by B. Chalmers, J.W. Christian, T.B. Massalski (Pergamon Press, Oxford, 1977), p. 33.
- Fraga et al. (1976) S. Fraga, J. Karwowski, and K. Saxena, Handbook of Atomic Data (Elsevier Scientific Pub., Amsterdam, 1976).
- Shulman and Jaccarino (1957) R. Shulman and V. Jaccarino, Phys. Rev. 108, 1219 (1957).
- Tomioka et al. (1996) Y. Tomioka, A. Asamitsu, H. Kuwahara, Y. Morimoto, and Y. Tokura, Phys.Rev. B 53, R1689 (1996).
- A.Kirste et al. (2003) A.Kirste, M. Goiran, M. Respaud, J. Vanaken, J. M. Broto, H. Rakoto, M. von Ortenberg, C. Frontera, , and J. L. Garcia-Munoz, Phys. Rev. B 67, 134413 (2003).