Signatures of Spin Glass Freezing in NiO Nanoparticles
Abstract
We present a detailed study of the magnetic properties of sol-gel prepared nickel oxide nanoparticles of different sizes. We report various measurements such as frequency, field and temperature dependence of ac susceptibility, temperature and field dependence of dc magnetization and time decay of thermoremanent magnetization. Our results and analysis show that the system behaves as a spin glass.
pacs:
61.46.+w, 75.20.-g, 75.50.Ee, 75.50.Tt, 75.50.Lk, 75.75.+aI Introduction
For the past few decades magnetic nanoparticles have been attracting the attention of scientists from diverse disciplines from the standpoints of both fundamental understanding and useful applications Chantrell . Magnetic nanoparticles have been under scrutiny since the days of Néel Neel and Brown Brown who developed the theory of magnetization relaxation for noninteracting single domain particles. Effect of inter-particle interaction on magnetic properties of several nanoparticle systems are available in the literature Andersson . In 1961 Néel suggested that small particles of an antiferromagnetic material should exhibit superparamagnetism and weak ferromagnetism Low Temp. Phys. . Antiferromagnetic nanoparticles are known to show more interesting behavior compared to ferro and ferrimagnetic nanoparticles one of which is that the magnetic moment of tiny antiferromagnetic particles increases with increasing temperature Seehra 2000 ; Harris ; Kilcoyne ; Makhlouf . This is quite unlike what is seen in ferro and ferrimagnetic particles. Real magnetic nanoparticles have disordered arrangement, distribution in size and random orientation of magnetization, making their behavior very complex and challenging to understand.
Bulk NiO has a rhombohedral structure and is antiferromagnetic below 523 K whereas it has a cubic structure and is paramagnetic above that temperature Smart . A bulk antiferromagnet has zero net magnetic moment in zero applied field. If the surface to volume ratio, which varies as the reciprocal of the particle size, for an antiferromagnetic particle becomes sufficiently large then the particle can have a nonzero net magnetic moment because of uncompensated spins at the surface. According to Néel the moment due to uncompensated spins would be parallel to the axis of antiferromagnetic alignment. If we consider a collection of such particles of varying sizes and shapes we will see that there will be a distribution of magnetic moments of different sizes, oriented randomly and interacting with each other magnetically. Thus the magnetic properties of a collection of such particles would be very different from that of the corresponding bulk material. Richardson and Milligan Richardson and Milligan were the first to report magnetic susceptibility measurements as a function of temperature for NiO nanoparticles of different sizes. They measured the magnetic susceptibility at a field of 3500 G and found a peak in the susceptibility much below the Néel temperature and the peak temperature was found to decrease with decreasing particle size. They attributed the observed behavior to the modified magnetic environment of the Ni2+ ions at the surface of the particles and the enhanced surface to volume ratio.
In this paper we present a detailed study on NiO nanoparticles based mainly on magnetic measurements. In the course of this work we will come across phenomena which indicate that a collection of NiO nanoparticles behaves as a spin glass or a superparamagnet. In each of those cases we shall try to critically examine the data in the light of current understanding of the physics involved.
II Experimental Details
NiO nanoparticles are prepared by a sol-gel method by reacting in aqueous solution, at room temperature, nickel nitrate and sodium hydroxide at pH = 12 as described elsewhere Richardson and Milligan ; Makhlouf 1997 ; Richardson 1991 . In this work we used nickel (II) nitrate hexahydrate (99.999%), sodium hydroxide pellets (99.99%), both from Aldrich, and triple distilled water to make nickel hydroxide. The samples of nickel oxide nanoparticles are prepared by heating the nickel hydroxide at a few selected temperatures for 3 hours in flowing helium gas (99.995%). All the magnetic measurements are done with a SQUID magnetometer (Quantum Design, MPMS XL).
III Experimental Results and Discussion
III.1 Crystallite sizes
The average crystallite size is calculated by X-ray diffraction line broadening using the Scherrer formula Scherrer
| (1) |
where is the wavelength of the X-ray (1.542 Å), 2 is the Bragg angle, is the full width at half maximum (FWHM) of a peak in radians and is the FWHM of the same peak of a standard sample. We used specpure grade NiO powder from Johnson Matthey & Co. Ltd. (UK) as the standard. Peaks (111) , (200) and (220) are used to calculate the average crystallite size. The use of instead of in the Scherrer formula takes care of instrumental broadening. The crystallite sizes of NiO samples prepared by heating Ni(OH)2 at 250, 300, 350 and 700 ∘C turn out to be 5.1, 6.2, 8.5 and nm respectively and these numbers will be referred to as the average crystallite size in this paper. Transmission electron micrograph of NiO sample prepared by heating Ni(OH)2 at 250 ∘C gives mean particle size to be 5.6 nm with a standard deviation of 1.3 nm. We note that the mean particle size determined by transmission electron micrograph is very close to the average crystallite size determined by X-ray diffraction using the Scherrer formula (5.1 nm) which implies that on an average each NiO nanoparticle is a crystallite (tiny single crystal). More details of sample characterization like X-ray diffraction pattern, transmission electron micrograph, selected area electron diffraction pattern and particle size distribution are available elsewhere arxiv .
III.2 ac Susceptibility
III.2.1 Temperature and Frequency Dependence
The temperature dependence of ac susceptibility is measured at several frequencies ranging from 1 Hz to 1 kHz. The data are taken as described below. The sample is first cooled from room temperature to 10 K in a zero magnetic field. Then a probing ac magnetic field of 1.0 G amplitude is applied to measure the susceptibility as the temperature is slowly raised in short steps to 300 K. Figure 1 shows the real part, , of the susceptibility of the 5.1 nm sample; in the inset we show the imaginary part, . We note that all the curves have a peak at some temperature; as the frequency is raised the value of decreases and the temperature of the peak increases. The behavior observed here is characteristic of both superparamagnets and spin glasses. The cusp in the susceptibility seen in canonical spin glasses is not observed here. The inset shows that below the peak temperature, does not depend on frequency. Such frequency independent has been observed in other nanoparticle systems as wellJonsson .
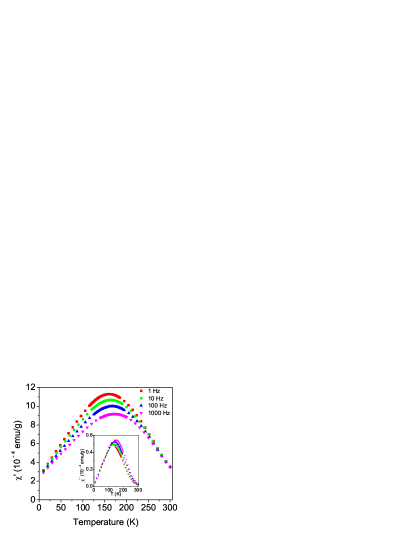
A quantitative measure of the peak temperature shift with frequency is the relative shift in peak temperature, , per decade of frequency. For the 5.1 nm sample this quantity turns out to be 0.018. For many canonical spin glasses it lies between 0.0045 and 0.06 whereas for a known superparamagnet a-(Ho2O3)(B2O3) a value of 0.28 has been reported Mydosh . Ferritin, an antiferromagnetic nanoparticle, which has been found to be superparamagnetic, has a value of for this quantityKilcoyne . We note that our value of 0.018 falls in the spin glass range.
Small particles of antiferromagnetic materials are expected to be superparamagnetic just as small particles of ferro or ferrimagnetic materials. That is, each particle would behave as a single giant moment and their magnetic susceptibility as a function of temperature would be Curie-like at sufficiently high temperature. The giant moment arises because of uncompensated spins at the surface of the particle. An antiferromagnetic particle with uni-axial anisotropy has two low energy states, separated by an energy barrier , corresponding to the parallel or anti parallel alignment of the magnetization of the particle with the axis of antiferromagnetic alignmentBean . The susceptibility has a maximum at a certain temperature called the blocking temperature, below which the probability of thermally assisted transitions between the two low energy states decreases progressively towards zero. The blocking temperature, , should increase with increasing particle size because the energy barrier separating the low energy states is proportional to the volume of the particle. In fact
| (2) |
where is the volume of a single particle, is a constant and is the field of measurementBitoh .
The dynamics of superparamagnets is described by Arrhenius law
| (3) |
where is the energy barrier for flipping the magnetic moment of the particle and , an attempt frequency, usually has a value in the range to Hz and is related to the intra-potential-well dynamicsLabarta ; Morup 1995 . If we fit the data shown in Figure 1 to the Arrhenius equation, where corresponds to the peak in the susceptibility curve taken at frequency , we get K and Hz; these numbers are too large and rather unphysical. Unreasonable numbers like these are usually seen in spin glass systemsMydosh while superparamagnets tend to give more reasonable numbers such as K and Hz for ferritinKilcoyne . Here we have another indication that the NiO particles are not behaving like a superparamagnetic system in the region of temperature where they have a susceptibility peak. This fact and the previously noted peak temperature shift with frequency suggest that the maximum in the ac susceptibility curve might have its origin in spin glass like freezing rather than superparamagnetic blocking.
III.2.2 Particle Size Dependence
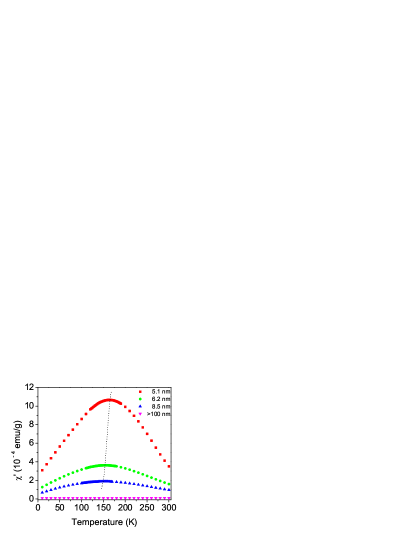
In Figure 2 we compare for 5.1, 6.2, 8.5 and 100 nm samples at 10 Hz. It is clear that the temperature of the peak decreases with increasing particle size. This behavior is quite contrary to what is expected in superparamagnetic systems as described by Equation 2 where volume of particle. We see that just as the frequency dependence of the peak temperature was unlike that of a superparamagnet, its size or volume dependence is also unlike that of a superparamagnet. In this paper we make an attempt to understand this non-intuitive behavior of NiO nanoparticles.
We also note from Figure 2 that the magnitude of the susceptibility increases with decreasing particle size. This is as one would expect since the relative number of surface spins and hence the number of uncompensated surface spins would increase with decreasing particle size. Our data is in qualitative agreement with the claim that in NiO nanoparticles susceptibility at room temperature varies as where is the particle diameterRichardson 1991 . Owing to the too few number of data points in our data set we are not able to make any quantitative claim.
III.2.3 Magnetic Field Dependence
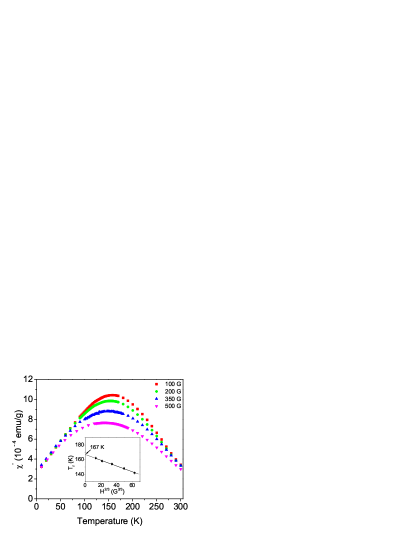
We measured the susceptibility at various bias fields with an field of 1 G amplitude and 10 Hz frequency. This is shown in Figure 3. As increases, the peak temperature and peak value decreases. We note that the peak temperature, , decreases as, , as shown in the inset of Figure 3. This dependence corresponds to the so called de Almeida-Thouless (AT) line AT given by:
| (4) |
The extrapolation of the AT line back to gives the spin glass transition temperature which, in this case, turns out to be about 167 K. Compliance of the data with the AT line is considered to be a strong evidence for the existence of a spin glass phase and it has been observed in different kinds of spin glasses Chamberlin 1982 . Recently, it has been used as an evidence for spin glass phase in nanoparticles Martinez as well as in thin films Dhar .
III.3 dc Magnetization
III.3.1 Temperature Dependence
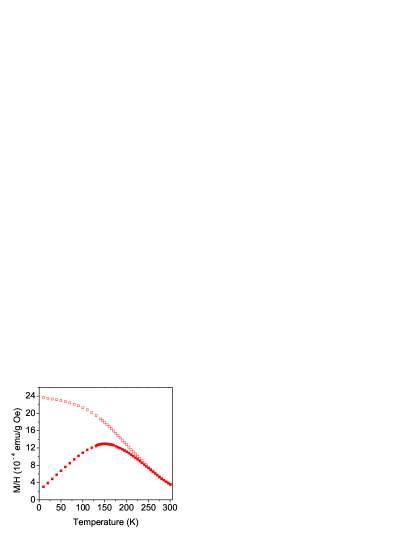
Figure 4 shows the temperature dependence of zero field cooled (ZFC) and field cooled (FC) magnetization in a 100 G field for the 5.1 nm particles. Generally, the ZFC susceptibility shows a peak for both superparamagnets and spin glasses. In contrast, it is usually seen that the temperature dependence of the FC susceptibility becomes saturated below the peak temperature (freezing temperature ) for spin glasses and continues to increase below that temperature (blocking temperature ) for superparamagnets Bitoh . Nevertheless, we note that, glassy behavior in magnetic nanoparticles has also been claimed in which the FC susceptibility continues to increase with decreasing temperature Luo . In our case, below the peak temperature, the susceptibility continues to increase but with a tendency towards saturation. This behavior is rather ambiguous.
III.3.2 Particle Size Dependence
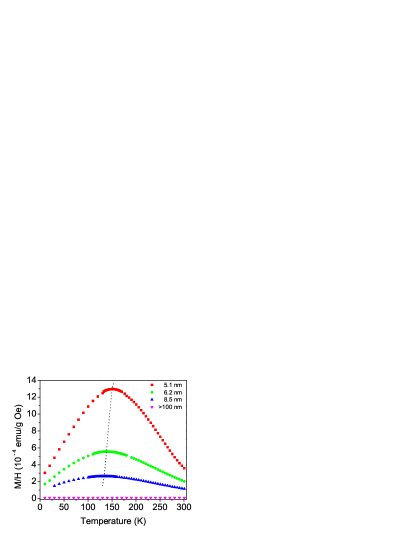
Figure 5 shows our data on the temperature dependence of ZFC magnetization as a function of particle size in an applied field of 100 G. Clearly the peak temperature decreases with increasing particle size, as has been seen in ac susceptibility measurements in Section III.2.2 earlier. Again, we notice the non-superparamagnetic behavior. A similar observation has been reported recently for MnO nanoparticles where the temperature of the peak in susceptibility in a zero field cooled measurement decreases with increasing particle size Seo .
The behavior we see here at 100 G field does not agree with the observations reported by Richardson and MilliganRichardson and Milligan on NiO where they found that at 3500 G the peak temperature in dc susceptibility increases with increasing particle size, as already mentioned in the Introduction. We did susceptibility measurement at 3500 G and found that we are able to reproducearxiv the data of Richardson and Milligan. We shall see later in Section III.4 that these two conflicting observations are actually consistent with each other.
III.3.3 Field Dependence
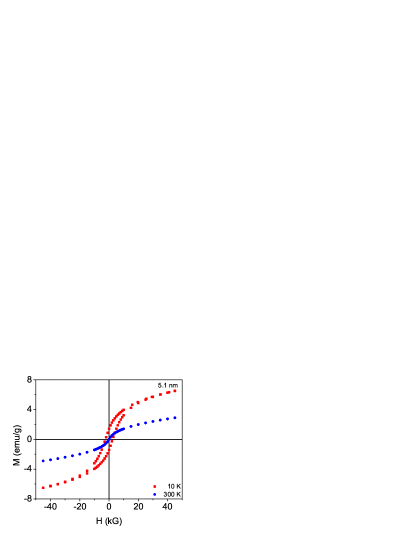
In Figure 6 we show the M-H curves obtained from dc magnetization measurements at 10 K and 300 K for the 5.1 nm particles. Hysteresis loop is seen in the 10 K data. The hysteresis could be an indication of the weak ferromagnetism alluded to by Néel in his musings on antiferromagnetic particles Low Temp. Phys. ; or it could be because the magnetization is time dependent and is relaxing too slowly for the experimental time scale of a few hours. We shall soon see that our data support the latter proposition. At 300 K there is no coercive force and no hysteresis. We carried out a few more vs. measurements at different temperatures up to 350 K and found that the magnetization is not a function of as one would expect for superparamagnetic systems. Similar behavior has been reported by others also on NiO nanoparticles Makhlouf 1997 .
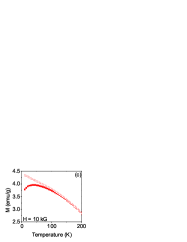
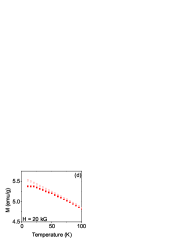
In Figure 7 we show the ZFC and FC magnetization curves for the 5.1 nm sample at various applied fields. As the measuring field increases we find that both the bifurcation temperature of ZFC and FC curves and the peak temperature of ZFC curve shift to low temperature. In fact, at 20 kG the ZFC curve does not peak even on going down to 10 K. This behavior is along expected lines since we would expect in a sufficiently high external magnetic field the spin glass freezing will either take place at a lower temperature or not at all as a sufficiently strong external magnetic field can break the spin glass phase.
III.3.4 Time Dependence
Thermoremanent magnetization (TRM) is the time dependent remanent magnetization obtained when a sample is cooled from a temperature well above to a temperature below in an applied field and subsequently the field is removed. In this work, to measure the TRM, we cool the sample from 300 K to the temperature of interest in a 100 G magnetic field.
A spin glass system is not in thermal equilibrium and slowly relaxes to lower energy states. Many models have been proposed to describe the time dependent relaxation of magnetization in spin glasses. A single energy barrier should give an exponentially relaxing TRM, with time constant , ie., . In a real system there would be a range of energy barriers and hence there would be a distribution of relaxation times. One of the popular forms incorporating a distribution of relaxation times is the stretched exponential function: Hoogerbeets ; Chamberlin
| (5) |
where is a characteristic relaxation time and and are fit parameters.
By assuming that the energy barriers are uniformly distributed from zero to some maximum energy, it has been shown that the magnetization decays logarithmically Guy as
| (6) |
where and are fit parameters. It should be noted that is the magnetization at unit and hence it depends on the unit of time used, while itself does not have any such dependence.
| (7) |
where the exponent should increase with increasing temperature. In this case also, as in the previous equation, depends on the unit of time.
A statistical measure of the goodness of a fit is , defined as Press
| (8) |
where N is the total number of data points and is the standard deviation of the data point. For a good fit should have a value close to N. We shall also be reporting the coefficient of determination for our fits; the closer is to unity the better the fit.
We fitted our data to the Equations (5), (6) and (7). To compare the fits for the different forms we present the values of and for a representative data set, the 100 K TRM data for 5.1 nm particles, in Table 1. We note that the stretched exponential gives the best fit with the lowest and largest . This is followed by the logarithmic form with the power law form bringing up the rear. To check whether the fit parameters truly characterize the data we decided to run the fits on subsets of the original data covering different time spans such as (150 s, 1000 s), (150 s, 2000 s), (150 s, 3000 s) and so on. The fit parameters are found to be strongly dependent on the time span of the data for the stretched exponential case but are found to be almost independent of the same for logarithmic and power law cases. Consequently the stretched exponential fit has to be rejected on the grounds that the fit parameters in that case are simply artifacts of the subset of the data used, even though it has the best and values.
| Fit Expression | ||
|---|---|---|
| 810 | 0.9998 | |
| 1008 | 0.9997 | |
| 2547 | 0.9992 |
| T | ||||
|---|---|---|---|---|
| (K) | (emu/g) | (emu/g) | ||
| 25 | 20.7 | 2.94 | 1219 | 0.9898 |
| 50 | 17.7 | 4.46 | 993 | 0.9979 |
| 75 | 14.7 | 6.20 | 1500 | 0.9991 |
| 100 | 11.9 | 7.06 | 1008 | 0.9997 |
| 125 | 8.34 | 6.29 | 2996 | 0.9995 |
| 150 | 5.54 | 5.02 | 1259 | 0.9998 |
| 175 | 3.32 | 3.56 | 10170 | 0.9993 |
| 200 | 1.73 | 2.32 | 32400 | 0.9991 |
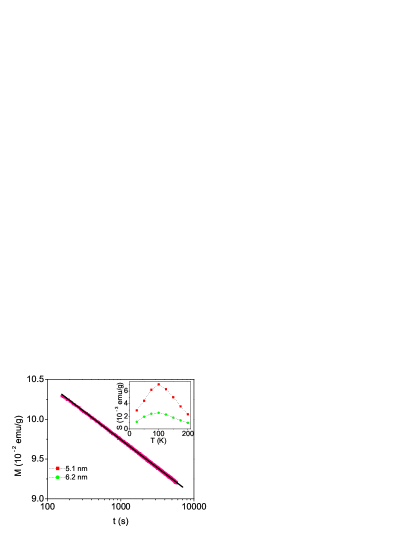
Now we are left with the logarithmic and power law forms of which the logarithmic form has the better and . We found that Equation (6) gives the best fit not only at 100 K, but at all the other temperatures as well. We conclude that the best fit to our TRM data is given by this equation. This equation has been popularly used to describe the time dependence of TRM of various spin glass systems including bulk materials Guy ; Chun , nanoparticles Luo and thin films Dhar . In Table 2 we present the results of fitting the TRM data to the logarithmic form. We see that the is of the order of and the in most of the cases which reflect the high quality of the fits. It can be seen from the table that as the temperature increases the parameter decreases monotonically as is to be expected. In Figure 8 we show the thermoremanent magnetization of the 5.1 nm particles at 100 K along with the logarithmic fit. The solid line through the data points is the fit and we note that it is excellent. In the inset we plot the fit parameter , which characterizes the relaxation rate, as a function of temperature for the 5.1 nm and 6.2 nm particles. We see that peaks around 100 K for both samples. Peaks in vs. curves have been seen in other spin glass systems alsoGuy ; Luo .
Effect of wait time dependence on TRM for spin glasses has been studied by several groups Chamberlin PRB ; Hoogerbeets ; Nordblad . It is generally observed that the rate of magnetization decay decreases with increasing wait time. We also studied the wait time dependence of decay of TRM at 100 K for the 5.1 nm system. For this the sample is cooled from 300 K to 100 K in a field of 100 G and then we wait for a time before the field is switched off and the data acquisition is started. In Table 3 we show the fit parameters to Equation (6). It is clear that there is a small decrease in the fit parameter for increasing wait time up to 1 hour which is consistent with other’s observations Chamberlin PRB ; Nordblad ; Lundgren .
| (minutes) | (emu/g) | (emu/g) | |
|---|---|---|---|
| 0 | 11.9 | 7.06 | 0.9997 |
| 15 | 11.8 | 6.99 | 0.9994 |
| 30 | 11.7 | 6.92 | 0.9994 |
| 60 | 11.7 | 6.91 | 0.9991 |
III.4 Further Discussion
In Sections III.2.2 and III.3.2 we saw that the peak temperature of the low field susceptibility as a function of temperature decreases with increasing particle size. We take this to mean that the behavior of the system is not superparamagnetic and the peaks the in low field susceptibility vs. temperature curves are not because of superparamagnetic blocking of particle magnetic moments. From Sections III.2.1, III.2.3 and III.3.4 it is clear that the system is showing spin glass behavior. Now the question is, what is the mechanism behind the spin glass freezing?
There are reports in the literature where dipolar interaction between particles has been proposed as the reason for the freezing of particle magnetic moments Morup 1995 ; Morup 1983 ; Luo . Now let us examine whether there is such a possibility in the case of NiO. We estimate that for the 5.1 nm particles there would be an average uncompensated moment of the order of Note1 . The maximum dipolar interaction energy between two such particles touching each other would be erg which corresponds to about 0.1 K on temperature scale. This means that if dipolar interaction were causing the freezing it would occur at about 0.1 K which is much lower than the observed freezing temperature of about 167 K (from susceptibility). Thus we rule out the possibility that dipolar interaction among particles is causing the peaks in low field susceptibility as a function of temperature.
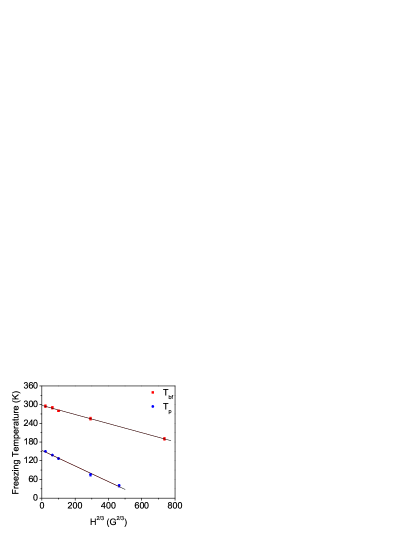
In canonical spin glasses the spin glass phase is very sensitive to external fields and the application of a field of a few hundred gauss breaks it and makes it disappear. But here it is not the case and the spin glass phase survives up to the highest field used to measure ZFC and FC magnetization (up to 20 kG in our study; see Figure 7). The existence of spin glass phase up to such high fields is also evident from the AT lines shown in Figure 9. Clearly the peak temperature of the susceptibility curve decreases with increasing applied field following the AT line. We also find that the rate of change with field of the peak temperature of the susceptibility curve decreases with increasing particle size (not shown here). To paraphrase, for smaller particles the changes more with field than for the larger particles. It is this which gives rise to and resolves the conflicting observations noted at the end of Section III.3.2.
Kodama et al. Kodama 1996 and Martínez et al. Martinez have argued that freezing of surface spins can lead to spin glass phase which survives up to such high fields. Kodama et al. Kodama 1996 have proposed a model for ferrimagnetic nickel ferrite nanoparticles where the spins at the surface of a particle are disordered, leading to frustration and spin glass like freezing. A similar model has also been proposed for antiferromagnetic ferrihydrite nanoparticles Seehra 2000 . We feel that such a model may be applicable in the case of NiO nanoparticles as well. We will first have to see whether we can propose any mechanism for surface spin disorder in our case. The exchange interaction between two neighboring Ni+2 ions is mediated by an oxygen ion (superexchange), and if an oxygen ion is missing from the surface, the exchange bond would be broken and the interaction energy would be reduced. Also, the average coordination number for Ni+2 ions at the surface will be less than that in the bulk and this can result in a distribution of exchange energies for the surface spins. Moreover, the superexchange is sensitive to bond angles and bond lengths, which are likely to be different at the surface compared to that in the bulk. The reasons mentioned above may be sufficient to give rise to surface spin disorder and frustration leading to a spin glass phase. The fraction of atoms lying on the surface of the particles increases with decreasing particle size. This may lead to increased surface spin disorder as the particle size decreases and could possibly account for the increasing freezing temperature with decreasing particle size.
IV Conclusion
In this paper we reported a detailed study on magnetic properties of sol-gel prepared NiO nanoparticles. The behavior of the system is not superparamagnetic as was expected. In fact it shows spin glass behavior which we attribute to surface spin disorder.
Acknowledgements.
We thank Profs. A. K. Majumdar, Avinash Singh and R. C. Budhani for helpful discussions.References
- (1) R. W. Chantrell and K. O’Grady, in Applied Magnetism, edited by R. Gerber et al. (Kluwer Academic Publishers, The Netherlands, 1994), p.113.
- (2) L. Néel, Ann. Geophys 5, 99 (1949).
- (3) W. F. Brown, Jr., Phys. Rev. 130, 1677 (1963).
- (4) J. O. Anderson, C. Djurberg, T. Jonsson, P. Svedlindh, and P. Nordblad, Phys. Rev. B 56, 13983 (1997); C. Djurberg, P. Svedlindh, P. Nordblad, M. F. Hasen, F. Bødker, and S. Mørup, Phys. Rev. Lett. 79, 5154 (1997); J. L. Dormann, D. Fiorani, R. Cherkaoui, E. Tronc, F. Lucari, F. D’Orazio, L. Spinu, M. Noguès, H. Kachkachi, and J. P. Jolivet, J. Magn. Magn. Mater. 203, 23 (1999); J. L. Dormann, D. Fiorani, R. Cherkaoui, L. Spinu, F. Lucari, F. D’Orazio, M. Noguès, E. Tronc, J. P. Jolivet, and A. Garcia, Nanostructured Materials 12, 757 (1999).
- (5) L. Néel, in Low Temperature Physics, edited by C. Dewitt et al. (Gordan and Beach, New York, 1962), p.413.
- (6) M. S. Seehra, V. S. Babu, A. Manivannan, and J. W. Lynn, Phys. Rev. B 61, 3513, (2000).
- (7) J. G. E. Harris, J. E. Grimaldi, D. D. Awschalom, A. Chiolero, and D. Loss, Phys. Rev. B 60, 3453 (1999); S. Mørup and C. Frandsen, Phys. Rev. Lett. 92, 217201 (2004).
- (8) S. H. Kilcoyne and R. Cywinski, J. Magn. Magn. Mater. 140-144, 1466 (1995).
- (9) S. A. Makhlouf, F. T. Parker, and A. E. Berkowitz, Phys. Rev. B 55, R14717 (1997).
- (10) J. S. Smart and S. Greenwald, Phys. Rev. 82, 113 (1951).
- (11) J. T. Richardson and W. O. Milligan, Phys. Rev. 102, 1289 (1956).
- (12) S. A. Makhlouf, F. T. Parker, F. E. Spada, and A. E. Berkowitz, J. Appl. Phys. 81, 5561 (1997).
- (13) J. T. Richardson, D. I. Yiagas, B. Turk, K. Foster, and M. V. Twigg, J. Appl. Phys. 70, 6977 (1991).
- (14) B. D. Cullity, Elements of X-Ray Diffraction (Addison-Wesley Publishing Company, Inc., 1956), p.99 & 262.
- (15) S. D. Tiwari and K. P. Rajeev, www.arXiv.org/cond-mat/0408427 (2004).
- (16) T. Jonsson, P. Nordblad, and P. Svedlindh, Phys. Rev. B 57, 497 (1998).
- (17) J. A. Mydosh, Spin Glass (Taylor & Francis, 1993), p.65-67.
- (18) I. S. Jacobs and C. P. Bean, in Magnetism,Vol.III edited by G. T. Rado and H. Suhl (Academic Press Inc., New York, 1963), p.271.
- (19) T. Bitoh, K. Ohba, M. Takamatsu, T. Shirane, and S. Chikazawa, J. Phys. Soc. Jpn. 64, 1305 (1995).
- (20) A. Labarta, O. Iglesias, Ll. Balcells, and F. Badia, Phys. Rev. B 48, 10240 (1993).
- (21) S. Mørup, F. Bødker, P. V. Hendriksen, and S. Linderoth, Phys. Rev. B 52, 287 (1995).
- (22) J. R. L. de Almeida and D. J. Thouless, J. Phys. A 11, 983 (1978).
- (23) See for instance: R. V. Chamberlin, M. Hardiman, L. A. Turkevich, and R. Orbach, Phys. Rev. B 25, 6720 (1982); P. Monod and H. Bouchiat, J. Phys. (Paris) Lett. 43, 145 (1982).
- (24) B. Martínez, X. Obradors, Ll. Balcells, A. Rouanet, and C. Monty, Phys. Rev. Lett. 80, 181 (1998).
- (25) S. Dhar, O. Brandt, A. Trampert, K. J. Friedland, Y. J. Sun, and K. H. Ploog, Phys. Rev. B 67, 165205 (2003).
- (26) W. Luo, S. R. Nagel, T. F. Rosenbaum and R. E. Rosensweig, Phys. Rev. Lett. 67, 2721 (1991).
- (27) W. S. Seo, H. H. Jo, K. Lee, B. Kim, S. J. Oh, and J. T. Park, Angew. Chem. Int. Ed. 43, 1115 (2004).
- (28) R. Hoogerbeets, W. Luo, and R. Orbach, Phys. Rev. Lett. 55,111 (1985).
- (29) R. V. Chamberlin, G. Mozurkewich, and R. Orbach, Phys. Rev. Lett. 52, 867 (1984).
- (30) C. N. Guy, J. Phys. F: Metal Phys. 8, 1309 (1978).
- (31) G. Sinha, R. Chatterjee, M. Uehara and A. K. Majumdar, J. Magn.Magn.Mater. 164, 345 (1996).
- (32) R. S. Patel, D. Kumar, and A. K. Majumdar, Phys. Rev. B 66, 54408 (2002).
- (33) W. H. Press et al., Numerical Recipes in C (Cambridge University Press, 1992), p. 659.
- (34) S. H. Chun, Y. Lyanda-Geller, M. B. Salamon, R. Suryanarayanan, G. Dhalenne, and A. Revcolevschi, J. Appl. Phys. 90, 6307 (2001).
- (35) P. Nordblad, P. Svedlindh, L. Lundgren, and L. Sandlund, Phys. Rev. B 33, 645 (1996).
- (36) R. V. Chamberlin, Phys. Rev. B 30, 5393 (1984).
- (37) L. Lundgren, P. Svedlindh, P. Nordblad, O. Beckman, Phys. Rev. Lett. 51, 911 (1983).
- (38) S. Mørup, M. B. Madsen, J. Franck, J. Villadsen, and C. J. W. Koch, J. Magn. Magn. Mater. 40, 163 (1983); I. Tamura and M. Hayashi, J. Magn. Magn. Mater. 72, 285 (1988); D. H. Reich, B. Ellman, J. Yang, T. F. Rosenbaum, G. Aeppli, and D. P. Belanger, Phys. Rev. B 42, 4631 (1990).
- (39) It has been reported that 15 nm particles of NiO prepared by the same method as ours has a magnetic moment of [See R. H. Kodama, S. A. Makhlouf, and A. E. Berkowitz, Phys. Rev. Lett. 79, 1393 (1997)]. In the case of antiferromagnetic particles the moment where n should be a number between 1 and 2 (see ref. Low Temp. Phys. and Richardson 1991 ). Taking a value of , for the 5.1 nm sized particles, we estimate that, the moment should be .
- (40) R. H. Kodama, A. E. Berkowitz, E. J. McNiff, Jr., and S. Foner, Phys. Rev. Lett. 77, 394 (1996).