Raman scattering in osmium under pressure
Abstract
The effect of pressure and temperature on the Raman-active phonon mode of osmium metal has been investigated for pressures up to 20 GPa and temperatures in the range 10–300 K. Under hydrostatic conditions (He pressure medium) the phonon frequency increases at a rate of 0.73(5) cm-1/GPa ( K). A large temperature-induced and wavelength-dependent frequency shift of the phonon frequency is observed, of which only a small fraction can be associated with the thermal volume change. The main contribution to the temperature dependence of the phonon frequency is rather attributed to non-adiabatic effects in the electron-phonon interaction, which explains also the observation of an increasing phonon line width upon cooling. The phonon line width and the pressure-induced frequency shift were found to be unusually sensitive to shear stress.
pacs:
PACS: 62.50.+p, 78.30.Er, 63.20.-e, 63.20.Kr,Laser Raman scattering (RS) has been utilized in recent diamond anvil cell studies of the lattice dynamical properties of elemental metals at high pressures Olijnyk ; Goncharov . In metals, phonon RS is essentially restricted to first-order scattering by zone-center optical phonon modes because of the relatively weak Raman signals. Therefore, it is mainly the elemental hcp metals (having one first-order Raman-active phonon mode) that have been investigated by high-pressure RS with a focus on phonon frequency changes which yield indirect information the pressure/volume dependence of the elastic constant .
The high resolution of RS also allows for an investigation of the electron-phonon interaction which is of specific importance to the lattice dynamics of metals. Motivated by the early Raman studies on elemental metals , the effect of electron-phonon interaction on the long-wavelength optical phonon spectrum was studied theoretically 6 . The central result is a prediction of a large non-adiabatic renormalization of the phonon spectrum and a strong dispersion of the optical phonon branch at very small phonon momenta, , where is the bare phonon frequency and the Fermi velocity. At these small momenta, the phonon phase velocity is larger than the electronic one, which leads to a violation of the adiabatic approximation and disappearance of the electron-hole channels for the phonon decay.
Most RS studies of elemental metals were conducted at room temperature where the effects of electron-phonon interaction vanish, partly due to the smearing of electronic self-energy effects which depend on details of the electronic structure. There are only a few ambient-pressure experimental studies of the temperature and momentum dependences of the non-adiabatic effects in hcp transition metals 1 ; 2 ; 3 ; 4 . These investigations revealed anomalies in the temperature and momentum dependences of the energy and line width of long-wavelength optical phonons. In particular, upon cooling they evidence an unusually large phonon frequency hardening and an anomalous increase of the phonon line width.
Osmium is one of the better-investigated examples. Here, a large and strongly anisotropic dispersion of the phonon frequency at small wave vectors cm-1 was reported 1 . For transverse optical phonons it is larger than 106 cm/s and exceeds the typical dispersion of optical phonon branches in metals by two orders of magnitude. This result is clearly reminiscent of the theoretical predictions for the case of non-adiabatic electron-phonon interaction 5 ; 6 ; 7 . Non-adiabatic processes were therefore proposed as the key effect to interpret the experimental observations for the hcp transition metals 1 , but their significance was questioned in other studies 8 ; 9 ; 10 ; 11 . A crucial point is whether the large phonon frequency increase upon cooling originates simply from the common anharmonic behavior (i.e., volume change as a function of temperature) or whether a non-adiabatic electron-phonon interaction plays the dominant role. A high-pressure experiment offers the possibility to answer this question by determining the isothermal volume dependence of the relevant phonon frequencies.
The non-adiabatic effects are expected to be influenced by the application of pressure, through a modification of the electronic band structure near the Fermi level. Besides, ambient-pressure results 1 ; 2 ; 3 ; 4 imply that the main channel of the optical phonon damping in transition metals is a decay into electron-hole pairs rather than into a continuum of low energy phonons. This situation may also change under pressure, leading to a modification of the temperature behavior of the phonon self-energies. Therefore, high-pressure Raman measurements need to be performed in a wide temperature range from ambient down to liquid-helium temperatures in order to observe clearly the modification of the Raman spectra due to low-energy electronic excitations and associated changes in the phonon self-energy.
In this work we report the effect of pressure (up to 20 GPa) and temperature (10–300 K) on the Raman response of osmium metal. The electronic structure of osmium () is characterized by a multi-sheet Fermi surface 25 ; 26a ; 26b . The optical properties were studied experimentally 27 and discussed on the basis of electronic band structure calculations 26a ; 26b . The lattice dynamics was studied at ambient pressure by Raman 1 ; 2 and micro-contact spectroscopy 28 . The mode Grüneisen parameter of the Raman-active phonon was estimated in a recent pressure experiment up to 4 GPa 23 . Osmium exhibits a very low compressibility 29 ; 30 ; 31 , only 10% larger than that of diamond. The central aim of our study is to assess the relative importance of anharmonicity versus non-adiabatic electron-phonon interaction. The experimental results are used to test the conclusions of previous ambient-pressure Raman studies regarding the importance of non-adiabatic effects.
Plates of osmium single crystals with [0001] orientation were thinned to 20 m thickness by a combination of mechanical and electro-polishing. The high purity of the crystals (“clean limit regime”) is indicated by the resistivity ratio . The samples were loaded into a diamond anvil cell and placed in an optical cryostat covering the 10–300 K temperature range. Three different pressure-transmitting media were used in the experiments: helium, a 4:1 methanol-ethanol (M/E) mixture, and KCl. Helium was used as a pressure medium to provide hydrostatic conditions at low temperatures. Pressures were determined by the ruby luminescence method 32 with correction for the temperature dependence of the ruby emission wavelength 33 . Raman spectra were recorded in quasi-backscattering geometry using a triple-grating spectrometer (Jobin Yvon T64000) equipped with a liquid-nitrogen-cooled CCD detector. Argon (514 nm) and krypton (647 nm) ion laser lines at powers of 40 mW were used for excitation. The focal spot on the sample was about 50 m in diameter. A spectrometer bandwidth of 2.5 cm-1 was chosen as the optimum compromise between spectral resolution and Raman intensity.
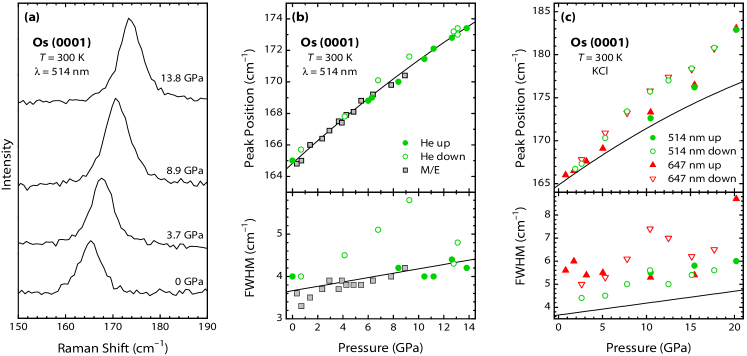
Figure 1(a) shows selected high-pressure Raman spectra of a single crystal of osmium measured at room temperature using the 514-nm excitation and helium as the pressure-transmitting medium. A single symmetric Raman mode is observed (for the polarization configurations and ) which shifts to higher frequencies with increasing pressure. The E2g vibration corresponds to an anti-phase displacement (in the basal plane) of the two atoms of the unit cell. In order to determine accurately the peak position and phonon line width, the spectra were fitted using a Voigt peak profile, i.e. a Lorentzian convoluted with a Gaussian, where the width of the latter corresponded to the spectral resolution (2.5 cm-1).
Figure 1(b) shows the phonon frequency and line width as a function of pressure, obtained in several runs at room temperature and using the 514-nm excitation. The data recorded with the M/E pressure medium (up to 9 GPa) are consistent with the results using helium. Some measurements with excitation at 647 nm gave (within the experimental uncertainty) the same frequencies; the line widths were approximately 1 cm-1 larger at the highest pressure.
The pressure dependence of the Raman mode frequency is described well by a second order polynomial with = 164.9(1) cm-1, = 0.73(5) cm-1/GPa, and = – 0.008(3) cm-1/GPa2. The frequency at zero pressure agrees with earlier results obtained with the same laser wavelength 1 ; 2 . From the initial rate and a bulk modulus value of = 400(10) GPa 30 ; 31 we determined the mode Grüneisen parameter . This value is significantly larger than estimated from a previous experiment up to 4 GPa 23 . The phonon line width increases by less than 1 cm-1 up to the highest pressure of 14 GPa. In the run with helium pressure medium we noticed an increased phonon line width when the pressure was released below 9 GPa. The origin of the broadening remains uncertain at this point.
The pressure dependences of phonon energy and line width obtained when using the KCl pressure medium are presented in Fig. 1(c) together with the fitted curves from Fig. 1(b) for the He and M/E runs. When using KCl, a solid but relatively soft medium, the phonon frequency increases sharply above 15 GPa and shows kinks near 15 and 5 GPa for the down-stroke. The phonon line widths are larger by 25% than in the He run, even at low pressures. These effects appear to result from non-hydrostatic strain and indicate a high sensitivity of the osmium properties to shear stress. It should be mentioned that no such effect was observed for rhenium and ruthenium, which were studied to much higher pressures without using any pressure transmitting medium Olijnyk ; Goncharov .
The temperature dependences of the phonon energy and line width are shown in Fig. 2(a) for two pressures and two excitation wavelengths (514 and 647 nm). A strong dependence of the phonon frequency on the excitation energy is evident from Fig. 2(a), in agreement with previous work 1 . The result was interpreted as a manifestation of a strong phonon dispersion vs probed wave vector q. (One should note here that the variation of q with the wavelength of the incident radiation is larger than due to the wavelength dependence of the optical properties of the metal 27 .) The spectra taken with 514-nm and 647-nm excitation probe wave vector distributions with equal to cm-1 and cm-1, respectively. The previous ambient-pressure experiments on osmium 1 indicated that in the first case (514 nm) the incident radiation probes the adiabatic range of momenta, while in the second case (647 nm) one probes excitations near .
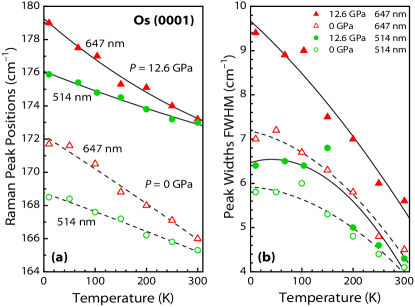
Figure 2(a) demonstrates that the application of pressure has only little effect on the phonon dispersion (i.e., dependence on excitation wavelength at low temperatures) and the temperature dependence of the phonon energies. The temperature-induced shifts between 300 and 10 K amount to 3–4 cm-1 for excitation at 514 nm and to 6–7 cm-1 for excitation at 647 nm. These values can be compared with the expected phonon frequency shift due to thermal expansion. The volume change between 300 K and 10 K amounts to less than 0.4% 34 . With the mode Grüneisen parameter determined above we arrive at an expected frequency increase of 1.3 cm-1 due to thermal contraction between 300 and 10 K. In contrast, the actually observed temperature-induced shifts are larger by factors of 3 and 5 for excitation at 514 and 647 nm, respectively. Thus, only a small part of the temperature-induced shift can be attributed to the change in volume.
The unusual increase in phonon line width with decreasing temperature and the pronounced dependence on the excitation wavelength persist under pressure [Fig. 2(b)]. It suggests that the contribution of multi-phonon decay to the phonon line width is negligible (even if modified under pressure). Altogether, the experimental results presented here yield direct evidence that the usual anharmonic processes are not the main cause of the large phonon hardening upon cooling. They rather support the picture that non-adiabatic effects in the electron-phonon interaction play a dominant role and lead to the observed anomalies in the phonon self-energies.
Finally, we consider a possible relationship between non-adiabatic electron-phonon interaction and a high sensitivity to non-hydrostatic stresses of the phonon self-energies in osmium. The observation of increased line widths in the spectra measured at 12.6 GPa [especially with 647-nm excitation, cf. Fig. 2(b)] is an indication of the non-adiabatic effects being influenced by hydrostatic pressure, even at room temperature. The application of pressure thus seems to affect those details of the electronic band structure near the Fermi level that cause the non-adiabatic effects. In the case of non-hydrostatic compression, the electronic band structure details may, on the one hand, be modified due to a change in the c/a ratio. On the other hand, nonuniform stresses in the basal plane would result in a symmetry lowering which would split those bands that are normally degenerate in the Brillouin zone AHL plane of hcp metals. In the case of osmium such bands intersect the Fermi level, and a shear-stress-induced splitting may thus have significant effect on the phonon self-energies.
In summary, by combining pressure- and temperature-dependent Raman scattering experiments on osmium single crystals we have shown that only a small fraction of the large temperature-induced frequency change can be associated with the thermal expansion. Our results corroborate the notion that both the large frequency variation and the decrease of the phonon lifetime upon cooling originate from a non-adiabatic electron-phonon interaction.
Acknowledgements.
Yu. S. Ponosov acknowledges financial support from Deutscher Akademischer Austauschdienst (DAAD).References
- (1) H. Olijnyk, Phys. Rev. Lett. 68, 2232 (1992); H. Olijnyk, Phys. Rev. B 46, 6589 (1992); H. Olijnyk and A. P. Jephcoat, Phys. Rev. B 56, 10751 (1997); H. Olijnyk, J. Phys.: Condens. Matter 11, 6589 (1999); H. Olijnyk, J. Phys.: Condens. Matter 12, 8913 (2000); H. Olijnyk, A. P. Jephcoat, D. L. Novikov, and N. E. Christensen, Phys. Rev. B 62, 5508 (2000); H. Olijnyk and A. P. Jephcoat, Solid State Commun. 115, 335 (2000); H. Olijnyk, A. P. Jephcoat, and K. Refson, Europhys. Lett. 53, 504 (2001).
- (2) S. Merkel, A. F. Goncharov, H.-K. Mao, P. Gillet, and R. J. Hemley, Science 288, 1626 (2000); A. F. Goncharov and V. V. Struzhkin, J. Raman Spectr. 34, 532 (2003); A. F. Goncharov, E. Gregoryanz, V. V. Struzhkin, R. J. Hemley, H.-K. Mao, N. Bostor, and E. Huang, in Proceedings of the International School of Physics ’Enrico Fermi’ Course CXLVII, edited by R. J. Hemley, G. L. Chiarotti, M. Bernasconi, and L. Ulivi (Societa Italiana di Fisica, 2002), p. 297; A. F. Goncharov, J. Crowhurst, and J. M. Zaug, Phys. Rev. Lett. 92, 115502 (2004).
- (3) J. H. Parker, Jr., D. W. Feldman, and M. Ashkin, in Light Scattering Spectra of Solids, edited by G. B. Wright (Springer-Verlag, New York, 1969), pp. 389–397.
- (4) I. P. Ipatova and A. V. Subashiev, Zh. Eksp. Teor. Fiz. 66, 722 (1974), [Sov. Phys. JETP 39, 349 (1974)].
- (5) Y. S. Ponosov, G. A. Bolotin, C. Thomsen, and M. Cardona, phys. stat. sol. (b) 208, 257 (1998).
- (6) Y. S. Ponosov, G. A. Bolotin, G. P. Kovtun, and V. A. Elenskii, Fiz. Tverd. Tela 26, 815 (1984), [Sov. Phys. Solid State 26, 491 (1984)].
- (7) Y. S. Ponosov, Fiz. Tverd. Tela 23, 1477 (1981), [Sov. Phys. Solid State 23, 861 (1981)].
- (8) Y. S. Ponosov and G. A. Bolotin, phys. stat. sol. (b) 215, 137 (1999).
- (9) S. Engelsberg and J. R. Schrieffer, Phys. Rev. 131, 993 (1963).
- (10) E. G. Maksimov and S. V. Shulga, Solid State Commun. 97, 553 (1996).
- (11) M. Y. Reizer, Phys. Rev. B 38, 10398 (1988).
- (12) M. Y. Reizer, Phys. Rev. B 61, 40 (2000).
- (13) L. A. Falkovsky, Zh. Eksp.Teor. Fiz. 122, 411 (2002), [JETP 95, 354 (2002)].
- (14) L. A. Falkovsky, Uspekhi Fiz. Nauk 174, 259 (2004), [Phys. Usp. 47, 249-272 (2004)].
- (15) G. N. Kamm and J. R. Anderson, Phys. Rev. B 2, 2944 (1970).
- (16) O. Jepsen, O. K. Andersen, and A. R. Mackintosh, Phys. Rev. B 12, 3084 (1975).
- (17) V. N. Antonov, A. I. Bagljuk, A. Y. Perlov, V. V. Nemoshkalenko, V. N. Antonov, O. K. Andersen, and O. Jepsen, Fiz. Nizk. Temp. 19, 786 (1993), [Low Temp. Phys. 19, 561 (1993)].
- (18) V. V. Nemoshkalenko, V. N. Antonov, V. N. Antonov, M. M. Kirillova, A. E. Krasovskiĭ, and L. V. Nomerovannaya, Zh. Eksp.Teor. Fiz. 90, 201 (1986), [Sov. Phys. JETP 63, 115 (1986)].
- (19) A. V. Khotkevich, V. A. Elenskii, G. P. Kovtun, and I. K. Yanson, Fiz. Nizk. Temp. 10, 375 (1984), [Sov. J. Low Temp. Phys. 10, 194 (1984)].
- (20) V. E. Mogilenskikh, V. I. Osotov, Y. S. Ponosov, and V. V. Shchennikov, Phys. Met. Metallogr. 96, 474 (2003).
- (21) H. Cynn, J. E. Klepeis, C. S. Yoo, and D. A. Young, Phys. Rev. Lett. 88, 135701 (2002).
- (22) K. Takemura, Phys. Rev. B 70, 012101 (2004).
- (23) F. Occelli, D. L. Farber, J. Badro, C. M. Aracne, D. M. Teter, M. Hanfland, B. Canny, and B. Couzinet, Phys. Rev. Lett. 93, 095502 (2004).
- (24) G. J. Piermarini, S. Block, J. D. Barnett, and R. A. Forman, J. Appl. Phys. 46, 2774 (1975).
- (25) H. K. Mao, J. Xu, and P. M. Bell, J. Geophys. Res. 91, 4673 (1986).
- (26) V. A. Finkel, G. P. Kovtun, and M. I. Palatnik, Phys. Met. Metallogr. 32, 231 (1971).