.
Crystal and magnetic structure of La1-xCaxMnO3 compound
Abstract
We studied the crystal and magnetic structure of the La1-xCaxMnO3 compound for using stoichiometric samples. For the system’s ground state is insulating canted antiferromagnetic. For e below the Jahn Teller transition temperature () the crystal structure undergoes a monoclinic distortion. The crystal structure can be described with space group which permits two Mn sites. The unit cell strain parameter increases for , taking the maximum value at the Curie point, and then decreases. Below K abruptly changes slope and finally approaches K with nearly zero slope. The change of at is connected to a characteristic feature in the magnetic measurements. As increases towards the ferromagnetic metallic boundary, although is reduced appreciably, the monoclinic structure is preserved. The monoclinic structure is discussed with relation to the orbital ordering, which can produce the ferromagnetic insulating ground state. We also studied samples that were prepared in air atmosphere. This category of samples shows ferromagnetic insulating behavior without following the particular variation of the parameter. The crystal structure of these samples is related to the so-called O∗ () structure.
pacs:
75.47.Lx,75.47.GK,75.25.+z,75.30CrI Introduction
The nature of the ferromagnetic insulating state (FMI) in lightly doped La1-xAxMnO3 (A=Sr, Ca, ) rare-earth manganite perovskites continues to offer significant challenges in our understanding of the physical properties of these materials. Typically, insulating compounds of this category are antiferromagnetic, and ferromagnetism is associated with a metallic behavior that arises from doping and double exchange. The FMI state can be realized with a certain orbital ordering favorable for ferromagnetism.khomskii97 In the intermediate doping levels () where the ferromagnetic metallic (FMM) state is observed the double-exchange mechanism is able to explain some of the experimental results. Despite of the numerous studies concerning the FMI phase of La1-xSrxMnO3 compound, for the Ca case only a few exist. Furthermore, the tendency of this system in particular to produce cation deficient samples complicates the situation. For the Sr case the sample shows a transition to a FMM state from paramagnetic insulating state, followed by an abrupt first-order transition to the FMI phase. The FMI state coexists with a weak antiferromagnetic component with the type magnetic structure as was found in LaMnO3.pinsard97 In addition in some other studiesyamada00 ; endoh99 charge or orbital ordering have been proposed to occur in the FMI state.
The manganite perovskites of interest to this work consist of a 3D network of corner-sharing BX6 octahedra located at the nodes of a simple cubic lattice. At the center of the unit cell there is room for the A cation which will fit perfectly if . When the BX6 octahedra are tilted to fill the extra interstitial space (steric effect). The steric effect in La1-xCaxMnO3 compound leads to a lower symmetry structure with space group (in comparison to the aristotype cubic perovskite structure) which according to the Glazer’s clasificationglazer belongs to the tilt system (adopted by GdFeO3 and CaTiO3 perovskites). The adoption of the GdFeO3 tilting scheme in La1-xCaxMnO3 is due to the small radius of the La and Ca, with respect to its surrounding cage. Thus, in order that the La ion can be accommodated in the structure, the MnO6-octahedra tilt. Practically MnO6 octahedra rotation is not rigid. Below a characteristic temperature the La1-xCaxMnO3 compound for displays cooperative JT distortion arising from ordering of the orbital of the Mn+3 ion. This structure is denoted asmonoclinic O/ and the unit cell satisfies the inequality . For this phase, Mn+3 orbitals are ordered in such a way so that in neighboring Mn sites the and orbitals are alternatively occupied, forming a ”canted” orbital structure. This configuration does not change along axis.
Two mechanisms have been proposed to explain the orbital ordering in degenerated transition metal orbital states. The first is related with lattice distortionskanamori60 and the second is a direct generalization of the usual superexchange which in the case of orbital degeneracy is present.kugel82 The orbital ordering can be described by using the pseudospin-, operator in such a way so that the state corresponds to the orbitals and , respectively. An arbitrary distortion can be described by linear superposition of the states , e.g. , where is an angle in the plane.
Finally, there is a third orthorhombic phase, O* (), related to orbital disordered manganites (). The O*-structure, is pseudocubic with the Mn-O bond lengths almost equal, indicating that it lacks a clear static JT distortion. Both phases exhibit the orthorhombic symmetry.
In this article we present a synchrotron x-ray and neutron diffraction study, using carefully prepared stoichiometric La1-xCaxMnO3 samples in an effort to isolate the structural and magnetic features that characterize the FMI state. Our diffraction results on stoichiometric samples shows that the crystal structure at FMI regime is monoclinic . The temperature variation of the unit cell parameters is non monotonic, defining the and temperatures. In addition, this monoclinic crystal structure permits two Mn crystallographic sites. This crystal structure is different from it of the cation deficient samples and samples that belong in the ferromagnetic metallic regime.
II Experimental details
La1-xCaxMnO3 samples ware prepared by thoroughly mixing high purity stoichiometric amounts of CaCO3, La2O3, and MnO2. The mixed powders reacted in air up to 1400C for several days with intermediate grinding. Finally the samples were slowly cooled to 25oC. These samples are cation deficient.pissas04a ; dabrowski99a ; roosmalen94 In order to produce stoichiometric samples additional annealing in He atmosphere was applied. More specifically, in the final preparation step the samples were heated under He flow up to 1100oC for 48 h followed by rapid cooling to room temperature. It is important to stress here that in the doping range examined in this work the samples fired in air in all preparation steps are not stoichiometric. Although these samples are ferromagnetic and insulating for , they do not exhibit all the features of the stoichiometric samples, especially the cooperative Jahn-Teller (JT) distortion feature for .
Neutron powder diffraction (NPD) data were collected on the E6 and E9 neutron diffractometers at the Berlin Neutron Scattering Center (BENSC), located at the Hahn-Meitner-Institut, Berlin. The neutron powder diffraction measurements on the E6 diffractometer were performed as a function of temperature at low angles using (002) reflection of pyrolytic graphite monochromator, giving a wavelength Å. For high resolution crystal structure determinations we measured NPD data using the E9 diffractometer with a wavelength of Å ((511) reflection of a vertically bent Ge monochromator) and collimation (in pile collimator), (second collimator after monochromator), (third collimator after sample). The powdered samples were contained in a cylindrical vanadium can ( mm) mounted in an ILL orange cryostat.
For high resolution x-ray diffraction data we used the ID31 high resolution powder diffraction beamline of the European Synchrotron Radiation Facility (ESRF). For our measurements we select a wave length Å. Nuclear and magnetic structures were determined and refined from the NPD data by using the Rietveld method with the FULLPROF suite of programs.fullprof For synchrotron x-ray diffraction data, the GSAS suite was used.toby ; larson As peak shape function we used the gaussians convoluted with axial divergence asymmetry functionfinger94 for neutron data and the constant wave length profile function no 4 of the GSAS for the x-ray data. DC magnetization measurements were performed in a superconducting quantum interference device (SQUID) magnetometer (Quantum Design). Finally, for the ac susceptibility measurements we used a home made ac-susceptometer.
| (K) | 300 | 198.4 | 121 | 48 | 2 | |
|---|---|---|---|---|---|---|
| (Å) | 5.5754(1) | 5.5855(1) | 5.5829(1) | 5.5709(1) | 5.5697(1) | |
| (Å) | 7.7423(1) | 7.7213(1) | 7.7186(1) | 7.7288(1) | 7.7296(1) | |
| (Å) | 5.5269(1) | 5.5253(1) | 5.5234(1) | 5.5206(1) | 5.5205(1) | |
| (deg.) | 90.125(3) | 90.130(5) | 90.127(4) | 90.106(6) | 90.107(5) | |
| La,Ca | 0.0319(4) | 0.0344(3) | 0.0348(6) | 0.0342(3) | 0.0341(3) | |
| 0.2501(8) | 0.2487(5) | 0.2477(7) | 0.2479(9) | 0.2485(8) | ||
| 0.0058(5) | 0.0049(4) | 0.0055(4) | 0.0064(4) | 0.0061(4) | ||
| 0.69(4) | 0.57(3) | 0.43(3) | 0.33(3) | 0.37(3) | ||
| Mn1 | 0.38(7) | 0.30(6) | 0.24(6) | 0.19(5) | 0.17(6) | |
| Mn2 | 0.38(7) | 0.30(6) | 0.24(6) | 0.19(5) | 0.17(6) | |
| O1 | 0.4909(6) | 0.4898(5) | 0.4906(5) | 0.4909(5) | 0.4901(5) | |
| 0.244(1) | 0.247(1) | 0.246(1) | 0.248(1) | 0.247(1) | ||
| -0.0670(6) | -0.0679(4) | -0.0688(5) | -0.0687(4) | -0.0683(5) | ||
| 1.01(6) | 0.87(5) | 0.74(5) | 0.60(4) | 0.62(5) | ||
| O2A | 0.213(1) | 0.211(1) | 0.209(1) | 0.215(1) | 0.223(1) | |
| -0.0380(9) | -0.0377(8) | -0.0392(7) | -0.0376(8) | -0.0374(9) | ||
| 0.784(1) | 0.784(1) | 0.784(1) | 0.788(1) | 0.783(1) | ||
| 1.06(5) | 0.83(4) | 0.66(4) | 0.76(4) | 0.73(4) | ||
| O2B | -0.207(1) | -0.207(1) | -0.208(1) | -0.205(1) | -0.207(1) | |
| 0.4656(9) | 0.4640(7) | 0.4655(7) | 0.4644(8) | 0.4641(8) | ||
| -0.764(1) | -0.763(1) | -0.764(1) | -0.778(1) | -0.766(1) | ||
| 1.06(5) | 0.83(3) | 0.66(4) | 0.76(4) | 0.73(4) | ||
| 7.0 | 5.9 | 6.4 | 5.7 | 5.9 | ||
| 9.2 | 7.6 | 8.2 | 7.5 | 7.8 | ||
| 6.2 | 5.3 | 5.6 | 4.7 | 4.8 | ||
| Mn1-O1 | 1.928(9) | 1.947(8) | 1.942(8) | 1.95(1) | 1.948(1) | |
| Mn1-O2A | 2.013(7) | 2.026(6) | 2.035(6) | 2.022(8) | 2.014(7) | |
| Mn1-O2A | 1.994(8) | 1.986(6) | 1.981(7) | 1.971(9) | 1.987(7) | |
| Mn2-O1 | 2.014(9) | 1.986(8) | 1.993(8) | 1.98(1) | 1.990(1) | |
| Mn2-O2B | 2.102(7) | 2.111(6) | 2.099(6) | 2.082(8) | 2.095(7) | |
| Mn2-O2B | 1.884(8) | 1.881(6) | 1.887(6) | 1.911(9) | 1.891(7) |
| (K) | 320 | 250 | 170 | 100 | 2 | |
|---|---|---|---|---|---|---|
| (Å) | 5.5246(1) | 5.5573(1) | 5.5614(1) | 5.5480(1) | 5.5300 | |
| (Å) | 7.7877(1) | 7.7387(1) | 7.7266(1) | 7.7386(1) | 7.7508 | |
| (Å) | 5.5219(1) | 5.5213(1) | 5.5195(1) | 5.5159(1) | 5.5081 | |
| (deg.) | 90 | 90.140(1) | 90.134(2) | 90.0965(1) | 90.0752 | |
| La,Ca | 0.0263(4) | 0.0300(3) | 0.0311(3) | 0.0309(3) | 0.0303(2) | |
| 0.25 | 0.2489(5) | 0.2501(7) | 0.2493(6) | 0.2454(6) | ||
| -0.0083(5) | 0.0060(4) | 0.0060(4) | 0.0058(4) | -0.0065(4) | ||
| 0.54(5) | 0.40(3) | 0.42(3) | 0.12(2) | 0.15(3) | ||
| Mn1 | 0.36(7) | 0.25(5) | 0.19(5) | 0.19(5) | 0.16(5) | |
| Mn2 | 0.25(5) | 0.19(5) | 0.19(5) | 0.16(5) | ||
| O1 | 0.4910(8) | 0.4912(4) | 0.4914(4) | 0.4905(5) | 0.4909(4) | |
| 0.25 | 0.2450(8) | 0.246(1) | 0.2429(8) | 0.259(1) | ||
| 0.0684(7) | -0.0668(4) | -0.0675(1) | -0.0693(4) | -0.0680(5) | ||
| 0.94(7) | 0.69(4) | 0.58(4) | 0.45(4) | 0.484(4) | ||
| O2A | 0.2817(6) | 0.2180(7) | 0.2188(8) | 0.2212(9) | 0.2219(9) | |
| 0.0353(3) | -0.0381(5) | -0.0364(7) | -0.0375(6) | -0.0384(6) | ||
| 0.7238(6) | 0.721(1) | 0.780(1) | 0.780(1) | 0.782(1) | ||
| 0.88(5) | 0.63(3) | 0.58(3) | 0.40(3) | 0.32(3) | ||
| O2B | -0.2075(8) | -0.2059(9) | -0.206(1) | -0.2085(0) | ||
| 0.4659(6) | 0.4639(7) | 0.4657(7) | 0.4666(6) | |||
| -0.766(1) | -0.768(1) | -0.768(1) | -0.768(1) | |||
| 0.63(3) | 0.58(3) | 0.40(3) | 0.32(3) | |||
| 6.9 | 5.1 | 6.2 | 6.0 | 6.1 | ||
| 9.0 | 6.8 | 7.9 | 8.0 | 7.9 | ||
| 4.3 | 4.1 | 5.6 | 3.7 | 3.6 | ||
| Mn1-O1 | 1.9839(8) | 1.932(6) | 1.941(8) | 1.919(6) | 1.973(7) | |
| Mn1-O2A | 2.006(3) | 1.999(5) | 1.996(6) | 1.986(6) | 1.973(6) | |
| Mn1-O2A | 1.9634(3) | 1.992(5) | 1.991(6) | 1.995(7) | 2.002(7) | |
| Mn2-O1 | 2.007(6) | 1.994(8) | 2.026(6) | 1.975(7) | ||
| Mn2-O2B | 2.092(5) | 2.094(6) | 2.086(6) | 2.071(6) | ||
| Mn2-O2B | 1.886(2) | 1.893(6) | 1.891(7) | 1.893(6) |
| (K) | 300 | 200 | 170 | 120 | 70 | 2 | |
|---|---|---|---|---|---|---|---|
| (Å) | 5.5113(1) | 5.5275(1) | 5.5323(1) | 5.5242(1) | 5.5165(1) | 5.5152(1) | |
| (Å) | 7.7778(1) | 7.7449(2) | 7.7414(1) | 7.7453(1) | 7.7553(1) | 7.7568(1) | |
| (Å) | 5.5142(1) | 5.5114(1) | 5.5104(1) | 5.5080(1) | 5.5050(1) | 5.5042(1) | |
| (deg.) | 90.0 | 90.094(6) | 90.09(1) | 90.063(5) | 90.059(4) | 90.056(4) | |
| La,Ca | 0.0252(4) | 0.0283(3) | 0.0292(5) | 0.0290(3) | 0.0280(3) | 0.0278(3) | |
| 0.25 | 0.248(1) | 0.244(1) | 0.247(1) | 0.249(1) | 0.248(1) | ||
| -0.008(1) | 0.0063(5) | 0.0087(7) | 0.0074(5) | 0.0070(6) | 0.0077(6) | ||
| 0.57(4) | 0.44(3) | 0.70(4) | 0.37(3) | 0.28(3) | 0.28(3) | ||
| Mn1 | 0.37(7) | 0.1(1) | 0.34(8) | 0.08(6) | 0.11(6) | 0.13(6) | |
| Mn2 | 0.1(1) | 0.34(8) | 0.08(6) | 0.11(6) | 0.13(65) | ||
| O1 | 0.4927(8) | 0.4914(6) | 0.4910(8) | 0.4927(6) | 0.4913(6) | 0.4913(5) | |
| 0.25 | 0.247(1) | 0.246(1) | 0.248(1) | 0.250(1) | 0.251(1) | ||
| 0.0680(8) | -0.0669(5) | -0.0646(7) | -0.0671(5) | -0.0665(6) | -0.0673(3) | ||
| 0.86(7) | 0.65(5) | 0.77(6) | 0.46(5) | 0.38(5) | 0.37(5) | ||
| O2A | 0.2792(7) | 0.221(1) | 0.221(2) | 0.224(1) | 0.221(1) | 0.221(1) | |
| 0.0344(4) | -0.035(1) | -0.0360(9) | -0.0369(8) | -0.033(1) | -0.033(1) | ||
| 0.7240(7) | 0.781(1) | 0.771(2) | 0.770(1) | 0.781(1) | 0.778(2) | ||
| 0.7224(7) | 0.62(3) | 1.04(5) | 0.64(4) | 0.50(3) | 0.56(4) | ||
| O2A | -0.209(1) | -0.209(2) | -0.208(1) | -0.213(1) | -0.214(1) | ||
| 0.464(1) | 0.4676(9) | 0.4666(9) | 0.462(1) | 0.462(1) | |||
| -0.766(1) | -0.771(2) | -0.780(1) | -0.770(1) | -0.774(2) | |||
| 0.62(4) | 1.04(5) | 0.64(4) | 0.50(3) | 0.56(4) | |||
| 6.0 | 5.4 | 6.8 | 5.8 | 6.1 | 6.2 | ||
| 8.0 | 7.0 | 9.4 | 7.6 | 8.0 | 8.0 | ||
| 3.3 | 3.6 | 5.6 | 4.2 | 3.8 | 3.8 | ||
| Mn1-O1 | 1.9809(1) | 1.949(1) | 1.93(1) | 1.95(1) | 1.979(1) | 1.98(1) | |
| Mn1-O2A | 1.996(4) | 1.973(8) | 2.00(1) | 2.000(8) | 1.968(8) | 1.980(9) | |
| Mn1-O2A | 1.973(4) | 1.995(8) | 1.95(1) | 1.959(8) | 1.989(9) | 1.97(1) | |
| Mn2-O1 | 1.993(1) | 1.99(1) | 1.98(1) | 1.96(1) | 1.96(1) | ||
| Mn2-O2B | 2.074(8) | 2.04(1) | 2.029(8) | 2.043(8) | 2.028(9) | ||
| Mn3-O2B | 1.891(8) | 1.92(1) | 1.944(9) | 1.922(8) | 1.93(1) |
III Crystal structure refinements
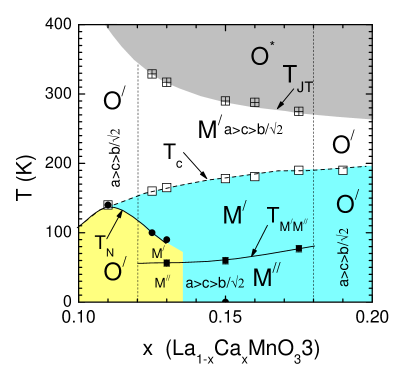
Our structural and magnetization results on stoichiometric La1-xCaxMnO3, with an emphasis on the FMI regime, are summarized in Fig. 1 in the form of a phase diagram. The particular phase diagram is in good agreement with the one estimated by Biotteau et al., biotteau01 using single crystal samples. The curve is defined at the temperature where the magnetization curves display a jump-like or slope-change behavior and the unit cell parameter () increases (decreases) abruptly on cooling. The particular behavior of the unit cell constants resemble the situation observed in LaMnO3 compound on cooling through the transition.carvajal98 Depending on , for a symmetry change from to occurs. The and lines concern the Curie and Neel temperatures as were estimated both from neutron and magnetization data. The line is defined at the temperature where the and curves display an abrupt slope change, upon heating from . Based on the transition lines mentioned above the phase diagram of the La1-xCaxMnO3 compound depicted in Fig. 1 displays two distinct regions as the ground state is concerned. In the first region a canted antiferromagnetic (CAF) orthorhombic structure is present. In the second one, depending on , a ferromagnetic insulating (FMI) monoclinic and orthorhombic structures have been observed. The change from CAF to FMI ground states occurs in a narrow concentration regime , where in neutron diffraction patterns (vide infra) a ferromagnetic transition () is observed firstly and after an antiferromagnetic transition () have been observed upon cooling. Our high resolution synchrotron x-ray diffraction patterns revealed that the true symmetry of the samples in the boundary of the CAF and FMI regimes and partially in the FMI regime is monoclinic with very small monoclinic angle (). This regime is denoted by symbol M/ in the phase diagram. The temperature variation of the unit cell parameters in the FMI regime revealed an additional structural transformation which occurs upon heating from at temperature . The magnitude of the unit cell changes at the reduces when the is in the CAF-FMI(M) and FMI(M/)-FMI(O/) phase boundaries. In this phase diagram the ferromagnetic to paramagnetic (), JT () and transition lines are all estimated from neutron and magnetic measurements.
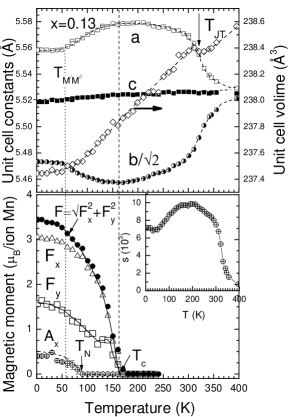
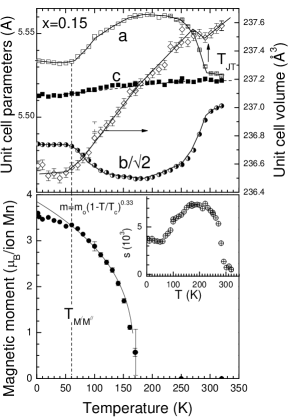
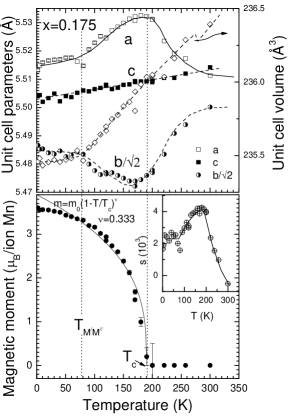
Figures 2, 3 and 4 (upper panels) show the temperature variation of the unit cell parameter for and 0.175 samples using the pseudo orthorhombic description of the unit cell. For , the unit cell parameters follow the inequality , a fact implying that in this pseudo orthorhombic description the structure is realized in the whole temperature regime studied in this work. For all the samples there is a temperature region where the unit cell parameters change abruptly ( increases, decreases and decreases slightly) resembling the situation observedcarvajal98 in the LaMnO3 compound due to the orbital ordering state. As it is mentioned above, we define the transition temperature as the point where an extreme in the curve occurs, in the high temperature regime of the data. This particular assignment agrees with the magnetic measurements (vide infra). The orthorhombic strain parameter (see Figs. 2, 3 and 4, lower panels) becomes maximum at the ferromagnetic transition temperature. Furthermore, for decreases during cooling and finally for K (for the sample) it becomes almost temperature independent. The particular behavior reveal that the FMI state does not concern only the spin degrees of freedom but is also related with the lattice and orbital ones. The temperature variation of the unit cell volume exhibits a discontinuous change at implying that the JT distortion is first order. As increases the volume jump is difficult to be identified, on the basis of the available diffractometer resolution. It is very likely that the JT structural transition becomes second order for . Above and below the unit cell volume decreases with temperature nearly linearly, showing a small slope change at . Finally, at displays a pronounced slope change for all samples.
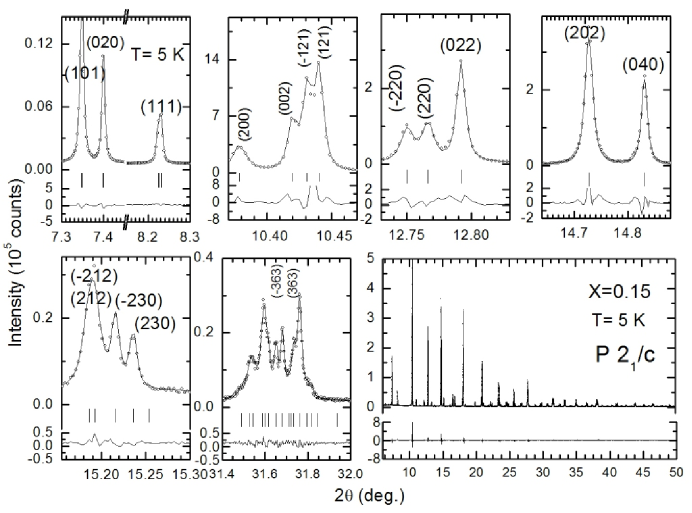
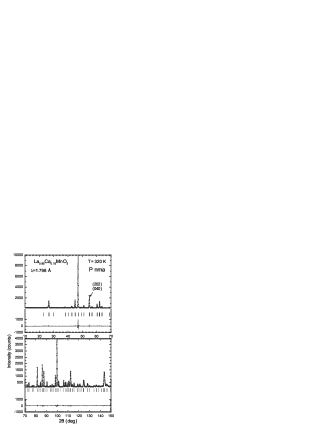
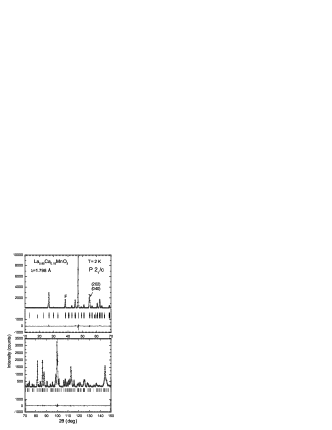
Let us present now the high resolution synchrotron x-ray data. The samples for for exhibited additional reflections that can not be accounted for the space group. More specifically, we observed splitting of the , and diffraction peaks not allowed in the space group. This splitting is compatible with the (no 14, unique -axis) space group. Fig. 5 depicts the high resolution synchrotron x-ray diffraction data for the La0.85Ca0.15MnO3 sample at K, as an example. One can see very clearly the splitting of the diffraction peaks with non zero and . We obtained similar data also for the other samples . In this monoclinic distortion glide-plane element is preserved, while the and elements are lost. The loss of the mirror plane may be signaling a change of the JT order from C type orbital ordering (that is followed by LaMnO3) to a new one. We note that similar monoclinic distortion have been detected in La1-xSrxMnO3 () compounds.cox01 Based on this critical information about the symmetry of the structure we refine the neutron data using the space group. The mirror plane at being present for space group is now absent, resulting in two Mn sites along the axis, the first at and the second at . Similarly, instead of one plane oxygen site (O2, symmetry) there are two now in the symmetry. Thus, in this new symmetry two crystallographically independent Mn sites produce a layer type arrangement of two different MnO6 octahedra along the axis. The refinement strategy employed in this work was to first optimize the scale factor, background, unit cell parameters and zero-shift errors. Subsequently, we refined the atomic positional and isotropic thermal parameters. In order to reduce the number of parameters we decided to refine the thermal parameters for all the sites isotropically and we kept equal the thermal parameters of the Mn and O2 sites. Figures 6 and 7 show two representative Rietveld plots of neutron data for La0.85Ca0.15MnO3 sample at 320 K and 2 K, respectively. The corresponding structural parameters for all the studied samples are reported in Tables 1-3.
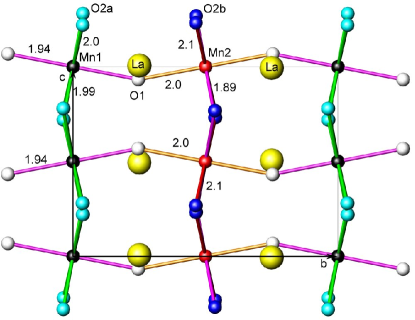
Fig. 8 shows projections of the monoclinic structure of the La0.85Ca0.15MnO3 compound for K on the and planes, respectively. All the samples show qualitatively the same behavior, as far as the variation of the structural parameters with temperature is concerned. Nevertheless, there are significant quantitative differences related to the influence of the hole doping through Ca substitution.

The Bragg peaks are quite sharp for but for they develop a pronounced selective peak broadening. In order to account for the selective peak broadening the Stephensstephens99 microstrain model was used. As our Rietveld refinement results reveal the microstrain parameters follow the temperature variation of the unit cell parameters. The most significant broadening is related to and parameters. The strain parameter describes a correlated type random strain between and crystallographic directions and it is reasonable to be attributed to some kind of local static orbital ordering correlations. The average structure revealed a cooperative JT distortion which increases as temperature decreases. Parallel to this behavior, there is an antagonistic interaction which produces correlated fluctuation of the cell constants. These fluctuations are directly connected with the development of the ferromagnetic long range order and temperature variation of the unit cell parameters. The microstrain parameters take the maximum value at . Most importantly the microstrain parameters are reduced about 30% at and below this temperature remain nearly temperature independent. Consequently, our structural data reveal a complex magneto-elastic behavior for , that characterizes the FMI regime of the La1-xCaxMnO3 compound.
Anisotropic broadening is usually connected with the presence of correlated structural defects, due to the preparation method, or is inherent to structural or magnetic transformations. Since we observe temperature dependance in the microstrain parameters, the case of the structural defects caused by the preparation method should be ruled out, because in this case a temperature independent behavior is expected. It is natural one to ask what is the physical origin of the particular temperature variation of the microstrain parameters. Essentially, the anisotropic peak broadening concerns the lattice planes and , meaning that there is some modulation along the -axis and -direction. Our findings may be related with recent theoretical studies where the important role of the elastic energies (strain) in determining the ground state of the system has been pointed out.calderon03 ; ahn04 Furthermore, the anisotropic broadening may originate from grains which contain different structural twin domains corroborated by the successive magneto-structural transformation occurring upon cooling. Finally, one cannot disregard the case where phase separation is present especially near the CAF-FMI phase boundary. In such a case several phases with nearly similar parameters occur producing indirectly a selective peak broadening, which is accounted for by microstrain formalism.
IV Bond lengths
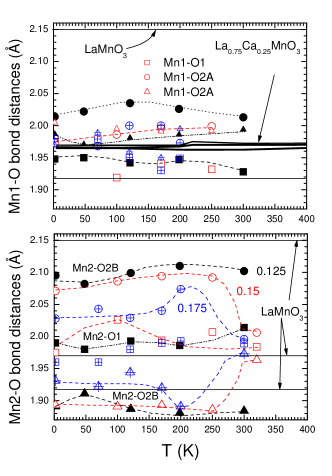
In Fig. 9 are depicted the temperature variation of the Mn-O bond lengths for and 0.175 samples, deduced from neutron diffraction data. For the crystal structure of the La1-xCaxMnO3 in the FMI regime based on the space group have two Mn sites. As the Ca content increases the long Mn2-O bond length (which has been attributed to the orbital) decreases. The short Mn2-O bonds are approximately at the same level as in the LaMnO3 case. Concerning the intermediate Mn2-O bond, its magnitude is above the corresponding one of LaMnO3. Is is interesting to note that the long and short bonds follow the temperature variation of the and cell parameters or in other words these bonds define the temperature variation of the unit cell parameters. Based on the similarities of the Mn2-O bond lengths with those of LaMnO3, it is reasonable to attribute the Mn2 site to a Mn+3 like site in the La1-xCaxMnO3 () compound.
Let us turn now to the Mn1-O bond lengths. As their magnitude is concerned these bond lengths, are more close to the bond lengths of MnO, observed in the FMM region of the phase diagram. In Fig. 9 (upper panel) with bold lines, the Mn-O bond lengths observed in La0.75Ca0.25MnO3 compound are depicted. One can see that as increases the Mn1-O bond lengths approach these lines. It is plausible to attribute the Mn1 site to a mixed valence Mn like site as observed in the La0.75Ca25MnO3 compound. As reduces towards the CAF regime the Mn1-O bond lengths become non degenerated and move away from those of La0.75Ca0.25MnO3 compound.radaelli97a
Except for the metrical variation of the bond lengths there is an orientation difference, concerning the short Mn-O bonds (), between the two Mn-sites. In the Mn2-site (which resembles the LaMnO3 case) the short bond lies in the plane, contrary to the Mn1-site, where the short Mn1O-bond is directed, approximately, along the -axis. According to the authors’ opinion this is the key point to which one can be based in order to explain the FMI phase. It is important to note the fundamental difference between the conventional JT orthorhombic O/ and the monoclinic M/ structures. The latter cannot be the usual C-type antiferrodistortive arrangement found in the O/ structure in LaMnO3 and CAF part of the phase diagram. As proposed by Cox et alcox01 in the case of La1-xSrxMnO3, the loss of the mirror plane would be consistent with a change in JT order from C-type to G-type at which there is antiferrodistortive coupling of MnO6 octahedra along the direction instead of parallel coupling (see Fig. 8).
V Magnetic measurements and magnetic structure
Fig. 10 and Fig. 11 (upper panels) show the temperature variation of the magnetic moment per Mn ion for the samples and 0.175, respectively, for several dc magnetic fields. We obtained similar magnetic measurements data also for and 0.14 samples. In the lower panels of Figs. 10, and 11 we plot the temperature dependance of the normalized real part of the ac susceptibility, and the low field dc magnetic moment (left axis). In addition, we plot the temperature variation of the inverse dc susceptibility () (right axis) measured under a dc-field kOe. The abrupt increasing of the magnetic signal in the dc and ac measurements at K and K for and respectively marks a transition from a paramagnetic to ferromagnetic state, in agreement with neutron data (vide infra). The sharp peak at in the is related with the Hopkison effect, as we discussed in Ref. pissas04a, . Upon heating from , slightly increases up to . For increases in a step wise fashion as the dashed vertical lines in Figs. 10 and 11 show. This peculiarity reveals the magnetic signature of the structural change that occurs at . The particular anomaly is present and in the dc magnetization measurements as it is seen for example, in the upper panel of the Fig. 10 where a step like slope change occurs at .
Furthermore, a close inspection of the curves at the paramagnetic regime reveals an additional anomaly which is related with JT distortion observed in the crystal structure data (see inset of Fig. 10). This anomaly is more pronounced for sample, its signature reduces as increases and finally becomes hard to discern for the samples with . The anomaly in the magnetic measurements at is seen more clearly in the inverse susceptibility data (see lower panels of Fig. 10 and Fig. 11). Comparing these data one can clearly see that the jump of at is transformed to a slope change as increases. The particular change at for the samples may mark a change of JT transition from first to second order.

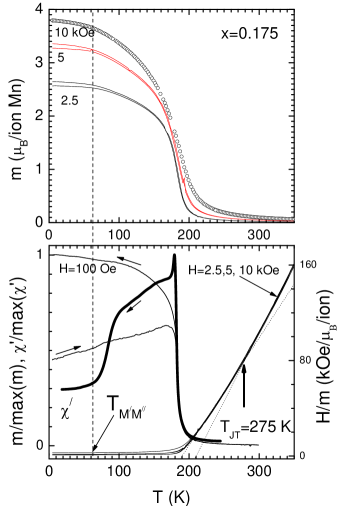
Above and below , can be fitted by a straight line implying a Curie-Weiss law (. The Curie constant is given by , where is the number of magnetic ions inside the unit cell, is the unit cell volume, ( is the Landé factor, is Bohr magneton, the spin of the ion, is Boltzmamn’s constant and is the Weiss constant. Since is nearly parallel above and below it is reasonable to attribute this change to . Therefore, since (where is the exchange coupling) the abrupt change in the may be related to a discontinuous change of above and below . The O/ phase has larger exchange constants in comparison to the M/ one. The intersection of with the temperature-axis, for gives a K, in good agreement with the Curie temperature estimated from neutron data (vide infra). From the Curie constant we estimate magnetic moment per ion which is . This value is in disagreement with the one theoretically expected for an appropriate, random mixture of Mn+3 and Mn+4 ions, , where and for Mn+3 and Mn+4 respectively. Enhanced paramagnetic effective moment has also been observed in Sr-based compound and has been attributed to magnetic clusters.nogues01 ; nojiri99 The larger effective magnetic moment of the M/ phase for may be related with the idea of magnetic polaron that ”survives” in the regime . We must note that this state is more relevant when the system moves away from the CAF regime. Finally, it is interesting to note the similarity of our bulk magnetic moment data with those of Refs. nogues01, ; nojiri99, referring to the Sr-compound. There is however a distinct difference below . Our ac susceptibility, reduces significantly for , while in the Sr-case it increases in a stepwise fashion. This ”fine” difference may imply that the M// states of Ca and Sr compounds are different. The orthorhombic strain and the long in-plane Mn-O2 distance reduction is very similar but the ordered magnetic moment, bulk magnetic moment and ac susceptibility show opposite change at .

Let us present now the neutron diffraction data related with the magnetic structure. The magnetic structures for all the samples are best monitored by observing the neutron diffraction patterns, using data from E6 instrument with Å. Fig. 12 show portions of neutron diffraction patterns in the region where the magnetic coherent intensity is maximum for sample. Similar data were also collected for the other samples. In all samples we observed an increasing of the Bragg intensity for the peaks and for , something which is compatible with the development of long range ferromagnetic order. In addition, the samples and 0.13 show the characteristic magnetic peaks of the antiferromagnetic structure. The most pronounced magnetic Bragg peak of the A-magnetic structure is the located at . As increases, the area of this peak at K reduces, implying that the antiferromagnetic ordered moment reduced and finally becomes zero for . We refined the sample, where the pronounced orthorhombicity enables us to safely determine the spin components along the three axes. The lower panel of Fig. 12 shows a decomposition of the neutron diffraction pattern at K, which consists of the patterns coming from the A-type antiferromagnetic, the ferromagnetic and the crystal structure patterns. The inset of the lower panel of Fig. 12 shows the calculated patterns of models and ( denotes ferromagnetic moment along -axis and magnetic moment along -axis which follows the A-antiferromagnetic structure). The agreement between the theoretical and experimental profile is better for the model. This magnetic model is closely connected with the canted magnetic structure observed in the LaMnO3 compound.moussa96 Similarly, for sample, except for the major ferromagnetic component, small intensity coming from -type antiferromagnetic structure is present. In addition, the negligible intensity of the magnetic peak, implies that the ferromagnetic component cannot be parallel with -axis. Therefore there are two possibilities. The first is the antiferromagnetic component to be parallel with the -axis, while the ferromagnetic component parallel with and axis. The second possibility is both the antiferromagnetic and part of the ferromagnetic component to be parallel with -axis. Since it is not possible to have simultaneous ferromagnetic and antiferromagnetic spin components along the -axis in the same domain these two different magnetic states concern different domains. This finding is not strange since in this concentration regime the phase boundary separating the CAF and FMI ground states exists.
For the sample the NDP at K shows only ferromagnetic magnetic peaks. The orthorhombicity of the sample permits the calculation of the orientation of the magnetic moment in respect of the crystallographic axes. Thus, the case -axis should be excluded. If the magnetic moment was along the -axis the magnetic contribution at the peak should be zero. Based on the best agreement between observed and theoretically calculated profiles we conclude that the ordered magnetic moment should be lie on the -plane with its larger component along the -axis. Nevertheless, a small component along the -axis cannot be totally excluded. The ordered magnetic moments as estimated from Rietveld refinements for the and 0.175 samples are plotted in the lower panels of Figs. 2, 3 and 4, respectively. A weak but distinctive anomaly is present in the temperature variation curves of the ordered magnetic moments at . It is imperative to note that for the ordered magnetic moment curve, for and 0.175 samples, displays a small slope change. For samples and 0.13 where we can detect the magnetic peak from the type magnetic structure, this anomalous behavior certainly is related with the antiferromagnetic component. For it is possible that a small percentage of the spin of Mn ions may prefer a glass like behavior for , as the ac susceptibility measurements show.markovich02a Concerning this ”strange” magnetic component it is not clear how it is connected with the structural transition at the same temperature. One could invoke the idea of the phase separation to explain this behavior, however, the bulk character of the concomitant structural transition at is not so favorable for this interpretation. Based on the experimental data one may say that the structural transition prevents some part of the Mn-spin to participate in the long-range ordering.markovich02a ; pissas04a This structural transition should be related with the orbital degree of freedom in agreement with Mössbauerpissas04b and NMRpapavassiliou03 data.
VI Discussion
Unexpectedly, the space group has been used by Lobanov et al.,lobanov00 in order to describe the crystal structure for a sample with nominal stoichiometry La0.85Ca0.15MnO3 prepared by liquid road and final reaction temperature 900oC. However, although this space group is the same with that used in our study, several differences exist. More specifically: (a) The ac susceptibility and resistivity data are different. (b) The sample of Lobanov et al.,lobanov00 does not show the pseudo-orthorhombic splitting seen in our data and in the La1-xSrxMnO3 compound. The lattice parameters follow a monotonic temperature variation, contrary to ours. (c) The particular arrangement of the short bonds of Mn1-O and Mn2-O is different with it deduced from our data. Since no more data, from samples prepared with method of Ref. lobanov00, , are available, we cannot safely further comment on the possible relation between the two studies.
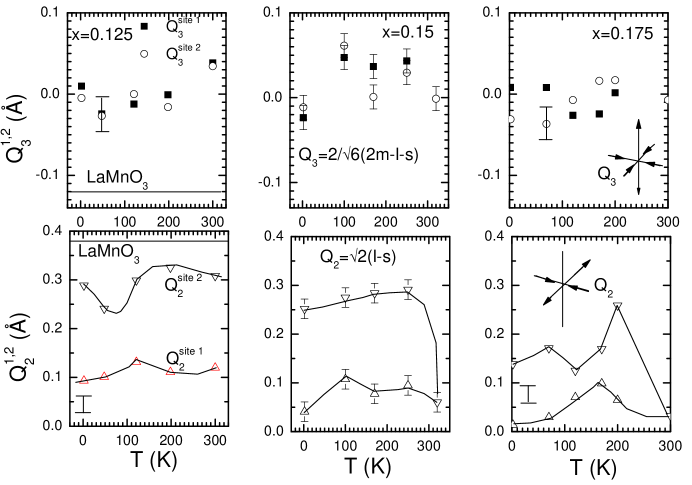
It is interesting to discuss our crystal structure data in terms of the normal coordinateskanamori60 of the octahedral complex MnO6, and . An arbitrary orbital state can be written as . The orbitals and correspond to the states and respectively. It is also possible, the orbitals (, ) and ( , ) to be formed. In this case we have and , respectively. Experimentally the orbital filling can be estimated from crystallographic data, through the Mn-O bond lengths using the equationkanamori60 ; kugel82 , where and . Here and mean long, medium and short Mn-O bond lengths, respectively. mode mixes the and orbitals and produces a two sublattice orbital ordering pattern, with a lower energy orbital and a higher energy orbital ( is referring to the two sublattices).
Using the crystallographic data at K of LaMnO3 (Ref. carvajal98, ) one finds, Å and Å. These values correspond to a canted antiferromagnet like orbital arrangement with two sublattices, with , respectively. Based on the crystallographic data of the present study we calculated the and parameters for the two cites predicted from structural model. Fig. 13 shows the temperature variation of and for the and 0.175 samples. With solid lines we also plot the values which correspond to the LaMnO3 compound. The first comment which can be made is that both and parameters for the two sites have lower values, in comparison to these of the LaMnO3 compound. The second one is that, both Mn sites have with the first displaying a high value while the second a moderate one. Since we only have a small number of data it is difficult to recognize any change at . The third comment is that, only the sample shows non monotonous variation of at . We note that for the two sites pattern collapse into one site, with both and modes takng values near zero.
VI.1 The comparison with Sr-compound
First of all, we must point out the similarities between the Sr and Ca based compounds, by comparing the neutron data from the stoichiometric La1-xSrxMnO3 () of Dabrowski et al.dabrowski99 ; xiong99 with ours. As Dabrowski et al. have pointed out,dabrowski99 the phase diagrams of the Sr case reported in the recent literature were constructed using physical and structural information obtained for dissimilar samples. Specifically, in the doping regime of Sr-compound the structure can form vacancies on both the A(La,Sr) and B(Mn) sites during synthesis under oxidizing conditions. Formation of equal number of vacancies on the A and B sites would increase the average Mn oxidation state. Let us discuss our results with those of single crystal data of La7/8Sr1/8MnO3 compound (this concentration is the most representative and widely studied of the particular regime) where very interesting results are available.
In a recent resonant x-ray scattering study on a La7/8Sr1/8MnO3 single crystal, Geck et al.,geck04 have shown that the orbital state occurring in the interval , (M means monoclinic and T triclinic) is similar to that found in LaMnO3. For an orbital reordering is compatible with the resonant data. This groupgeck04 observed non zero resonant and nonresonant intensity at (3/2, 3/2, 3) superlattice reflection, only for . The nonresonant scattering in the particular reflection implies some kind of a superstructure modulation that develops at . Such behavior is related to structural and electronic degrees of freedom, speculatively attributed to the orbital polarons formation.mizokawa00 ; kilian98 The work of Geck et al.,geck04 further supports the aspect that the CAF and FMI phases of Ca and Sr based La1-x(Ca,Sr)xMnO3 compounds have both common characteristics, and distinct differences. It seems that the vertical boundary of the Sr-case that separates the O/ CAF ground state from the triclinic new unknown orbital state exists even in the Ca-case. Our results show that: (a) Similar to the Sr compound for the structure is monoclinic . (b) Based on our high resolution synchrotron x-ray diffraction data, the crystal structure of the Ca case remains monoclinic, while in the Sr case it is triclinic and (c) both families of compounds exhibit significantly lower JT distortion in comparison with the M/ phase which occurs for .
VI.2 Comparison between stoichiometric and cation deficient samples
We would like to emphasize once again that our results concern stoichiometric samples. The stoichiometric samples have properties different from those prepared in air. huang98 ; pissas04a ; dai96 The most prominent differences between the two families of samples are that the oxygen deficient samples do not display the CAF structure and do not undergo the characteristic cooperative JT distortion, irrespectively of the nominal calcium concentration. The second difference makes the cation deficient samples to be in an orbital liquid state below , in the FMI regime, contrary to the stoichiometric ones where the ferromagnetic phase takes place in the cooperative ordered JT state at least in the interval . In addition, the cation deficient samples (e.g. sampleshuang98 ; dai96b ) show an almost monotonous variation with temperature of the unit cell parameters, satisfying also the inequality (for ), contrary to the behavior observed in our stoichiometric samples where a pronounced non monotonous variation is observed. It is now well established that for low Ca concentrations the air prepared samples have cation vacancies.pissas04a ; dabrowski99a ; roosmalen94 The amount of vacancies increases as the nominal Ca concentration is near . These samples are ferromagnetic irrespectively of . The ordered magnetic moment at zero temperature is significantly lower than the corresponding moment of the stoichiometric samples. For the and 0.15 non stoichiometric samples the ordered magnetic moment was found (Refs. huang98, ; dai96b, ; algarabel03, ), while in our stoichiometric samples are obtained .
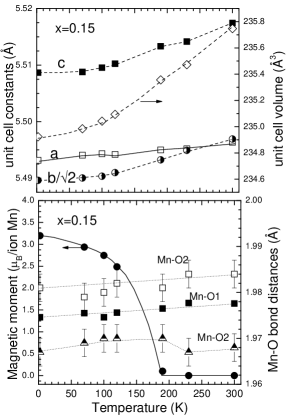
In order to check once more the situation we selected the sample, prepared in air for a detailed structural characterization using neutron diffraction data. Fig. 14 shows the temperature variation of the unit cell parameters (upper panel), the ordered magnetic moment and the Mn-O bond lengths (lower panel), as they were deduced from neutron diffraction data using E9 instrument. In perfect agreement with the above, this sample is ferromagnetic insulator without the orthorhombic splitting that characterizes the cooperative JT distortion of the reduced samples. Interestingly, the ordered magnetic moment is lower than the one of the reduced samples (e.g 3.2 vs 3.7).
In the work of Algarabel et al.algarabel03 that concerns a cation deficient sample with nominal , significant small angle neutron scattering intensity ( due to nanometric clusters) has been found to coexist with the long-range ferromagnetic phase. In our opinion, it is difficult to correlate this nanometric clusters with the anomalies observed for in the stoichiometric samples because these clusters may be related with cation vacancies. It seems that in samples prepared in air the ratio is controlled by the partial oxygen pressure. When these samples are cooled slowly during the final preparation step the is different from the nominal Ca concentration, . In order the electric charge neutrality to be maintained, cation vacancies are created. This effect is significant for . Therefore, in order to produce stoichiometric samples we must use reduced atmosphere conditions or quench the sample from high temperature to liquid N2.pissas04a ; dabrowski99a ; roosmalen94 The presence of cation vacancies completely destroys the coherent JT distortion even for the sample.pissas04a In the cation deficient samples firstly, it seems that the is locked to a nearly independent value, and secondly the M/ phase which concerns a coherent JT distortion cannot be formed due to the cation vacancies. In this context numerous experiment results in the particular Ca regime should be interpreted. It is a mystery why the cation deficient samples show similar bulk magnetic measurements near K as the stoichiometric ones. The stoichiometric samples display a structural transition at , therefore it is reasonable to correlate this anomaly with the particular shape of the curves obtained in dc magnetic and ac-susceptibility measurements. For non stoichiometric samples such structural anomaly is absent leaving open the question about the relation of the bulk magnetization anomaly among the two families of samples.
Summarizing, the crystal structure refinements , from stoichiometric samples of the La1-xCaxMnO3 compound in the FMI regime, are presented. All the samples () undergo a structural transition from O* to M/ structure at . High resolution x-ray diffraction data revealed that for , La1-xCaxMnO3 compounds () have monoclinic symmetry. The major structural characteristic of this model is the two Mn sites. As the bond lengths are concerned the Mn2 site displays properties similar with those of the Mn site of the LaMnO3 compound, while the Mn1 site, resembles the Mn site in the FMM regime. By further cooling, below the characteristic temperature , although, the structure remains the same, a strong reduction of the strain parameter is observed. This change has been accompanied by significant reduction of the monoclinic angle and is correlated with distinct changes in dc and ac magnetic measurements.
Acknowledgements.
This work was partial supported from EU through the CHRX-CT93-0116 access to large-scale facilities project.References
- (1) Author to whom correspondence should be addressed. email: mpissas@ims.demokritos.gr
- (2) D. Khomskii and G. Sawatzky, Solid State Comm. 102, 87 (1997).
- (3) L. Pinsard, J. Rodríquez-Carvajal, A. H. Moudden, A. Anane, A. Revcolevschi, C. Dupas, Physica B 234-236, 856 (1997).
- (4) Y. Endoh, K. Hirota, S. Ishihara, S. Okamoto, Y. Murakami, A. Nishizawa, T. Fukuda, H. Kimura, H. Nojiri, K. Kaneko, and S. Maekawa, Phys. Rev. Lett. 82,4328 (1999).
- (5) Y. Yamada, J. Suzuki, K. Oikawa, S. Katano, J. A. Fernandez-Baca, Phys. Rev. B 62, 11600 (2000).
- (6) A. M. Glazer, Acta Cryst. B 28, 3384 (1972); A. M. Glazer, Acta Cryst. A 31, 756 (1975);C. J. Howard and H. T. Stokes, Acta Cryst. B 54, 782 (1998); P. M. Woodward, Acta Cryst. B53, 32 (1997); P. M. Woodward, Acta Cryst. B 53, 44 (1997).
- (7) As the present study reveals that the true structure below the is monoclinic, we prefer to keep the symbols O/ and O// in order to help the reader to compare our results with those of other studies.
- (8) J. Kanamori, J. Appl. Phys. 31, 14S (1960).
- (9) K. I. Kugel’ and D. I. Khomskii, Sov. Phys. Usp. 25, 231 (1982).
- (10) M. Pissas and G. Papavassiliou J. Phys.: Condens. Matter 16, 6527 (2004).
- (11) B. Dabrowski, R. Dybzinski, Z. Bukowski, and O. Chmaissem, J. Solid State. Chem. 146 448, (1999).
- (12) J. A. M. van Roosmalen, E. H. P. Cordfuke, E. B. Helmholdt and H. W. Zandbergen, J. Solid State. Chem. 146 448, (1999).
- (13) J. Rodríquez-Carvajal, Physica B 192, 55 (1993).
- (14) B. H. Toby, J. Appl. Cryst. 34,210 (2001).
- (15) A. C. Larson and R. B. Von Dreele, General Structure Analysis System (GSAS), Los Alamos National Laboratory Report LAUR 86-748 (2000).
- (16) L. W. Finger, D. E. Cox, A. P. Jephcoat, J. Appl. Cryst. 27,892 (1994).
- (17) G. Biotteau, M. Hennion, F. Moussa, J. Rodríguez-Carvajal, L. Pinsard, A. Revcolevschi, Y. M. Mukovskii, and D. Shulyatev, Phys. Rev. B 64, 104421 (2001).
- (18) J. Rodríguez-Carvajal, M. Hennion, F. Moussa, A. H. Moudden, L. Pinsard and A. Revcolevschi, Phys. Rev. B 57, R3189, (1998).
- (19) D. E. Cox, T. Iglesias, and E. Moshopoulou, K. Hirota, K. Takahashi, and Y. Endoh, Phys. Rev. B 64, 024431 (2001)
- (20) P. W. Stephens J. Appl. Cryst., 32,281 (1999).
- (21) M. J. Calderon, A. J. Millis, K. H. Ahn, Phys. Rev. B, 68 100401(R) (2003).
- (22) K.H. Ahn, T. Lookman and A. R. Bishop, Nature, 428, 401 (2004).
- (23) P. G. Radaelli, D. E. Cox, M. Marezio and S-W. Cheong, Phys. Rev. B 55, 3015 (1997); P. G. Radaelli, G. Iannone, M. Marezio, H. Y. Hwang, S-W. Cheong, J. D. Jorgensen, D. N. Argyriou, Phys. Rev. B 56, 8265 (1997).
- (24) J. Nogué s, Vassil Skumryev, J. S. Muñoz, B. Martínez, J. Fontcuberta, L. Pinsard and A. Revcolevschi, Phys. Rev. B 64, 024434 (2001).
- (25) H. Nojiri, K. Kaneko, M. Motokawa, K. Hirota, Y. Endoh, K. Takahashi, Phys. Rev. B 60, 4142 (1999). 980-8578,
- (26) F. Moussa, M. Hennion, J. Rodríguez-Carvajal, H. Moudden, L. Pinsard and A. Revcolevschi, Phys. Rev. B 54, 15149 (1996); Q. Huang, A. Santoro, J. W. Lynn, R. W. Erwin, J. A. Borchers, J. L. Peng and R. L. Greene, Phys. Rev. 55, 14987 (1997).
- (27) V. Markovich, E. Rozenberg, A. I. Shames, G. Gorodetsky, I. Fita, K. Suzuki, R. Puzniak, D. A. Shulyatev and Ya. M. Mukovskii, Phys. Rev. B 65, 144402 (2002).
- (28) M. Pissas, G. Papavassiliou, E. Devlin, A. Simopoulos, V. Likodimos, cont-mat/0403446.
- (29) G. Papavassiliou, M. Pissas, M. Belesi, M. Fardis, J. Dolinsek, C. Dimitropoulos, and J. P. Ansermet, Phys. Rev. Lett. 91, 147205 (2003).
- (30) M. V. Lobanov, A. M. Balagurov, V. Ju. Pomjakushin, P. Fischer, M. Gutmann, A. M. Abakumov, O. G. Dyachenko, E. V. Antipov, O. I. Lebedev, and G. Van Tendeloo, Phys. Rev. B,61,8941 (2000).
- (31) B. Dabrowski, X. Xiong, Z. Bukowski, R. Dybzinski, P. W. Klamut, J. E. Siewenie, O. Chmaissem, J. Shaffer, C. W. Kimball, J. D. Jorgensen and S. Short, Phys. Rev. B 60, 7006 (1999).
- (32) X. Xiong, B. Dabrowski, O. Chmaissem, Z. Bukowski, S. Kolesnik, R. Dybzinski,C. W. Kimball, and J. D. Jorgensen, Phys. Rev. B 60, 10186 (1999).
- (33) J. Geck, P. Wochner, D. Bruns, B. Büchner, U. Gebhardt, S. Kiele, P. Reutler, and A. Revcolevschi, Phys. Rev. B 69, 104413 (2003).
- (34) T. Mizokawa, D.I. Khomskii, and G.A. Sawatzky, Phys. Rev. B 61, R3776 (2000).
- (35) R. Kilian and G. Khaliullin, Phys. Rev. B 58, 11841(R) (1998).
- (36) Q. Huang, A. Santoro, J. W. Lynn, R. W. Erwin, J. A. Borchers, J. L. Peng, K. Ghosh and R. L. Greene, Phys. Rev. B 58, 2684 (1998); Q. Huang, A. Santoro, J. W. Lynn, R. W. Erwin, J. A. Borchers, J. L. Peng, and R. L. Greene, Phys. Rev. B 55, 14987 (1998); J. W. Lynn, R. W. Erwin, J. A. Borchers, Q. Huang, A. Santoro, J-L. Peng and Z. Y. Li, Phys. Rev. Lett. 76, 4046 (1996).
- (37) P. Dai, J Zhang, H. A. Mook, S.-H. Liou, P. A. Dowben, E. W. Plummer, Phys. Rev. B 54, R3694, (1996).
- (38) P. Dai, J. Zhang, H.A. Mook, F. Foong, S.-H. Liou, P. A. Dowben and E. W. Plummer, Sol. St. Comm.100, 865 (1996).
- (39) P.A. Algarabel, J. M. De Teresa, J. Blasco, M. R. Ibarra, Cz. Kapusta, M. Sikora, D. Zajac, P. C. Riedi and C. Ritter, Phys. Rev. B 67, 134402 (2003).