Kinetic energy change with doping upon superfluid condensation in high temperature superconductors
Abstract
In conventional BCS superconductors, the electronic kinetic energy increases upon superfluid condensation (the change is positive). Here we show that in the high critical temperature superconductor Bi2Sr2CaCu2O8+δ, crosses over from a fully compatible conventional BCS behavior () to an unconventional behavior () as the free carrier density decreases. If a single mechanism is responsible for superconductivity across the whole phase diagram of high critical temperature superconductors, this mechanism should allow for a smooth transition between such two regimes around optimal doping.
One of the fundamental predictions of the BCS theory is that the kinetic energy of the charge carriers increases upon condensation in the superconducting state, while the interaction energy decreases and overcompensates the kinetic energy increase, resulting in a net energy gain. The value of this condensation energy is easily determined, for instance from the value of the thermodynamical critical field, but the respective changes in kinetic and interaction terms are not easily accessed. In fact, the change in kinetic energy in “conventional” BCS superconductors has never been determined experimentally. This change is of the order of , where is the energy gap and the Fermi energy. It is exceedingly small for a typical low temperature superconductor, of the order of to .
The situation is much more favorable in High Critical Temperature Superconductors (HCTS, cuprates), where the gap is larger and the Fermi energy smaller, so that the change in kinetic energy, if it is conform to the predictions of the BCS theory, should be of the order of to , a change that has become accessible experimentally R1 ; R2 ; R3 . However, the mechanism for HCTS is still under debate and the change in kinetic energy could well be different from that predicted by BCS, including in sign.
It is of particular interest to investigate the case of overdoped high temperature superconductors. There is a general belief that in the overdoped range, the cuprates can be described in their normal state as Fermi liquids. Thus it is conceivable that in this regime, condensation is of the BCS kind. And if it is, according to the above considerations regarding orders of magnitude, the change in kinetic energy should be large enough to be measured, allowing a quantitative comparison between theory and experiment.
Our analysis shows that the change in kinetic energy in overdoped Bi2Sr2CaCu2O8+δ (Bi-2212) having K is indeed compatible with the predictions of the BCS theory, both in sign and in size. The latter result appears in the data in our previous papers, but was not explicitly mentioned R2 ; R3 . This is in contrast with the change of kinetic energy in optimally doped, and definitely in underdoped Bi-2212, which has been found to be of the opposite sign R1 ; R2 ; R3 . We observe that going from the overdoped to the underdoped regime, the change in kinetic energy is actually progressive, going through zero not far from optimum doping. This progressive change strongly suggests that there is in the cuprates a smooth transition from a conventional mode of condensation in the overdoped regime to an unconventional mode in the underdoped one.
We recall that from measurements of the reflectivity, one can derive the real part and the imaginary part of the optical conductivity. The single band sum rule R4 writes:
| (1) |
where is the electron charge, the in-plane lattice constant, the volume of the unit cell. is given by:
| (2) |
where is the number of vectors, is the dispersion from the kinetic energy part of the hamiltonian, and is the momentum distribution function.
In a nearest neighbor tight binding model, the kinetic energy is related to :
| (3) |
It was argued that relation (3) is still valid (however within %) when taking into account the second nearest neighbor hopping R5 .
The optical conductivity is generally derived experimentally from a Kramers-Kronig transform of the reflectivity R6 , or by fitting the reflectivity R2 ; R3 or more accurately by a combination of ellipsometric measurements in the visible supplemented by infrared and visible reflectivity R1 . Two difficulties arise when computing the spectral weight defined in Eq.1, related to the limits of the integral: i) one has to choose a cut-off frequency in order to avoid including interband transitions which are irrelevant to the calculation of the kinetic energy, ii) the optical conductivity cannot be derived starting from zero: one is restricted at best to the experimental lowest frequency.
The choice of the high frequency cut-off is a difficult problem: it is generally agreed to select a cut-off significantly below the energy of the charge transfer band, located at typically 1.5 eV. Therefore according to the authors, eV R1 ; R2 ; R3 ; R7 . We have calculated the spectral weight for various cut-off energies in this range. It changes with the cut-off but the trend as a function of doping is robust. In the following, we will show data for a 1 eV cut-off. The uncertainty on the spectral weight is % in this range R8 . The low limit can be dealt with by fitting the reflectivity and using the deduced optical conductivity in order to extrapolate to zero R2 ; R3 . In the superconducting state, the spectral weight includes the superfluid weight which is extracted from the data [9] or inferred from the fit R2 ; R3 .
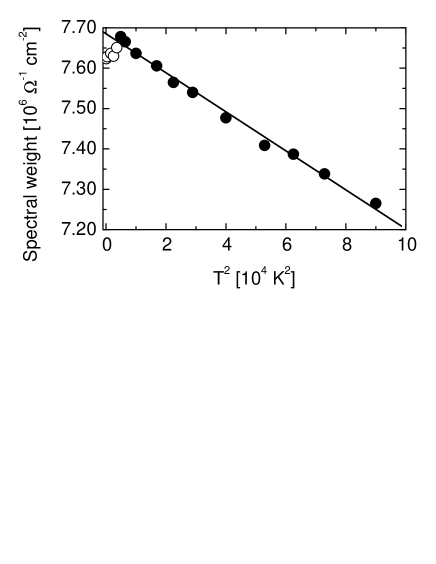
We show in figure 1 the change of spectral weight as a function of , for an overdoped Bi-2212 sample, after reconstructing the optical conductivity through a well controlled fitting procedure from the reflectivity of a thin film R3 ; R8 . The spectral weight integral (Eq.1) has been extended up to 1 eV (8000 cm-1). In the normal state, it is linear in . The change from room temperature down to is of about 5%. At , a change in sign of the slope of the temperature dependence of the integral, corresponding to an increase in kinetic energy, is observed very clearly. By extrapolating the temperature dependence in the normal state down to following the behavior found above , one can obtain the value of the difference between the kinetic energy in the normal and superconducting states in that limit. We find that it is of about 1%.
According to BCS theory, the increase in kinetic energy in the superconducting state per unit volume is given by:
| (4) |
where is the density of states at the Fermi level, and the interaction parameter. Because is in any case substantially smaller than unity, we neglect at first the second term of the right hand side. We then obtain:
| (5) |
where is the kinetic energy in the normal state at . The quantity is precisely that measured experimentally following the procedure described above. Taking the values meV and meV R10 , we obtain , not an unreasonable value. A slightly higher value of is obtained by taking into account the condensation energy, i.e the second term of the right hand side of Eq.4, as measured for instance by Loram R11 . The measured change in kinetic energy for this overdoped sample is thus in good agreement with BCS theory, both in sign and in value.
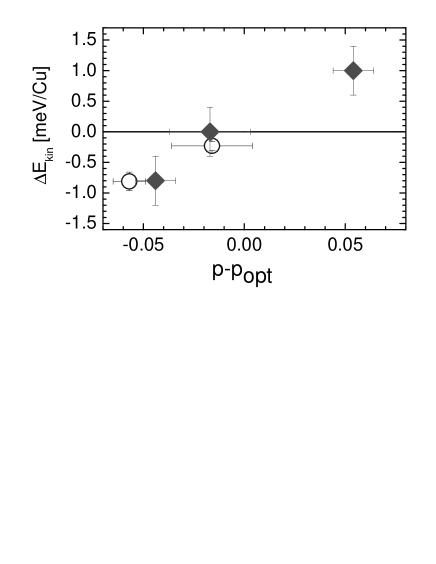
We now turn to a comparison between the behavior of the overdoped sample, and that of optimally and underdoped samples. In the normal state, the change in kinetic energy with temperature is somewhat smaller (4%) but close to that of the overdoped sample R1 ; R2 ; R3 . However, upon condensation, there is now a relative decrease in kinetic energy of about % for close to optimally doped R1 or about 0 within the error bars R2 ; R3 , and of % R1 ; R12 or % R3 ; R13 for underdoped samples. The transition between the BCS and unconventional regimes thus appears to be progressive: Figure 2 shows the change (in meV/Cu) as a function of R14 , through
| (6) |
where is the charge per Cu atom, and corresponds to the maximal critical temperature R15 .
The case of the overdoped sample is clear. The kinetic energy increases in the superconducting state by an amount compatible with a BCS condensation. This result is in line with the observation that the full spectral weight in the superconducting state is recovered, within , at an energy equal to a few times the gap, as shown in R2 ; R3 . By contrast, for the underdoped sample, the full spectral weight is clearly only recovered at energies of more than 1 eV, or about 40 times the gap, and the kinetic energy now decreases in the superconducting state R2 ; R3 . Both in terms of the change in kinetic energy and rate of recovery of the spectral weight, nearly optimum doped samples are intermediate between the overdoped and the underdoped ones: the change in kinetic energy is small. This doping dependence suggests a smooth transition from a BCS mode of condensation in the overdoped regime to a different mode in underdoped samples, as one would expect for instance in the case of a BCS to Bose-Einstein crossover R16 .
In the case of YBa2Cu3O6+x (YBCO), we are not aware of any measurement in overdoped samples. In underdoped YBa2Cu3O6.6, an unconventional energy scale (of about 0.6 eV) for recovering the full spectral weight was found R17 . In optimally doped samples, the change in kinetic energy is definitely small R17 ; R18 .
While much theoretical and experimental emphasis has been given in previous works to the unconventional behavior of the kinetic energy change in underdoped samples, the full compatibility of the behavior of overdoped samples with a BCS mode of condensation has been so far overlooked. Most important, the sign and size of upon condensation in the superconducting state and the rate of recovery of the spectral weight point simultaneously towards a progressive change in the condensation regime when going from underdoped to overdoped. Such an overall behavior shows that the high- mechanism, if it is the same across the phase diagram, must allow for the observed transition from kinetic energy loss to kinetic energy increase as doping is increased.
Acknowledgements.
One of us (G.D.) wishes to acknowledge the support of ESPCI through Chaire Paris-Sciences during the course of this work, as well as the support of the Oren Family Chair of Experimental Solid State Physics.References
- (1) H. J. A. Molegraaf et al., Science 295, 2239 (2002).
- (2) A.F. Santander-Syro et al., Europhys. Lett 62, 568 (2003).
- (3) A.F. Santander-Syro et al., Phys. Rev. B 70, 134504 (2004).
- (4) M. Norman and C. Pépin, Rep. Prog. Phys. 66, 1547 (2003).
- (5) D. van der Marel et al., condmat/0302169 (2003).
- (6) D. Tanner and T. Timusk, Optical properties of high temperature superconductors, in “Physical Properties of High Critical Temperature Superconductors III”, Ed. D. Ginsberg , World Scientific, Singapore (1992).
- (7) A. J. Millis et al., condmat/0411172 (2004).
- (8) A. Zimmers, PhD thesis (unpublished).
- (9) S. Dordevic et al., Phys. Rev. B 65, 134511 (2002).
- (10) M. R. Norman et al., Phys. Rev. B 52, 615 (1995).
- (11) J. W. Loram et al., Physica C 341-348, 831 (2001).
- (12) Reference R1 displays data on an “optimally doped” Bi-2212 single crystal with K, whereas at optimal doping, Bi-2212 crystals easily achieve K. We have assumed here that this particular sample is slightly underdoped.
- (13) The normal state spectral weight follows a dependence from room temperature down to 100 K in the underdoped sample of Ref.R1 , whereas its value saturates below 150 K in Ref.R3 . We extrapolated the normal state spectral weight down to using the behavior in Ref.R1 and the saturated value in Ref.R3 .
- (14) A similar graph was shown in M. Norman and C. Pépin, Phys. Rev. B 66, 100506(R) (2002), where has been calculated versus doping in a specific model. However, our experimental data shown in this graph were taken from Ref.R2 , where the positive sign of in the overdoped sample was overlooked.
- (15) J. L. Tallon and J. W. Loram, Physica C 349, 53 (2001).
- (16) P. Nozières and S. Schmitt-Rink, J. Low. Temp. Physics 59, 195 (1985); A. Leggett, in Modern Trends in the theory of condensed matter, Ed. A Bekalksky and J. Przyspawa (Springer Verlag, 1980), pp.13-27.
- (17) C. C. Homes et al., Phys. Rev. B 69, 024514 (2004).
- (18) The sign of in underdoped and close to optimally doped Bi-2212 (Ref.R1 ; R2 ; R3 ) has been challenged by Boris et al., Science 304, 708 (2004). These authors present a quantitative analysis for optimally doped YBCO and claim a similar behaviour for slightly underdoped Bi-2212. Their analysis and the resulting conclusions are objected by D. van der Marel (private communication), A.F. Santander-Syro and N. Bontemps.