Adsorption-Induced Distortion of F16CuPc on Cu(111) and Ag(111):
An X-ray Standing Wave Study
Abstract
The adsorption geometry of perfluorinated copper-phthalocyanine molecules (F16CuPc) on Cu(111) and Ag(111) is studied using X-ray standing waves. A detailed, element-specific analysis taking into account non-dipolar corrections to the photoelectron yield shows that on both surfaces the molecules adsorb in a lying down, but significantly distorted configuration. While on copper (silver) the central carbon rings reside Å (Å) above the substrate, the outer fluorine atoms are located Å (Å) further away from the surface. This non-planar adsorption structure is discussed in terms of the outer carbon atoms in F16CuPc undergoing a partial rehybridization ().
pacs:
68.49.Uv, 68.43.Fg, 79.60.FrI Introduction
The adsorption of organic molecules on various surfaces has become a subject of wide interest. With the realization of new organic based semiconductor devicesforrest_apl01 ; bao_jacs98 it has been recognized that the first molecular layer of organic thin films strongly influences their structural and electronic properties. Hence increasing efforts are being made to improve our still fragmentary understanding of the complex interaction of aromatic molecules with metal substrates. A variety of surface sensitive techniques are being used to explore organic thin films in the monolayer regime. Low energy electron diffraction (LEED)braun_ss01 ; breitbach_ss02 , photoelectron diffraction (PED)schaff_ss96 ; kang_ss00 , and scanning tunneling microscopy (STM)lippel_prl89 ; chizhov_la00 ; grand_ss96 ; boehringer_prb97 , for example, have been successfully employed in this area.
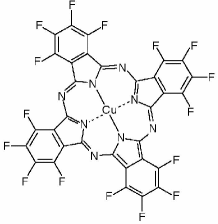
When studied in more detail, aromatic molecules exhibit a non-trivial adsorption behavior, benzene on various substrates being the simplest and best-studied example.braun_ss01 ; breitbach_ss02 ; schaff_ss96 ; kang_ss00 Because of the relatively strong adsorbate-substrate interaction on metals organic compounds may undergo structural changes upon adsorption.braun_ss01 ; kang_ss00 In this context we chose to study perfluorinated copper-phthalocyanine (F16CuPc, see Fig. 1a) on Cu(111) and Ag(111) using the X-ray standing-wave (XSW) technique.zegenhagen_ssr93 ; bedzyk_review ; vartanyants_rpp01 ; cheng_prl03 ; kilian_prb02
As one of the best air-stable organic n-type semiconductors F16CuPc is a very promising material for future applications.forrest_apl01 ; bao_jacs98 The adsorption of F16CuPc, i.e. the bonding distances and possible distortions resulting from the interaction with the metal electrons, is very relevant as the charge transfer from and into the metal strongly depends on the structure of the first molecular layer.
This paper is organized as follows: In Sec. II we describe the experimental setup and procedures. Sec. III presents our XSW results on F16CuPc with particular emphasis on the data analysis and non-dipolar contributions. In Sec. IV we discuss several aspects and implications of the results. Sec. V concludes this work with a brief summary.
II Experimental Details
II.1 General
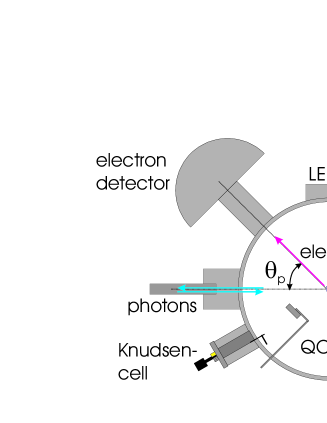
The experiments were carried out at beamline ID32 of the European Synchrotron Radiation Facility (ESRF) in Grenoble, see Fig. 1b for details of the experimental setup. The molecular films of F16CuPc were prepared and studied in situ using a multi-purpose ultra-high vacuum chamber with several analytical components (base pressure mbar).
II.2 Sample preparation
The Cu(111) and Ag(111) single crystals were mounted on a variable-temperature, high-precision manipulator. Repeated cycles of argon ion bombardment and annealing at K resulted in clean and largely defect-free surfaces as has been verified by XPS and LEED measurements. The F16CuPc material supplied by Aldrich Chemical Co. was purified by gradient sublimation. Using a thoroughly outgassed Knudsen cell the molecules were evaporated at typical rates of less than 1 ML/min with the substrate at K. Each evaporation process was controlled with a calibrated quartz crystal microbalance close to the substrate.
II.3 Data acquisition
While the photon energy was scanned through the first order back-reflection condition for Cu(111) and Ag(111) around 2980 eV and 2630 eV, respectively, X-ray standing wave signals were recorded. For this purpose a vertically mounted hemispherical electron analyzer (Physical Electronics) at an angle of relative to the incoming X-ray beam acquired series of energy resolved photoemission spectra.
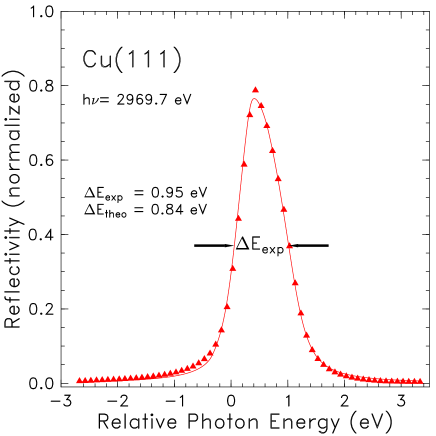
After positioning the sample the X-ray reflectivity was measured with a photodiode mounted at a small angle relative to the incoming beam. As illustrated for Cu(111) in Fig. 2 we observed the first-order Bragg peaks whose position and shape can be described very well within the framework of dynamical diffraction theory. Since noble metal crystals are known to exhibit a certain mosaic spread that broadens the Bragg peak, we always monitored the reflectivity signal to identify a suitable position on the substrate before doing the XSW experiment. Given an intrinsic width of eV derived from dynamical diffraction theory for a defect free crystal we regard the observed value of eV as indication of sufficient crystal perfection.
III Results and Analysis
III.1 Photoemission analysis
In order to extract the XSW signal a thorough analysis of all photoemission spectra is required. As shown in Fig. 3 a Voigt-like asymmetric line shape and an independently scaled Shirley-type background describe the experimental C(1s), N(1s), and F(1s) core-level spectra very well.111The energy level splittings and shake-up states that have been observed on F16CuPc beforeottaviano_jesrp00 cannot be resolved. In particular, we found the careful subtraction of the strongly photon energy dependent inelastic background essential. By taking integrated peak intensities and normalizing to the incoming photon flux we obtained the photoelectron yield datasets which are suitable for the XSW analysis.
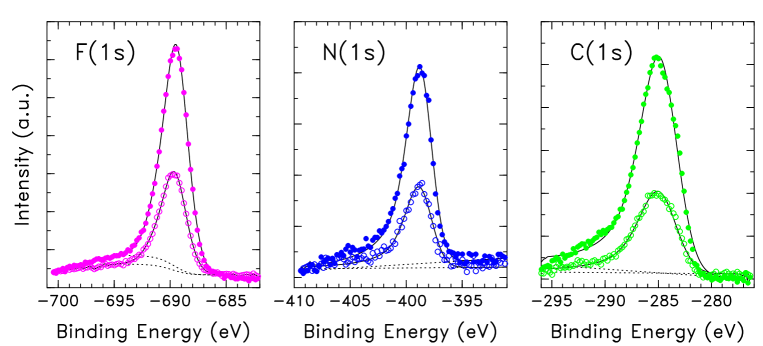
Further insight can be gained from spectroscopic observations on the monolayer system of F16CuPc. Importantly, no significant changes in the peak position or line shapes were observed during the XSW experiment, indicating that the molecules do not fragment due to radiation damage. Moreover, the stoichiometry of the adsorbed molecules can be determined by comparing relative photoemission intensities. After normalizing the integrated off-Bragg intensity by the photoionization cross sections, the core-level lines shown in Fig. 3 give a stoichiometric ratio which corresponds within the error bars to the F16CuPc composition, see Tab. 1. Similarly, the surface coverage in the monolayer regime was calibrated by evaluating intensities of a substrate and adsorbate signal.
| (norm.) | (Mb)222taken from Ref. verner_ant93, | (norm.) | |
|---|---|---|---|
| C(1s) | |||
| N(1s) | |||
| F(1s) |
III.2 XSW analysis
III.2.1 Basic principles
The variation of the photoelectron yield observed from molecular adsorbates while scanning the photon energy through the Bragg condition holds structural information that can be analyzed quantitatively.zegenhagen_ssr93 ; bedzyk_review However, it has been shownjackson_prl00 ; schreiber_ssl01 ; nelson_prb02 that depending on the experimental conditions the dipole approximation of photoemission is not generally applicable to the analysis of X-ray standing wave data. Higher-order terms contributing to the photoemission yield must not be neglected for low-Z elements and typical photon energies of several keV. Therefore the normalized photoelectron yield is not simply proportional to the standing wave intensity, as for the pure dipolar case. Instead, a generalized relationvartanyants_ssc00
| (1) |
that includes first-order corrections has to be used. Here the structural parameters and are the coherent fraction and position related to the Fourier component of the adsorbate atomic density. The photon energy dependent reflectivity is described in terms of its absolute value and phase between the incoming and outgoing waves. and represent the higher-order contributions in the photoemission matrix element.vartanyants_ssc00 Therefore they generally depend on the experimental geometry, the element number, the photon energy, and orbital symmetry of the initial state. Only within the dipole approximation with , , and Eq. (1) reduces to the more familiar form.zegenhagen_ssr93 ; bedzyk_review
In case of a back-scattering geometry as used throughout our experiments these three non-dipolar parameters are not independent.vartanyants_ssc00 Due to an additional constraint, i.e.
| (2) |
values for only two non-dipole parameters have to be established to determine the structural XSW parameters and . With and as the distance of the substrate Bragg planes we derive the relative positions of the adsorbate atoms to be .
III.2.2 Incoherent films
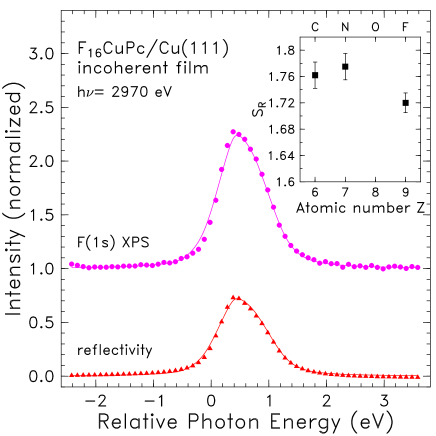
For thicker films of F16CuPc (coverage 10 ML) the averaging over many different positions leads to an effectively incoherent filmschreiber_ssl01 ; jackson_prl00 , and with the resulting Eq. (1) reduces to
| (3) |
As has been demonstrated beforelee_ss01 ; schreiber_ssl01 the non-dipole parameter can be determined by measuring the reflectivity and the XSW yield of the different atomic species. The relatively strong photoemission signals observed from multilayers of F16CuPc provide datasets with almost negligible statistical noise that can be analyzed according to Eq. (3).333Indeed, depends on the experimental geometry and in particular the electron emission angle. The finite angular resolution of the hemispherical electron analyzer is neglected here. On the basis of fits as the one shown in Fig. 4 we obtain -results on C(1s), N(1s), and F(1s) for first-order back-reflection energies of Cu(111) and Ag(111), see Fig. 4 and Tab. 3. Our data are in good agreement with previous experimental results on Cu(111)lee_ss01 ; jackson_prl00 and ab-initio calculationsbechler_pra89 ; nefedov_dp99 . Given the experimental results, i.e. for the different elements, the non-dipolar enhancement of the photoelectron yield is a key factor for the structural XSW analysis.
III.2.3 Coherent films
The photoelectron yield observed from a monolayer of F16CuPc molecules is directly related to the the spatial phase of the XSW field at the atomic positions. Thus with the coherent positions can be determined, provided that the non-dipolar terms and are taken into account. By introducing effective quantities
| (4) |
in Eq. (1) the photoemission yield may be written as
| (5) |
Using the previously measured -values the effective parameters defined in Eqs. (4) can now be derived directly from experimental photoelectron yield data. Therefore Eq. (5) has been the ‘working equation’ for analyzing the XSW data.
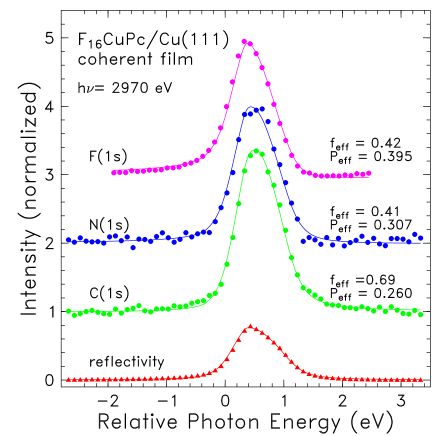
The XSW scans on F(1s), N(1s), C(1s) presented in Fig. 5 (top) were taken on a submonolayer of F16CuPc on Cu(111). As a first, more qualitative result we note the similar overall shape of these XSW scans which indicate comparable coherent positions and thus a lying down configuration of the molecules. The low noise level achieved in these measurements, however, allows us to resolve small, but significant differences in the shape of the XSW signals: Compared to the carbon or nitrogen signal the fluorine yield shown in Fig. 5 (top) exhibits a more pronounced tail on the low-energy side. Accordingly, different coherent contributions are found by least-square fits on the basis of Eq. (5) which yield a coherent position of for fluorine and for carbon.
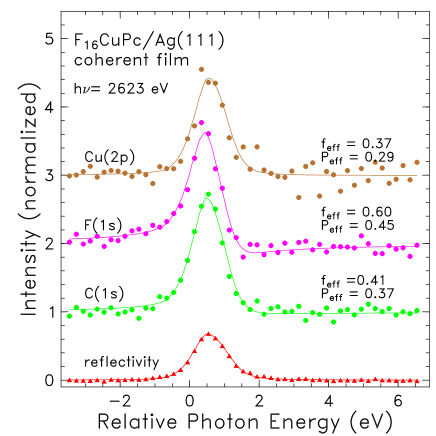
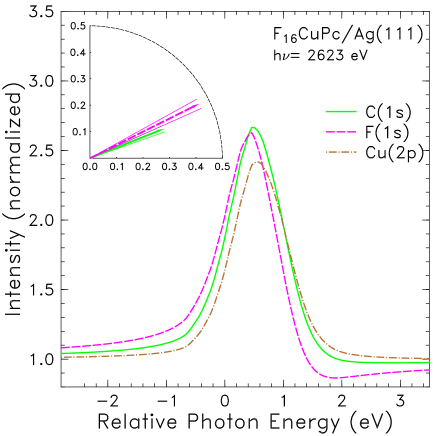
Likewise we obtained X-ray standing-wave signals from a coherent layer of F16CuPc on Ag(111). The XSW scans on C(1s), F(1s), and Cu(2p3/2) shown in Fig. 5 (bottom) again reveal a lying down configuration of the molecules. Despite slightly worse statistics in these data our analysis works well and the fit parameters and can be determined precisely. As on Cu(111) we derive a markedly larger coherent position for fluorine compared to for carbon. Further details on the resulting effective parameters both on Cu(111) and Ag(111) can also be found in Tab. 3. The exact atomic positions , however, cannot be derived unless the non-dipolar contributions are separated out.
III.2.4 Non-dipolar corrections
In order to retrieve the coherent position and the coherent fraction from the effective parameters either the additional phase or has to be known. Importantly, in case of initial -state symmetry this problem can be overcome because is directly related to the partial phase shift between the possible final - and -states of the photoexcitation process. Since it can be shown that
| (6) |
the XSW phase is a simple and unique function of the partial phase shift . Using an averaged experimental value of as a first estimate we hence find .
For each element and electron energy phase shifts are determined independently by means of relativistic ab initio calculations.jablonski_nist02 Our results as given in Tab. 3 are in excellent agreement with previous theoretical efforts (Ref. bechler_pra89, and Fig. 7 in Ref. lee_ss01, ). The corresponding non-dipolar XSW phases for carbon, nitrogen, and fluorine turn out to be relatively small and similar, with only minor impact on the effective coherent positions.444We note that the Auger signal of a coherent layer cannot easily be used to determine experimentally. For several reasons it is difficult to extract the pure dipolar signal which would be needed for comparison: First, coherent Auger excitations by photoelectrons coming from the substrate are generally not negligible. Second, the weak and broad Auger lines require very long integration times and a thorough intensity analysis to be useful. With a typical signal-to-background ratio of only 0.05 for the fluorine peaks even minute errors in the definition of the background level or shape result in significant problems. This strongly photon energy dependent background of mostly inelastically scattered substrate electrons has to be subtracted consistently for each spectrum in the XSW series. Third, as it turns out that the phase difference between Auger and XPS signal is relatively small, the determination of means subtracting similar numbers whereby the experimental errors propagate very unfavorably. Therefore we find as a good approximation to Eq. (2) with and being the truly important non-dipolar parameters in our experiment.
| Cu(111) | Ag(111) | ||||
|---|---|---|---|---|---|
| C(1s) | N(1s) | F(1s) | C(1s) | F(1s) | |
| 555taken from Ref. lee_ss01, | |||||
| Cu(111) | Ag(111) | ||||
|---|---|---|---|---|---|
| C(1s) | N(1s) | F(1s) | C(1s) | F(1s) | |
Finally, we are now able to deduce the coherent fractions and coherent positions which yield the adsorbate bonding distances relative to the Bragg planes of the substrate. On Cu(111) we find Å for carbon, whereas the fluorine atoms reside at Å, i.e. Å above the central benzene rings of the F16CuPc molecule. With Å we locate nitrogen in an intermediate position somewhat closer to the carbons. The coherent fractions we derive on copper are nearly identical for fluorine and nitrogen, yet larger for fluorine. On Ag(111) we obtain Å for carbon, and Å for fluorine. Again this difference of Å between both elements reveals a noticeable distortion of F16CuPc with the fluorine atoms above the plane defined by the inner carbon rings.
III.2.5 Error analysis
Showing the relevant fits to our XSW data on copper and silver Fig. 6 demonstrates the obvious differences between these datasets. In order to assess our XSW results and decide whether the different bonding distances are significant a careful error analysis is necessary.
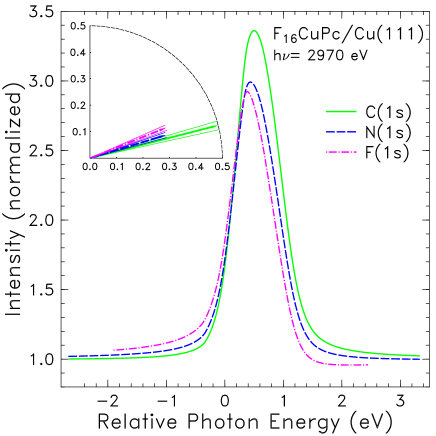
We included Poisson-like errors as weighting factors in the fitting procedure of Eq. (5). As shown in Tab. 3 the obtained error bars for the coherent position are usually quite small. The corresponding uncertainties in the adsorbate positions therefore amount to barely Å for datasets as those shown in Fig. 5.
Systematic errors of different origin, however, are much more difficult to quantify. Experimental insufficiencies and incorrect data analysis practices may inflict deviations from the ’true’ XSW signal. Because of the fixed focus of the electron analyzer, for example, a drifting X-ray beam on the sample can be precarious. Similarly, a wrong decomposition of the photoemission spectra causing erroneous XSW intensities can be misleading. Nevertheless, the pronounced tail on the low-energy side of the fluorine XSW signal as seen in Fig. 5 is consistently observed from monolayers F16CuPc on Cu(111) and Ag(111). Based on our experience with many different datasets we consider the systematic error of to be dominant resulting in an accuracy of typically Å. We therefore conclude that the elevated positions of the fluorine atoms relative to the central benzene rings and the nitrogen atoms are significantly beyond the combined error bars.
IV Discussion of Results
Like many other molecules with extended -electron systems F16CuPc adsorbs in a lying down configuration on Cu(111) and Ag(111) forming a rather stable adsorbate complex. This behavior might be explained by the formation of interface states derived from the delocalized -electrons in F16CuPc.evangelista_ss04 By aiming at a large orbital overlap with the electron cloud of the substrate, the molecules naturally adopt the lying down configuration as the energetically most favorable position. As we observe XSW signals with coherent fractions , the corresponding disorder within the adlayer is significant. Given the size and symmetry of F16CuPc, this appears to be the result of a statistical misalignment rather than a uniform tilt of all molecules.666Already a tilt angle of 1∘ would no longer be consistent with the fluorine XSW data shown in Fig. 5. Since the lateral structure of F16CuPc might be neither simple nor entirely staticgrand_ss96 , the atomic positions reported here are element and time averaged results. Hence we regard the positional spread within the atomic ensembles to be instrinsic to the complex structure of the adsorbate.
The exact bonding distances of F16CuPc, to our knowledge determined for the first time here, are more difficult to interpret. As a first attempt one might compare our results with the van der Waals radii of the different atoms, given in Tab. 4. These values, derived from contact distances between non-bonding atoms do not take chemical bonding or charge redistribution into account. In fact, in compounds of different atoms the radius strongly depends on the chemical bonding. In particular due to the presence of fluorine, the most electronegative element, one has to expect significant deviations from these numbers. Not too surprisingly, therefore, the bonding distances do not agree with added values of . More instructive, however, is a comparison with experimental data available for similar systems. The simplest and probably best studied aromatic adsorbate system is benzene. On the transition metal surfaces Ni(111) and Ru(0001) generally smaller values for the carbon positions are found, i.e. Å on nickelkang_ss00 and Å on rutheniumbraun_ss01 . Examples of more complex molecules are PTCDAkrause_jcp03 with a bonding distance of Å and NTCDAstanzel_ssl04 with Å both on Ag(111), i.e. values comparable to our results.
| C | N | F | Cu | Ag | |
|---|---|---|---|---|---|
| (Å) | |||||
| (Å) |
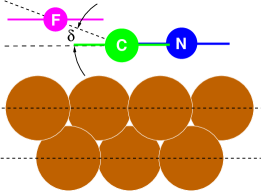
The different atomic positions within the molecule cannot fully be explained by means of a simple model which does not take the molecular structure of F16CuPc and the presence of the substrate adequately into account. As discussed in a recent theoretical workfavot_epl00 , however, the distortion might be related to a partial rehybridization of the carbon atoms as they change from the -hybridization in the free molecule towards a more tetrahedral -symmetry upon adsorption. A convenient way to illustrate this concept is to consider the average angle between the C–F bond and the surface, see Fig. 7. Using a C–F bond length of Å and our XSW results we can derive an angle of for Cu(111) and for Ag(111). Both values are considerably closer to the tetrahedral angle of that would correspond to a full -symmetry. However, theoretical work is required to verify whether the surface interactions are large enough to promote the adsorbing molecule into a partially -hybridized state.
Further experiments using different ligands as ’spacers’ (e.g. replacing F with Cl, Br, or I) could test this hypothesis and reveal how the interaction between the central ring structure with the metallic electron cloud is mediated. We note that a distorted adsorption geometry of F16CuPc has interesting and possibly important implications. Due to the high electron affinity of fluorine a permanent molecular dipole moment perpendicular to the substrate surface is created. This, however, results in an additional attractive force between the molecules and the metal as the induced image dipole stabilizes this configuration.
First-principle calculations of the adsorption of F16CuPc could also shed more light on this phenomenon as they would include all important aspects of these system as e.g. the character of the chemical bonding in the molecule, the partially filled -bands in noble metals, and the central copper atom in F16CuPc. The molecular distortion could then be compared to theoretical results. These investigations would not only contribute to a better understanding of these adsorbate systems, but also provide new clues for areas such as organic electronics, where the binding of the first molecular layer to a metal contact strongly influences the interface dipole and the charge carrier injection.
V Summary and Conclusions
In this study we show that large -conjugated F16CuPc molecules adsorb in a lying down, but non-planar configuration on the noble metal surfaces Cu(111) and Ag(111). A detailed, element-specific analysis of our XSW data reveals a significant relaxation of the molecules upon adsorption. The coherent positions of the fluorine and carbon atoms differ beyond the experimental uncertainties: On copper (silver) the central carbon rings are located at Å (Å) above the substrate, whereas the outer fluorine atoms are found at Å (Å).
We hope that our results will stimulate further experimental and theoretical work in this area. Calculations on the adsorbate structure of large molecules would greatly promote our understanding of these systems and could also provide new insight in the electronic properties of the organic-inorganic interface.
Acknowledgments
The authors thank the ESRF for providing excellent facilities, N. Karl and J. Pflaum for purifying the F16CuPc material, and the referee for giving very useful comments. This work was financially supported by the EPSRC (UK).
References
- (1) P. Peumans and S. R. Forrest, Appl. Phys. Lett. 79, 126 (2001).
- (2) Z. Bao, A. J. Lovinger, and J. Brown, J. Am. Chem. Soc. 120, 207 (1998).
- (3) W. Braun, G. Held, H.-P. Steinrück, C. Stellwag, and D. Menzel, Surf. Sci. 475, 18 (2001).
- (4) J. Breitbach, D. Franke, G. Hamm, C. Becker, and K. Wandelt, Surf. Sci. 507-510, 18 (2002).
- (5) O. Schaff et al., Surf. Sci. 348, 23 (2000).
- (6) J.-H. Kang et al., Surf. Sci. 448, 23 (2000).
- (7) P. H. Lippel, R. J. Wilson, M. D. M. C. Wöll, and S. Chiang, Phys. Rev. Lett. 62, 171 (1989).
- (8) I. Chizhov, G. Scoles, and A. Kahn, Langmuir 16, 4358 (2000).
- (9) J.-Y. Grand et al., Surf. Sci. , 403 (1996).
- (10) M. Böhringer, R. Berndt, and W.-D. Schneider, Phys. Rev. B 55, 1384 (1997).
- (11) J. Zegenhagen, Surf. Sci. Rep. 18, 199 (1993).
- (12) M. J. Bedzyk and L. Cheng, X-ray standing wave studies of minerals and mineral surfaces; principles and applications, in Reviews in Mineralogy and Geochemistry, edited by P. A. Fenter, M. L. Rivers, N. C. Sturchio, and S. R. Sutton Vol. 49, p. 221, Mineralogical Society of America, Washington, 2002.
- (13) I. A. Vartanyants and M. V. Kovalchuk, Rep. Prog. Phys. 64, 1009 (2001).
- (14) L. Cheng, P. Fenter, M. J. Bedzyk, and N. C. Sturchio, Phys. Rev. Lett. 90, 255503 (2003).
- (15) L. Kilian et al., Phys. Rev. B 66, 075412 (2002).
- (16) D. A. Verner, D. G. Yakolev, I. M. Band, and M. B. Trzhaskovskaya, Atomic Data and Nuclear Data Tables 55, 233 (1993).
- (17) G. J. Jackson et al., Phys. Rev. Lett. 84, 2346 (2000).
- (18) F. Schreiber et al., Surf. Sci. Lett. 494, 519 (2001).
- (19) E. J. Nelson, J. C. Woicik, P. Pianetta, I. A. Vartanyants, and J. W. Cooper, Phys. Rev. B 65, 165219 (2002).
- (20) I. A. Vartanyants and J. Zegenhagen, Solid State Commun. 113, 299 (2000).
- (21) J. J. Lee et al., Surf. Sci. 494, 166 (2001).
- (22) A. Bechler and R. H. Pratt, Phys. Rev. A 39, 1774 (1989).
- (23) V. I. Nefedov, V. G. Yarzhemskii, I. S. Nefedova, M. B. Trzhaskovskaya, and I. M. Band, Doklady Physics 44, 423 (1999).
- (24) A. Jablonski, F. Salvat, and C. J. Powell, Electron Elastic-Scattering Cross-Section Database (NIST, National Institute of Standards and Technology, Gaithersburg, 2002), chap. Version 3.0.
- (25) F. Evangelista et al., Surf. Sci. 566, 79 (2004).
- (26) B. Krause, A. C. Dürr, F. Schreiber, H. Dosch, and O. H. Seeck, J. Chem. Phys. 119, 2003 (2003).
- (27) J. Stanzel, W. Weigand, L. Kilian, C. K. H. L. Meyerheim, and E. Umbach, Surf. Sci. Lett. 571, 311 (2004).
- (28) F. Favot, A. D. Corso, and A. Baldereschi, Europhys. Lett. 52, 698 (2000).
- (29) L. Ottaviano, L. Lozzi, F. Ramado, P. Picozzi, and S. Santucci, J. Electron Spectrosc. Relat. Phenom. 105, 145 (1999).