High-energy Cu spin excitations in PrBa2Cu3O6+x
Abstract
This paper describes high-energy neutron inelastic scattering measurements of propagating magnetic excitations in PrBa2Cu3O6+x ( and ). The measurements probe the acoustic and optic modes of the antiferromagnetically-ordered copper–oxygen bilayers in the energy range 50–150 meV. The observed magnon dispersion can be described satisfactorily in this energy range by a spin wave model including intra- and inter-layer nearest-neighbour exchange constants and . We find meV and meV. The value of is virtually the same as that found in YBa2Cu3O6.2, but is a factor of two smaller. To within experimental error the values of and for PrBa2Cu3O6+x do not vary with oxygen doping.
pacs:
PACS numbers: 74.72.Bk, 75.30.Ds, 75.50.Ee, 78.70.NxI Introduction
One of the unusual characteristics of the cuprate superconductors is the relative insensitivity of the superconducting properties to the presence of magnetic rare-earth ions. In the RBa2Cu3O6+x family (R = Y or rare earth) superconductivity occurs at temperatures as high as 95 K, and magnetic ordering of the R sublattice generally coexists with superconductivity at temperatures around 2 K or below.Allenspach-Handbook-2001 Antiferromagnetic (AFM) ordering of the bilayer Cu spins is observed in non-superconducting samples with low oxygen doping levels (typically ), but superconducting samples do not exhibit any conventional form of Cu magnetic order.Magnetic-order-YBCO
A striking exception to this norm is the case of PrBa2Cu3O6+x (hereafter PrBCO6+), which exhibits anomalous electrical and magnetic properties in comparison to other RBCO compounds.radousky ; Boothroyd-JAlloysCmpds-2000 Superconductivity is not found for any in samples of PrBCO6+ prepared by standard methodsZou-JJAP-1997 , and the transition temperature K for AF order of the Cu spins depends only weakly on .PrBCO-TN Magnetic ordering of the Pr sublattice takes place below a temperature varying from 11 K () to 17 K (),PrBCO-TN ; Kebede_PRB-1989 ; Li-PRB-1989 ; Wortmann-Felner-1990 much higher than the rare earth magnetic ordering temperatures in superconducting RBCO compounds. Unusual magnetic structures are observed below due to magnetic coupling between the Cu and Pr sublattices.Boothroyd-Cu-Pr-coupling
Many of these anomalous features of PrBCO6+ remain a puzzle. Models for the electronic structure have indicated a tendency for Pr 4 – O 2 hybridization to cause a localization of doped holes in O 2 orbitals, thus inhibiting superconductivity.FR-LM-PRL Such hybridization would also be expected to influence the magnetic couplings in PrBCO6+, and so measurements of the exchange interactions could yield information on the underlying electronic structure.
Over a number of years we have undertaken a systematic investigation of the magnetic excitations of PrBCO6+ by neutron inelastic scattering.Boothroyd-PhysicaC-1993 ; Lister-PRL-2001 ; Gardiner-ApplPhys-2002 The aim has been to identify the important magnetic couplings and to see how they vary with doping. Broadly speaking, the magnetic excitations fall into two categories: (i) transitions between levels of the Pr 4 electrons split by the local crystalline electric field (CEF),Boothroyd-PhysicaC-1993 ; CEF-excitations and (ii) Cu spin wave excitations. There are also non-trivial effects on the excitations due to the magnetic coupling between the Pr and Cu sub-systems.Lister-PRL-2001 ; Gardiner-ApplPhys-2002
In our most recent work we have investigated the wavevector dependence of the magnetic excitations using a single crystal sample of PrBCO6+ prepared first in an oxygen-deficient state () and later treated to produce an ‘optimally-doped’ oxygen content (). Refs. Lister-PRL-2001, and Gardiner-ApplPhys-2002, describe measurements at low ( meV) and intermediate (45–65 meV) energies, and present an analysis of the spectra in terms of a spin model for the coupled Cu–Pr system. Here we report measurements of the Cu spin excitations at higher energies (50–150 meV) by time-of-flight neutron scattering. We determine the principal intra- and inter-layer Cu–Cu exchange interactions and in PrBCO6+ and make a comparison with the corresponding parameters in YBCO6+. Perhaps the most interesting new finding is that and in PrBCO6+ are independent of oxygen doping.
II Experimental details
The experiments were performed on the same single crystal of PrBCO6+ as used for the measurements described in Refs. Lister-PRL-2001, and Gardiner-ApplPhys-2002, , and also for the phonon study reported in Ref. Gardiner-PRB-2004, . The as-grown crystal had a mass of 2 g, and a mosaic spread of approximately 1 deg (full width at half maximum) measured by neutron diffraction. The crystal was subjected to two annealing treatments to control the oxygen content. First, the as-grown crystal was reduced at 700∘C in a flow of 99.998% argon for 100 h and quenched to room temperature. After the measurements on this ‘under-doped’ crystal had been completed the crystal was then annealed in pure oxygen over a period of 60 days while cooling in steps from 600∘C to 450∘C, with progressively longer dwell times at each step as the temperature decreased. After the second anneal the mosaic of the crystal was found to have increased to approximately 3 deg.
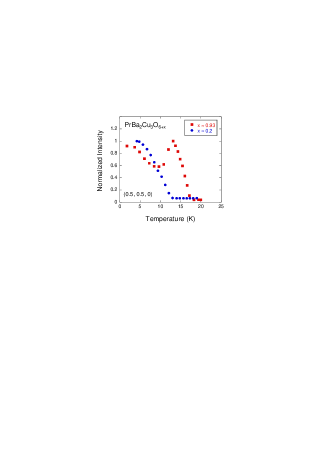
According to studies of oxygen content in YBCO6+ as a function of annealing conditions (oxygen partial pressure and temperature) the two treatments applied here yield oxygen contents of and .annealing Although the oxygen ordering properties of YBCO6+ and PrBCO6+ are qualitatively different their oxygen equilibrium isobar coincides at 0.21 atm up to 650∘C.Parfionov-Konovalov Therefore it is realistic to assume that this is also the case for other oxygen partial pressures. However, as a further check of the oxygen content we measured the magnetic ordering behaviour of the crystal after each anneal by neutron diffraction. Studies carried out on polycrystalline PrBCO6+ have shown by various techniquesPrBCO-TN ; Kebede_PRB-1989 ; Li-PRB-1989 ; Wortmann-Felner-1990 that the Pr magnetic ordering temperature increases from K for vacuum-annealed samples (), to K for ‘optimally-doped’ material (). The results for our crystal are illustrated in Fig. 1, which shows the temperature dependence of the Bragg reflection whose appearance is known to signal the onset of Pr magnetic order.Boothroyd-Cu-Pr-coupling ; Longmore-PRB-1996 ; Uma-JPCM-1998 The Pr ordering temperatures are determined to be K after reduction, and K after oxygen annealing. These values are consistent with the literature results for the expected oxygen contents and , respectively, and we will henceforth refer to the crystals as PrBCO6.2 and PrBCO6.93. The sharpness of the transitions indicates a homogeneous oxygen distribution. The intensity curve for PrBCO6.93 also shows an anomaly at . This is consistent with a spin transition first observed by Uma et al.,Uma-JPCM-1998 which corresponds to a change in the axis stacking sequence of the coupled Pr–Cu magnetic structure.Boothroyd-JAlloysCmpds-2000
The neutron inelastic scattering measurements reported here were performed on the MAPS (PrBCO6.2) and HET (PrBCO6.93) spectrometers at the ISIS spallation neutron source. MAPS and HET are time-of-flight spectrometers equipped with pixellated area detectors situated 6 m (MAPS) and 4 m (HET) from the sample position, and an incident beam divergence of approximately 0.5∘. These design features ensure very good wavevector (Q) resolution, an essential experimental requirement in this work because of the very steep Cu spin wave dispersion.
The crystal was aligned with the c axis approximately parallel to the incident neutron beam direction. This arrangement means (i) that the surfaces in Q space corresponding to constant neutron energy transfer are approximately parallel to the plane in the reciprocal lattice of the crystal, and (ii) that the component of Q parallel to varies with energy transfer. The natural way to visualize the data is then to integrate the signal recorded in each pixel of the detector bank over a band of energies and project the results on to the plane.
Measurements were performed with fixed incident neutron energies of 80 meV, 200 meV and 300 meV on MAPS, and 200 meV on HET. Most of the data were collected with the crystal at a temperature of 20 K, but some runs were repeated at 300 K. The runs on MAPS were of 2–3 days duration, and the runs on HET were of 5 days duration for each of 2 settings of the crystal. These run times are given for an average proton current of 160 A. In principle, the range of incident energies employed on MAPS allowed us to study the spin excitations up to meV, which is the anticipated maximum in the one-magnon spectrum (see later). However, owing to the relatively small size of the crystal the count rate was too low to obtain statistically meaningful data above 150 meV. The intensity was converted into an absolute cross section by comparison with the scattering from a standard sample of vanadium.Windsor The presented spectra are the partial differential cross section per formula unit (f.u.) multiplied by the factor , where and are the initial and final neutron wavevectors, and is the final energy.Squires
III Cu spin excitation spectrum
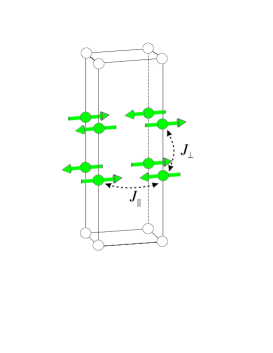
As mentioned above, the bilayer Cu spins in PrBCO6+ order antiferromagnetically at a temperature near room temperature and slightly dependent on . At temperatures below but above the bilayer Cu spins are aligned antiparallel to their nearest neighbours along all three crystallographic directions, as shown in Fig. 2. There is no ordered moment on the Cu site in the Cu–O chains. This is the well known AFI structure, the same as found in underdoped YBCO6+. Our interpretation of the data can therefore be guided by the spin wave model used to describe the spin excitations in AFI-ordered YBCO6+.Tranquada-PRB-1989 ; Reznik-PRB-1996 ; Hayden-PRB-1996
For the high-energy spin excitations it is a good approximation to regard the Cu spin arrangement as a square-lattice bilayer antiferromagnet. This neglects the slight orthorhombic distortion (if present) and the weak coupling between bilayers in adjacent unit cells. The simplest spin Hamilatonian that describes this system is then
| (1) |
The summations in Eq. (1) are over pairs of nearest-neighbour Cu spins in the same layer (first term) and on adjacent layers (second term). Each pair of spins is counted only once. The constants and are the intra- and inter-layer exchange parameters, respectively.
The magnon spectrum derived from Eq. (1) has two branches, differing according to whether the spins on adjacent layers in the bilayer rotate in the same sense (acoustic modes) about their average direction, or in the opposite sense (optic modes). The dispersion of these branches is given byTranquada-PRB-1989 ; Hayden-PRB-1996
| (2) |
where and correspond to the acoustic and optic modes, respectively, and
| (3) |
Close to the 2D AFM zone centres, e.g. in units of , the acoustic branch is linear with an initial slope proportional to . The optic branch has an energy gap of at the AFM zone centres. Because of the bilayer structure in the unit cell (Fig. 2) the cross section for scattering from acoustic and optic magnons contains factors of and , respectively, where is the inter-layer spacing as a fraction of the lattice parameter ( for PrBCO6+).
IV Results

Figures 3 and 4 present some examples of neutron scattering data collected on the MAPS and HET spectrometers, respectively. Figs. 3(a) and (b) are maps of the intensity from PrBCO6.2 averaged over the energy range 85–105 meV and 130–160 meV, respectively, projected on the plane. For these energies we could not detect any difference between the signal at 20 K and at 300 K, so data collected at these two temperatures were averaged to improve statistics. The images focus on the region of 2D reciprocal space in the vicinity of the AFM zone centre , and contain intensity in excess of background distributed around . This signal, which expands away from with increasing energy, is consistent with the scattering from AFM spin waves. According to Eq. 2, the scattering from spin wave excitations of the bilayer Cu spins is expected to be virtually isotropic in the plane (i.e. a ring of scattering) because at these energies the spin wave wavevector extends only about halfway to the Brillouin zone boundary. The experimental signal is consistent with a ring centred on once the statistical scatter of the data is taken into consideration.
Under the conditions of the measurement the out-of-plane wavevector component at meV is (in units of ), and at meV it is . Maxima in the bilayer structure factors for acoustic and optic magnons are found at and 6.8, respectively, so the scattering is mainly from acoustic modes in Fig. 3(a) and from optic modes in Fig. 3(b).
Figs. 3(c) and (d) show linear scans extracted from the intensity maps in Figs. 3(a) and (b). The scans are made parallel to passing through the AFM zone centre at , and are averaged over a range (95 meV) and (145 meV) in the direction. Each scan contains two peaks, one for each intersection of the scan with the spin wave dispersion surface which we assume to be a ring. By fitting a pair of Gaussian functions on a sloping background to the peaks in these and similar scans in other directions and from other runs, allowing for the curvature of the dispersion surface over the averaging width , we found the radius of the ring as a function of energy, and hence arrived at the in-plane spin wave dispersion shown in Fig. 5. We have chosen to plot the dispersion along the direction for consistency with published data on YBCO,Tranquada-PRB-1989 ; Reznik-PRB-1996 ; Hayden-PRB-1996 but we reiterate that the spin wave dispersion is expected to be virtually isotropic within the range of wavevectors probed in our measurement. The points corresponding to mainly acoustic modes and mainly optic modes are shown with different symbols on Fig. 5, and we have also included the optic mode gap at the AFM zone centre ( meV) determined in a previous measurement on the same PrBCO6.2 crystal.Lister-PRL-2001

The magnon dispersion data were compared with the curves for the acoustic and optic spin wave branches calculated from Eqs. 2 and 3. The two exchange parameters were adjusted to give the best overall agreement with the experimental data, and after consideration of the experimental uncertainties we obtained meV and meV. The best-fit dispersion curves are plotted on Fig. 5.
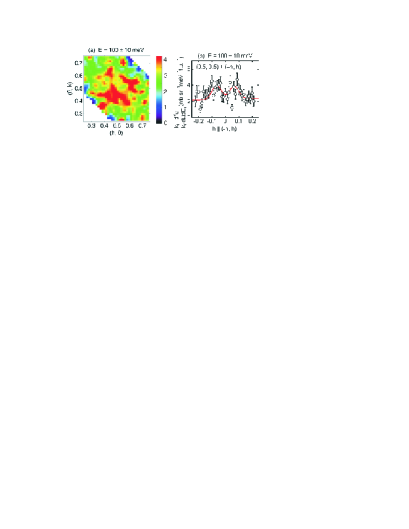
The data collected on oxygenated PrBCO6.93 were more limited than those just described for PrBCO6.2. This is because the detector area on HET is considerably smaller than on MAPS, which restricted the measurement to one Brillouin zone and required two slightly different settings of the crystal to cover enough of the zone to include all the signal. Nevertheless, the constant-energy slice shown in Fig. 4(a) has , and so corresponds to an almost pure acoustic mode. Fig. 4(b) shows a cut through the antiferromagnetic point parallel to . This direction was chosen for the cut because the data recorded in the detector extend furthest along this diagonal, as can be seen in Fig. 4(b). From the two-Gaussian fit we obtained the point on the acoustic spin wave dispersion curve shown on Fig. 5. To within experimental error ( %) the PrBCO6.93 datum lies on the PrBCO6.2 dispersion curve. In an earlier experimentGardiner-ApplPhys-2002 we determined the optic mode gap for PrBCO6.93 and found it to be meV, again consistent with that for PrBCO6.2.
V Discussion
At the start of this work we set out to determine the Cu–Cu exchange parameters and for PrBCO6+ and to compare them with the corresponding parameters for YBCO6+. The result meV for the intra-layer exchange parameter of PrBCO6.2 found here is the same to within experimental error as the values meVHayden-PRB-1996 and meVShamoto-PRB-1993 determined by neutron inelastic scattering for YBCO6.15. There is also good agreement with the values meV for PrBCO6+ (), Ref. Yoshida-PRB-1990, , and meV for YBCO6+ (), Ref. Lyons-PRL-1988, , derived from two-magnon Raman scattering, which provides some support for the models used to describe the rather broad two-magnon Raman spectra.
On the other hand, the values of the inter-layer exchange parameter for PrBCO6+ and YBCO6+ are significantly different. We obtain meV for PrBCO6.2, compared with meV for YBCO6.2 (Ref. Reznik-PRB-1996, ) and meV for YBCO6.15 (Ref. Hayden-PRB-1996, ). Our own measurements on a crystal of YBCO6.2 gave meV. One factor that might influence is the inter-layer separation, which is about 4% larger in PrBCO6+ than in YBCO6+ reflecting the larger size of the Pr3+ ion relative to Y3+. It would be surprising, however, if this accounts for a factor 2 difference in between PrBCO and YBCO.
As mentioned in the introduction, it has been proposed that superconductivity is suppressed in PrBCO because holes become localized in hybridized Pr–O bondsFR-LM-PRL . Naively, one might expect such a change in the electronic structure to have an influence on the Cu–Cu exchange interactions. The invariance of to the replacement of Y by Pr implies that the in-plane AFM superexchange interaction is unaffected by any changes in the electronic structure associated with Pr 4 – O 2 hydridization. This does not present any obvious difficulties since the superexchange is mediated by the O 2 orbitals which lie in the layers, whereas the proposed hybridization schemeFR-LM-PRL involves O 2 orbitals which are oriented perpendicular to the layers. Following the same reasoning, it is tempting to connect the large difference in between PrBCO and YBCO as evidence for hybridization-induced changes in the electronic structure within the bilayer. However, if the exchange were mediated by hybridized Pr–O bonds that also accommodate doped holes then it is difficult to explain the apparent insensitivity of to doping. A fuller analysis of these observations will require a proper understanding of the mechanism for the inter-layer exchange in the bilayer cuprates. What we can say, though, is that the substitution of Y by Pr does have a very significant influence on the inter-layer coupling.
Before concluding it is worth mentioning that although we have found no difference between the spin wave spectrum of PrBCO6.2 and PrBCO6.93 below 100 meV, there may still be differences at higher energies. Indeed, the two-magnon Raman peak, which is sensitive to short wavevelength spin fluctuations, was found shifted to lower energies in spectra from PrBCO7 compared with PrBCO6, Yoshida-PRB-1990 ; Rubhausen-PRB-1996 leading to a significantly smaller value meV than obtained from our neutron scattering measurements. One explanation for this apparent discrepancy could be that the magnetic excitations in hole-doped PrBCO may be influenced by magnon–hole interactions at higher energies. Neutron scattering measurements of the magnetic excitations up to the one-magnon zone boundary could therefore be very interesting.
VI Conclusions
In this work we have shown that the Cu spin excitation spectrum in PrBCO is well described up to 150 meV by the spin wave model for a bilayer antiferromagnet. In this energy range the spin excitations do not change with doping. The in-plane superexchange parameter has the same value in undoped PrBCO as in undoped YBCO, whereas the inter-layer exchange parameter is a factor of 2 smaller in PrBCO than in YBCO. An understanding of these results could provide useful insight into the differences between the electronic structure of PrBCO and YBCO, and hence into the question of why YBCO has a superconducting ground state whereas PrBCO does not.
Acknowledgements.
Financial support was provided by the Engineering and Physical Sciences Research Council of Great Britain and the Danish Technical Research Council under the Framework Programme on Superconductivity.References
- (1) P. Allenspach and M. B. Maple, in Handbook on the Physics and Chemistry of Rare Earths, edited by K. A. Gschneidner Jr., L. Eyring, and M. B. Maple, Vol. 31 (North-Holland, Amsterdam,), p. 163.
- (2) An unusual type of spin density wave state has been reported in underdoped YBCO by Y. Sidis, C. Ulrich, P. Bourges, C. Bernhard, C. Niedermayer, L. P. Regnault, N. H. Andersen, and B. Keimer, Phys. Rev. Lett. 86, 4100 (2001); and by H. A. Mook, P. Dai, and F. Doğan, Phys. Rev. B 64, 012502 (2001).
- (3) H. B. Radousky, J. Mater. Res. 7, 1917 (1992).
- (4) A. T. Boothroyd, J. Alloys Compd. 303–304, 489 (2000).
- (5) Reports of superconductivity in single crystals of PrBCO6+ grown by the floating-zone method have yet to be confirmed — see Z. Zou, K. Oka, T. Ito, and Y. Nishihara, Jpn. J. Appl. Phys. 36, L18 (1997).
- (6) I. Felner, U. Yaron, I. Nowik, E. R. Bauminger, Y. Wolfus, E. R. Yacoby, G. Hilscher, and N. Pillmayr, Phys. Rev. B 40, 6739 (1989); D. W. Cooke, R. S. Kwok, M. S. Jahan, R. L. Lichti, T. R. Adams, C. Boekema, W. K. Dawson, A. Kebede, I. Schwegler, J. E. Crow, and T. Mihalisin, J. Appl. Phys. 67, 5061 (1990).
- (7) A. Kebede, C. S. Jee, J. Schwegler, J. E. Crow, T. Mihalisin, G. H. Myer, R. E. Salomon, P. Schlottmann, M. V. Kuric, S. H. Bloom, and R. P. Guertin, Phys. Rev. B 40, 4453 (1989); A. Kebede, J. P. Rodriquez, I. Perez, T. Mihalisin, G. Myer, J. E. Crow, P. P. Wise, and P. Schlottmann, J. Appl. Phys. 69, 5376 (1992).
- (8) W.-H. Li, J. W. Lynn, S. Skanthakumar, T. W. Clinton, A. Kebede, C. S. Jee, J. E. Crow, and T. Mihalisin, Phys. Rev. B 40, R5300 (1989).
- (9) G. Wortmann and I. Felner, Solid State Commun. 75, 981 (1990).
- (10) A. T. Boothroyd, A. Longmore, N. H. Andersen, E. Brecht, and Th. Wolf, Phys. Rev. Lett. 78, 130 (1997); J. P. Hill, A. T. Boothroyd, N. H. Andersen, E. Brecht, and Th. Wolf, Phys. Rev. B 58, 11211 (1998); J. P. Hill, D. F. McMorrow, A. T. Boothroyd, A. Stunault, C. Vettier, L. E. Berman, M. v. Zimmermann, and Th. Wolf, Phys. Rev. B 61, 1251 (2000).
- (11) R. Fehrenbacher and T. M. Rice, Phys. Rev. Lett. 70, 3471 (1993); A. I. Liechtenstein and I. I. Mazin, Phys. Rev. Lett. 74, 1000 (1995).
- (12) A. T. Boothroyd, S. M. Doyle, and R. Osborn, Physica C217, 425 (1993).
- (13) S. J. S. Lister, A. T. Boothroyd, N. H. Andersen, B. H. Larsen, A. A. Zhokhov, A. N. Christensen, and A. R. Wildes, Phys. Rev. Lett 86, 5994 (2001).
- (14) C. H. Gardiner, S. J. S. Lister, A. T. Boothroyd, N. H. Andersen, A. A. Zhokhov, A. Stunault, and A. Hiess, Appl. Phys. A 74 [Suppl.], S898 (2002).
- (15) G. L. Goodman, C.-K. Loong, and L. Soderholm, J. Phys.: Condens. Matter 3, 49 (1991); H.-D. Jostarndt, U. Walter, J. Harnischmacher, J. Kalenborn, A. Severing, and E. Holland-Moritz, Phys. Rev. B 46, 14872 (1992); G. Hilscher, E. Holland-Moritz, T. Holubar, H.-D. Jostarndt, V. Nekvasil, G. Schaudy, U. Walter, and G. Fillion, Phys. Rev. B 49, 535 (1994).
- (16) C. H. Gardiner, A. T. Boothroyd, B. H. Larsen, W. Reichardt, A. A. Zhokhov, N. H. Andersen, S. J. S. Lister, and A. R. Wildes, Phys. Rev. B 69, 092302 (2004).
- (17) E. D. Specht, C. J. Sparks, A. G. Dhere, J Brynestad, O. B. Cavin, D. M. Kroeger, H. A. Oye, Phys. Rev. B 37, 7426 (1988); N. H. Andersen, B. Lebech, and H. F. Poulsen Physica C 172, 31 (1990); P. Schleger, W. N. Hardy, B. X. Yang, Physica C 176, 261 (1991).
- (18) O. E. Parfionov and A. A. Konovalov, Physica C 202, 385 (1992).
- (19) A. Longmore, A. T. Boothroyd, C. Changkang, H. Yongle, M. P. Nutley, N. H. Andersen, H. Casalta, P. Schleger, and A. N. Christensen, Phys. Rev. B 53, 9382 (1996).
- (20) S. Uma, W. Schnelle, E. Gmelin, G. Rangarajan, S. Skanthakumar, J. W. Lynn, R. Walter, T. Lorenz, B. Bfichner, E. Walker, and A. Erb, J. Phys.: Condens. Matter 10, L33 (1998).
- (21) C. G. Windsor, Pulsed Neutron Scattering (Taylor & Francis, London, U.K., 1981), p327.
- (22) G. L. Squires, Introduction to the Theory of Thermal Neutron Scattering (Cambridge University Press, Cambridge, U.K., 1978).
- (23) J. M. Tranquada, G. Shirane, B. Keimer, S. Shamoto, and M. Sato, Phys. Rev. B 40, 4503 (1989).
- (24) D. Reznik, P. Bourges, H. F. Fong, L. P. Regnault, J. Bossy, C. Vettier, D. L. Milius, I. A. Aksay, and B. Keimer, Phys. Rev. B 53, R14741 (1996).
- (25) S. M. Hayden, G. Aeppli, T. G. Perring, H. A. Mook, F. Doğan, Phys. Rev. B 54, R6905 (1996).
- (26) S. Shamoto, M. Sato, J. M. Tranquada, B. J. Sternlieb, and G. Shirane, Phys. Rev. B 48, 13817 (1993).
- (27) M. Yoshida, N. Koshizuka, and S. Tanaka, Phys. Rev. B 42, R8760 (1990).
- (28) K. B. Lyons, P. A. Fleury, L. F. Schneemeyer, and J. V. Waszczak, Phys. Rev. Lett. 60, 732 (1988).
- (29) M. Rübhausen, N. Dieckmann, A. Bock, U. Merkt, W. Widder, and H. F. Braun, Phys. Rev. B 53, 8619 (1996).