Flow curves of dense colloidal dispersions: schematic model analysis of the shear-dependent viscosity near the colloidal glass transition
Abstract
A recently proposed schematic model for the non–linear rheology of dense colloidal dispersions is compared to flow curves measured in suspensions that consist of thermosensitive particles. The volume fraction of this purely repulsive model system can be adjusted by changing temperature. Hence, high volume fractions () can be achieved in a reproducible manner. The quantitative analysis of the flow curves suggests that the theoretical approach captures the increase of the low shear viscosity with increasing density, the shear thinning for increasing shear rate, and the yielding of a soft glassy solid. Variations of the high shear viscosity can be traced back to hydrodynamic interactions which are not contained in the present approach but can be incorporated into the data analysis by an appropriate rescaling.
pacs:
82.70.Dd, 83.60.Df, 83.50.Ax, 64.70.Pf, 83.10.-yI Introduction
The flow behavior of concentrated suspensions under steady shear is a classical subject of colloid physics russel ; larson . A large number of experimental studies conducted mostly on hard spheres has established the basic facts: If the concentration of particles is not too high, a first Newtonian region is observed if the shear rate is small. Here, the solution viscosity measured in this first Newtonian regime can be significantly larger than the one of the pure solvent. At higher shear rates, the perturbation of the microstructure of the suspension by the convective forces can no longer be restored by the Brownian motion of the particles. Hence, significant shear thinning will result in which the reduced viscosity is more and more lowered until (often) a second Newtonian region is reached. In this region, is generally considered to be dominated by the hydrodynamic interactions between the particles. Highly concentrated suspensions behave as weak amorphous solids and elastically withstand small but finite stresses Petekidis04 .
The experimental results obtained so far have demonstrated that the deviation from the equilibrium structure can be gauged in terms of the bare Peclet number Pe, where denotes the particle radius and the diffusion coefficient at infinite dilution russel . However, non-Newtonian flow behavior is observed already at rather small Pe0 and the disturbance of the microstructure sets in at a shear rate defining a second characteristic number, the Weissenberg number or dressed Peclet number Pe=, which is connected to the structural relaxation time . Shear thinning may be considered to arise for Pe . In dispersions able to order under shear, the viscosity is observed to decrease. Yet, shear–thinning in concentrated suspensions of colloidal particles at low is not necessarily related to the onset of crystallization or other effects solely occuring at very high shearing fields. The structure remains amorphous during the application of shear rates that already lead to a marked decrease of the shear viscosity Petekidis04 ; Laun92 ; Petekidis02b .
The enormous raise of the zero-shear viscosity with increasing volume fraction has been a long-standing problem in the field russel . Earlier theoretical approaches Brady93 ; Lionberger00 have assigned this increase of to the onset of the structural arrest if the system is approaching the volume fraction of random close packing located at ca. . Hence, is predicted to diverge at this limit. However, Meeker et al. in 1997 Meeker97 carefully re-analyzed all experimental data of available at that time and concluded that the strong raise of the zero-shear viscosity is related to the glass transition in suspension occurring at the volume fraction . Other comparisons strongly supported this view Goetze99 , while recent viscosity measurements remained inconclusive Cheng02 ; FaradayDisc .
Nägele and coworkers worked out a theoretical approach
Banchio99 ; fuchsmayr that could
explain the increase of
on the base of the mode coupling theory (MCT) of
Götze and coworkers Goetze91b ; gs .
Hence, the marked slowing down of the mobility
of concentrated suspensions can directly be traced back to the caging
of a given sphere by its surrounding neighbors. The quantitative
description of the dynamics of quiescent suspensions in terms of the
MCT has met with gratifying success when confronted with experimental
data obtained through dynamic light scattering
Megen93 ; Megen93b ; Megen94 ; Beck99 ; Bartsch02 ; Eckert03 .
Indeed, MCT was shown
to explain the structural arrest of concentrated suspensions and
describe quantitatively the dynamics that stretch out over many orders
of magnitude. Moreover, in an important paper Mason and Weitz
Mason95 could demonstrate that MCT leads to a full explanation
of the linear viscoelastic behavior of hard sphere suspensions near the glass
transition.
Recently, a theoretical model for the shear-thinning of concentrated
suspensions was presented Fuchs02 ; Fuchs02b . It is based on MCT
and gives a full description of the reduced viscosity
as the function of the shear rate . A
comparison with recent simulations has demonstrated that this theory
captures all the salient points of the flow behavior of glassy
systems Fuchs02c . In particular, theory predicts a finite yield stress
beyond the glass point. It vanishes discontinuously when going
below the glass transition, where a first Newtonian plateau appears,
which is followed by strong shear thinning.
In this paper we present the first comprehensive comparison with experimental data obtained from a model system. The paper is organized as follows: In section II we review briefly the central concepts of our approach. Section III then gives the quantitative comparison with recent experimental data obtained on a model system Senff99 . A final section will conclude this paper.
II Flow curves and the colloidal glass transition
II.1 Loss of structural memory caused by shear advection
As mentioned above, the marked shear thinning in dense dispersions,
that is, the speeding up of structural relaxation through shear is not
necessarily related to shear ordering. This was shown by experiments
Laun92 ; Petekidis02b as well as by Brownian
dynamics simulations Strating99 . In Refs. Fuchs02 ; Fuchs02b we argued that
the speed up of decorrelation brought about
by shear advection combined with local Brownian motion lies at the origin
of shear thinning in dense dispersions. In this contribution we work out
the involved loss of structural memory caused by shearing in a schematic model
that captures the universal aspects of the full microscopic approach
of Ref. Fuchs02 .
The approach of Refs. Fuchs02 ; Fuchs02b ,
connecting the nonlinear rheology of dense dispersions
to the glass transition, predicts a transition from a
shear–thinning fluid to a yielding solid.
Even though small shear rates are considered and the (bare) Peclet
number Pe is negligible, the final relaxation of
transient density fluctuations or of the transient stress moduli is
strongly accelerated by shear whenever Pe is not negligible.
In fluid states, where is large at , shear advection
speeds up the decay of structural correlations.
For states which would be solid without shear, and where the shear modulus
would
arrest at a (finite) elastic constant at long
times, enforcing stationary shear leads to a finite relaxation time
Fuchs02 ; Fuchs02b which is of the order of .
Hence, the glassy state of the suspension is
shear–melted. The suspensions yields as stress fluctuations decay to
zero with rate set by the external drive.
II.2 Universal aspects
The flow curves versus exhibit qualitative aspects that are solely determined by the nature of the transition. With the separation parameter denoting the (relative) distance from the transition, and the time scale obtained by matching onto microscopic short–time motion, the following behaviors of the steady state shear stress in the ‘structural window’ have been established Fuchs02c
| (1) |
where the appearing constants are positive material–dependent parameters and the exponents , , and are non–universal numbers that are uniquely determined by the quiescent static structure factor Franosch97 ; Fuchs02b . The first line of Eq. (1), which describes the divergence of the viscosity, is familiar from classical MCT, and is discussed in e.g. Ref. Fuchs04b . The ‘structural window’, here, is defined as the double regime and , where the slowing–down of the structural dynamics dominates the steady state stress. A ‘dynamic yield stress’ is obtained in the glass because a finite stress has to be overcome in order to force the glass to yield even for vanishingly small shear rate. The given asymptotes are only the leading orders for and , while corrections can be obtained systematically Franosch97 ; Fuchs02b . A model calculation will be shown further below.
II.3 Schematic models
The universal phenomena summarized in Eq. (1) exist in any model that exhibits
the bifurcation scenario from yielding solid to shear thinning fluid. The central feature of the equations of motion is that
they contain the competition of two effects: i) a non-linear
memory effect increases with increasing particle
interactions (‘collisions’ or ‘cage effect’) which leads to a
non–ergodicity transition in the absence of shear, and ii), memory
effects vanish with time because of shear-induced decorrelation. Both
effects can be captured in the simpler ‘schematic’
models also. Note that the models can be set-up so that they obey
similar stability equations as the microscopic approach. Thus, the
corresponding asymptotic results summarized in Eq. (1) hold.
The well studied and comparatively simple schematic F–model considers one normalized correlator , which obeys a generalized relaxation equation Fuchs02b :
| (2) |
Without memory effects, , the correlator relaxes exponentially, , but with , retardation effects set in after a short–time variation (still given by the initial decay rate , viz. ). The correlator is taken to model the normalized non–Newtonian shear modulus. A low order polynomial ansatz for suffices to model the feedback mechanism of the cage–effect. We choose
| (3) |
Without shear, this model has been studied extensively Goetze84 ; Goetze91b . Increasing particle caging is modeled by increasing coupling parameters , , and the only effect of shearing is to cause a time dependent decay of the friction kernel . The system loses memory because of shearing. The role of the transport coefficient (viscosity) is played by the average relaxation time obtained from integrating the correlator. It is also taken to determine the stress:
| (4) |
At high shear rates, the memory function is strongly supressed, so that returns to a single exponential, and the high shear visosity of the model follows as .
II.4 Control parameter space and glass transition lines
For the parameters of the model, the choice of generic values follows from previous considerations Fuchs02b ; Goetze91b . First, the parameter sets the time scale and determines the short time dynamics. The bare Peclet number for the model thus is given by Pe. This parameter hence can be compared directly to the fast colloidal dynamics determined by the radius of the particles and the short–time diffusion coefficient. Second, earlier studies suggest to choose the two interaction parameters so that and , where . Thus, the decisive parameter, namely the effective volume fraction of the particles enters the model only via . A glass transition singularity lies at , where the long time limit jumps from zero for to a finite value for and . The parameter plays the role of the elastic constant in this model.
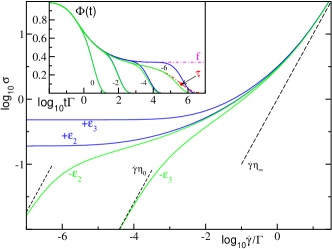
The inset shows the correlators of the schematic –model as function of rescaled time . The curve marked with a relaxation time taken at corresponds to a fluid state without shear (, ). The curve marked by the long time plateau value corresponds to a glass state without shear (, ). For increasing shear rates, -6, -4, -2, 0 as labeled, the correlators decay more quickly at either value of .
II.5 Flow curves of sheared suspensions
The presence of a glassy arrested structure is equivalent to a frozen in part in the correlator or memory function; thus without shear and hold for . With shear a non–decaying part in is impossible, as ; as a consequence, also always decays to zero. Memory is cut off at long times, and Eq. (3) gives the most simple ansatz recovering this effect of shear advection in the microscopic equations Fuchs02 , and the obviously required symmetry in . The inset of Figure 1 shows the correlator for fluid and glassy states for systems at rest (), and for sheared suspensions. For the latter systems, the –model predicts the speed up of the relaxation caused by increasing shear rates. Integrating over the correlators, as given in Eq. (4), leads to the viscosity which consequently exhibits shear thinning. The corresponding flow curves are shown in Fig. 1: Here the shear modulus is plotted as the function of the reduced flow rate . Theory predicts an evolution from an (almost) Newtonian fluid at weak coupling to a markedly non–Newtonian fluid at stronger coupling corresponding, in experiments, to higher volume fraction. This is seen from the characteristic S-shaped dependence of on . At the glass transition, there is a discontinuous transition from the dissipative fluid–like behavior to a yielding solid. A finite shear rate leads to a shear-melting of the glassy state.
Fig. 1 presents the central result of theory. It gives the full scenario for the non-linear flow behavior of dense suspensions and relates it to the glass transition in these systems. Moreover, it predicts that flow curves obtained from glassy suspensions should present meaningful results. This is due to the fact that the shear is expected to speed up the relaxation even at highest volume fractions. As an experimental consequence of this, no hysteresis is expected and flow curves present a well-defined probe of the dynamics of glassy systems. As a caveat, though, the condition needs to be recalled that the system is given enough time to reach the steady state, and that phase transitions and ordering phenomena are prevented.
III Comparison of model calculations and experimental data from model systems
III.1 Thermosensitive latex particles
A meaningful experimental study of the flow behavior of suspensions requires a system of particles that exhibit a rather small polydispersity and a high stability in the respective suspension medium. Moreover, the particles should interact in a purely repulsive fashion. This requirement is certainly given for the classical hard sphere suspensions used for the study of colloidal glasses so far. However, as an additional requirement, it should be possible to prepare suspensions having volume fractions up to in order to explore the region beyond the volume fraction of the glass transition.
Recently, we showed that aqueous suspensions of thermosensitive latex particles meet these requirements Senff99 ; Deike01 . The particles consist of a solid core of poly(styrene) of ca. 100 diameter onto which a shell of crosslinked poly(N–isopropylacrylamide) (PNIPA) chains is affixed. The particles are suspended in water and the PNIPA network in the shell is swollen at low temperatures (ca. 10). Raising the temperature leads to an expulsion of this thermosensitive shell and the particles will shrink. The advantage of the thermosensitive suspension is obvious: The effective volume fraction could be changed over a wide range by raising or lowering the temperature while keeping constant the weight fraction of the particles. In this way highly concentrated suspensions could be generated in situ, that is, directly in the rheometer. No pre–shear was imposed on the system by handling or filling in a highly concentrated suspension. Moreover, any previous history of the sample could easily be erased by lowering the effective volume fraction throuh raising the temperature. The thermosensitive suspensions hence present a novel model system by which volume fractions around and beyond the volume fraction of the glass transition become accessible without freezing–in non–equilibrium states caused by handling the suspension. Indeed, as shown in Ref. Senff99 , the shear viscosity of suspensions of these particles could be obtained over a large range of shear rates in a well-defined manner.
It should be noted that the thermosensitive particles present a well-studied system by now: The phase transition within the microscopic network Seelenmeyer01 was shown to be fully reversible Senff99 ; Deike01 . Moreover, an analysis of these particles by a combination of small–angle neutron and X–ray scattering revealed that the shell is well-defined and the particles exhibit a narrow size distribution Seelenmeyer01 ; Dingenouts01 . Their interaction in water is purely repulsive Deike01 if the temperature is not raised over 30.
III.2 Flow curves
Theory states that flow curves of shear stress versus shear rate refer to a well-defined stationary state. Close to vitrification, the parameters characterising the static structure can be subsumised into the separation parameter . Increasing the interactions of the particles, brought about by increasing the volume fraction then is described by increasing from negative values in the fluid to zero, the point of the glass bifurcation, and beyond, to positive values in the glass.
Equation (1) demonstrates that there is in principle only one parameter, the matching time , that is required to determine the flow curves and other steady state averages in the structural regime. This time scale contains all the effects of hydrodynamic interactions and other short–time phenomena not treated by theory. Hence, needs to be adjusted by fitting the theoretical curves to experimental data. Let us stress again, that in principle one time suffices to describe all different experimental measurements on a sheared dispersion, for all volume fractions close to its glass transition, and for small shear rates.
An ’idealized’ analysis of a complete experimental flow curve would thus proceed via
| (5) | |||||
where describes the flow curve at high shear rates. At small shear rates, the two fit parameters and remain as unknowns for the description of the structural region in the flow curve, as is determined by the static structure at the transition (viz. the critical values of the vertices in Eq. (3)). Both parameters, and , are influenced by the physics at high shear rates and short times, that is dominated by hydrodynamic interactions.
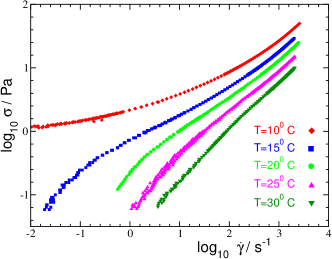
A representation where the subtleties of the non–linear flow curves are revealed most clearly is given when plotting the stress versus shear–rate. Figure 2 shows the flow curves of the thermosensitive particles for interaction strengths close to their glass transition. The data have been taken from Ref. Senff99 . Decreasing the temperature swells the particles such that the effective packing fraction can be thought to increase. A region for low , where depends strongly on density, can be seen apart from one at high , where a smaller variation is found. It is the region at low shear rates which is treated by the theory, i.e. where structural dynamics dominates the flow curves. Theory suggests to plot the stress versus shear rate , instead of viscosity versus . This provides a direct comparison with Fig. 1. The lack of straight pieces in Fig. 2 indicates the absence of true power–law shear–thinning, , which would show up as .
III.3 Elimination of effects from hydrodynamic interactions
The ideal analysis of the structural part of experimental flow curves, which only requires to be matched at the transition point, is hindered by inevitable quantitative errors of the theory in calculating various constants, like e.g. the critical packing fraction, the yield stress at the critical point, the transversal elastic constant, and other quantities that are determined by the dispersion structure. Obviously, these quantities cannot be calculated within schematic models where a small number of vertices replaces the structural information. In a schematic model analysis, therefore, the overall stress amplitude has to be fitted;
| (6) |
The time scale is easily determined within the schematic model, and may then for convenience be eliminated in favor of the intrinsic decay rate of the model. We adopt this convention, as can be read off more easily from the curves.
The ideal analysis must also require that parameters like , , and that are not treated by the model are constants. In particular, , and are related to hydrodynamic interactions. To accomodate for these unknown parameters and their non–negligible density dependences, an analysis using schematic models can proceed via relaxing the restriction that all parameters except for are constant. The data shown in Fig. 2 exhibit a density dependence of the stress at high which is not contained in the –model; comparison with Fig. 1 shows that the model leads to a constant, , which thus does not constitute a full description of the hydrodynamic effects. Thus in Eq. (6), a temperature dependence needs to be included in the parameter . As discussed in Ref. Fuchs04b , we expect that this needs to be accounted for by including a temperature dependence of . In order to keep the number of temperature dependent parameters as small as possible, in the following analysis all temperature dependent corrections beyond the model are assumed to arise from , the temperature dependence of the overall stress prefactor. The final expression used for the data analysis with the –model thus becomes
| (7) |
where, captures the temperature dependence of all vertex parameters, as has been discussed repeatedly in the literature for this model without shear.
III.4 Data analysis
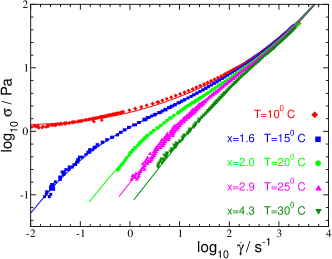
The parameters obtained from fits of the schematic model curves to the experimental data are given in table I. The fits are shown in Fig. 3. Adjusting the parameters starts with the data sets closest to the glass transition at , where the overall scales and can be found as the flow curves show the strongest variations in curvatures, and then proceeds to the temperatures farther away.
| 10 | 15 | 20 | 25 | 30 | |
| 0.010 | -0.037 | -0.108 | -0.20 | -0.315 | |
| in Pa | 4.69 | 2.93 | 2.35 | 1.62 | 1.09 |
| in Pa s | 1.67 | 1.04 | 0.84 | 0.58 | 0.39 |
| in Pa s | 341 | 27 | 5.7 | 1.7 |
The transition to a yielding solid at is found to lie around , where the critical value of the yield stress is Pa. It needs to be noted that the transition is not brought about directly by the change of temperature but by the change of the volume fraction of the particles with temperature. For lower temperatures, the yield stress increases quickly, Pa. At the fluid side of the transition, the zero shear rate viscosity increases by more than two decades, while the high shear rate viscosity changes by less than a factor 5. is not predicted by the present model, it arises from hydrodynamic interactions, but it is taken into account by by varying with temperature.
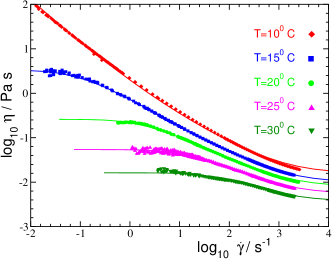
Replotting the data and model results in the classical flow curves showing viscosity versus shear rate. This enlarges the variation along the ordinate and thus suppresses the slight deviations of the fits from the data. Figure 4 shows the curves without rescaling so that the temperature dependence of the high shear rate viscosity becomes apparent.
IV Conclusion
A quantitative comparison of a first–principles approach to the
nonlinear rheology of dense colloidal systems
Fuchs02 ; Fuchs02b with experimental data obtained in model
dispersions Senff99 has been given. The employed schematic
–model of the nonlinear rheology has been obtained
after simplifying steps based on the microscopic mode
coupling theory. The speed up of the structural relaxation
brought about by shearing the suspension is the central mechanism
considered which causes shear thinning and yielding behaviors. It
enters the schematic model via a
time–dependent suppression of long–term memory.
The comparison with the experimental data demontrates that this model
captures the essential features of the flow behavior of concentrated
suspensions: i) the strong shear thinning with increasing shear
rate, and ii) at low shear rates the transition from a Newtonian
liquid to a soft yielding solid. Using the usual assumption that the hydrodynamic
interactions can be described solely in terms of a high–shear
viscosity a full description of the experimental
data by Eq. (7) has become possible (see
Fig. 3). The comparison demonstrates that the strong raise
of the viscosity with increasing volume fraction can be fully
explained by the structural arrest of the particles when approaching
the volume fraction of the glass transition. It is hence evident
that mode coupling theory that provides an excellent description of
the dynamics of quiescent suspensions yields also a quantitative
explanation of flow curves observed for
suspensions subjected to a
steady shear field.
Acknowledgements.
We thank J.-L. Barrat, J. Bergenholtz, L. Berthier, A. Latz and G. Petekidis for discussions. M.F. thanks M.E. Cates with whom the theoretical approach was developed for enlightening discussions. M.F. was supported by the DFG, grant Fu 309/3. M. B. was supported by the DFG, SFB 481, Bayreuth.References
- (1) W. B. Russel, D. A. Saville, and W. R. Schowalter, Colloidal Dispersions (Cambridge University Press, New York, 1989).
- (2) R. G. Larson, The Structure and Rheology of Complex Fluids (Oxford University Press, New York, 1999).
- (3) G. Petekidis, D. Vlassopoulos, and P. N. Pusey, J. Phys.: Cond. Mat. 16, S3955 (2004).
- (4) H. M. Laun, R. Bung, S. Hess, W. Loose, O. Hess, K. Hahn, E. Hädicke, R. Hingmann, F. Schmidt, and P. Lindner, J. Rheology 36, 743 (1992).
- (5) G. Petekidis, A. Moussaid, and P. N. Pusey, Phys. Rev. E 66, 051402 (2002); G. Petekidis, D. Vlassopoulos, and P. N. Pusey, Faraday Disc. 123, 287 (2003).
- (6) J. F. Brady, J. Chem. Phys. 99, 567 (1993).
- (7) R. A. Lionberger and W. B. Russel, Adv. Chem. Phys. 111, 399 (2000).
- (8) S. P. Meeker, W. C. K. Poon, and P. N. Pusey, Phys. Rev. E 55, 5718 (1997).
- (9) W. Götze, J. Phys.: Condens. Matter 11, A1 (1999).
- (10) Z. Cheng, J. Zhu, P. M. Chaikin, S.-E. Phan, and W. B. Russel, Phys. Rev. E 65, 041405 (2002).
- (11) M. Fuchs, Faraday Disc. 123, 322 (2003).
- (12) G. Nägele and J. Bergenholtz, J. Chem. Phys. 108, 9893 (1998); A. J. Banchio, J. Bergenholtz, and G. Nägele, J. Chem. Phys. 111, 8721 (1999).
- (13) M. Fuchs and M. R. Mayr, Phys. Rev. E 60, 5742 (1999).
- (14) W. Götze, in Liquids, Freezing and Glass Transition, edited by J.-P. Hansen, D. Levesque, and J. Zinn-Justin (North-Holland, Amsterdam, 1991), p. 287.
- (15) W. Götze and L. Sjögren, Rep. Prog. Phys. 55, 241 (1992).
- (16) W. van Megen and S. M. Underwood, Phys. Rev. Lett. 70, 2766 (1993).
- (17) W. van Megen and S. M. Underwood, Phys. Rev. E 47, 248 (1993).
- (18) W. van Megen and S. Underwood, Phys. Rev. E 49, 4206 (1994).
- (19) C. Beck, W. Härtl, and R. Hempelmann, J. Chem. Phys. 111, 8209 (1999).
- (20) E. Bartsch, T. Eckert, C. Pies, and H. Sillescu, J. Non-Cryst. Solids 307–310, 802 (2002).
- (21) T. Eckert and E. Bartsch, Faraday Discuss. 123, 51 (2003).
- (22) T. G. Mason and D. A. Weitz, Phys. Rev. Lett. 75, 2770 (1995).
- (23) M. Fuchs and M. E. Cates, Phys. Rev. Lett. 89, 248304 (2002).
- (24) M. Fuchs and M. E. Cates, Faraday Disc. 123, 267 (2003).
- (25) M. Fuchs and M. E. Cates, J. Phys.: Cond. Mat. 15, S401 (2003); M.E. Cates, C.B. Holmes, M. Fuchs and O. Henrich, in Unifying Concepts in Granular Media and Glasses, edited by A. Coniglio et al., (Elsevier, Amsterdam, 2004), p. 203.
- (26) H. Senff, W. Richtering, Ch. Norhausen, A. Weiss, M. Ballauff, Langmuir 15, 102 (1999).
- (27) P. Strating, Phys. Rev. E 59, 2175 (1999);
- (28) M. Fuchs and M. Ballauff, Colloids Surf. A: Physicochem. Eng. Aspects, to be published (2005).
- (29) T. Franosch, M. Fuchs, W. Götze, M. R. Mayr, and A. P. Singh, Phys. Rev. E 55, 7153 (1997).
- (30) W. Götze, Z. Phys. B 56, 139 (1984).
- (31) I. Deike, M: Ballauff, N. Willenbacher, A. Weiss, J. Rheol. 45, 709 (2001).
- (32) S. Seelenmeyer, I. Deike, S. Rosenfeldt, Ch. Norhausen, N. Dingenouts, M. Ballauff, T. Narayanan, J. Chem. Phys. 114, 10471 (2001).
- (33) N. Dingenouts, S. Seelenmeyer, I. Deike, S. Rosenfeldt, M. Ballauff, P. Lindner, T. Narayanan, Phys. Chem. Chem. Phys. 3, 1169 (2001).