Theories and models of superconducting state Critical point phenomena Theories and models of many-electron systems
Weak phase separation and the pseudogap
in the electron-doped cuprates
Abstract
We study the quantum transition from an antiferromagnet to a superconductor in a model for electron- and hole-doped cuprates by means of a variational cluster perturbation theory approach. In both cases, our results suggest a tendency towards phase separation between a mixed antiferromagnetic-superconducting phase at low doping and a pure superconducting phase at larger doping. However, in the electron-doped case the energy scale for phase separation is an order of magnitude smaller than for hole doping. We argue that this can explain the different pseudogap and superconducting transition scales in hole- and electron-doped materials.
pacs:
74.20.-zpacs:
05.70.Jkpacs:
71.10.-w1 Introduction
High-temperature superconducting materials (HTSC) are characterized by strong electronic correlations which are responsible for a number of anomalous properties and competing phases. The occurrence of these anomalous phases is probably related to the close proximity of the Mott-insulating and antiferromagnetic (AF) phases at half-filling. This is particularly true for hole- (p-)doped materials which, besides the AF and the superconducting (SC) states, display a number of unconventional phases such as stripes [1, 2], checkerboard structures [3], non-Fermi liquid phases, etc. It has been argued that these inhomogeneous phases originate from an instability of the AF phase towards phase separation [2], which is intrinsic in models with short-range interactions such as Hubbard or models. On the other hand, long-range Coulomb repulsion enforces charge homogeneity at long distances so that stripes, other short-range charge inhomogeneities, or strong charge fluctuations can originate as a compromise between the two competing effects [2, 4, 5]. A number of theories support the notion that fluctuations of these inhomogeneities, or of related order parameters, are responsible for the pseudogap observed in p-doped materials [2, 6, 7]. In this case, one would expect the corresponding (low) pseudogap temperature scale to be indirectly related to the phase-separation energy scale.
The situation is not clear in electron- (n-)doped cuprates (especially in the Nd- and Pr-CeCuO compounds). These materials display a more continuous transition from the AF to the SC state [8]. Stripes have not been observed so far, although there are indications of electronic phase inhomogeneities [9, 10]. In some mean-field calculations based upon the single-band Hubbard model for n-doped materials, the AF gap closes continuously leading to a quantum-critical point (QCP) and no instabilities towards inhomogeneous phases are detected [11, 12], suggesting that the pseudogap is directly related to fluctuations of the AF gap. On the other hand, calculations based upon the three-band Hubbard model yield stripes - although with different properties - even in n-doped cuprates [13].
It is an important issue to understand whether the closing of the AF gap in n-doped cuprates, and thus the evolution from the AF to the SC state may be related to an instability towards inhomogeneous phases, in qualitative analogy to p-doped materials, or whether this evolution is more continuous, as the phase diagram of n-doped cuprates seems to suggest [14].
In this paper, we address the issue of the AF to SC transition by an analysis of the single-band Hubbard model for parameters appropriate to n- and p-doped compounds via variational cluster perturbation theory (VCPT) [15, 16, 17]. VCPT is appropriate to deal with strongly-correlated systems, since the short-range interaction part is solved exactly within a small cluster. A similar analysis has been recently carried out by Sénéchal et al. [12]. In that paper, the authors show that the single-band Hubbard model is sufficient to explain the different shape of the phase diagram between p- and n-doped cuprates. Their results also suggest that the AF to SC transition is continuous and associated with a quantum critical point. In contrast, our results show that the issue of phase separation for the AF to SC transition in n-doped materials requires a high accuracy in the determination of energies, which is possible within the present work only thanks to two technical improvements of the VCPT calculations, which we are going to describe in detail below. The interplay between AF and SC was also studied previously via a number of numerical techniques, see, e. g. Ref. [18].
Our main results concerning the nature of the AF to SC transition (see Fig. 1)
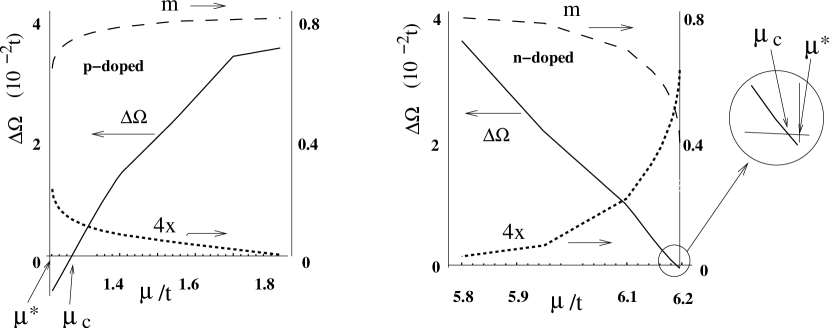
are the following: In p-doped systems the situation is quite clear: the transition is first order in , i.e., there is an instability towards phase separation with a jump in doping and staggered magnetisation at the transition ( in Fig. 1). We stress again that by allowing for a more general spatial dependences of the order parameter, this macroscopic phase separation could be possibly replaced by other microscopically inhomogeneous phases, such as, e.g., stripes. Certainly, this is expected to be the case if long-range Coulomb interaction is taken into account [2]. On the other hand, in contrast to previous theoretical calculations, our results also suggest phase separation in the n-doped case, although the corresponding energy scale (see blowup in Fig. 1) is one order of magnitude smaller than in p-doped compounds.
In agreement with Ref. [12], we find that the AF phase actually mixes with a weak d-wave SC component at small doping. A similar coexistence phase is observed, for example, in PrCeCuO [10], and was obtained in several calculations [19, 20]. On the other hand, such a cohexistence obtained at the mean-field level could be just a signal for the presence of strong pairing fluctuations within the AF phase, as we discuss below. Upon increasing doping, there is a transition to a pure d-wave SC phase. At larger doping, some experiments and theories suggest a transition to a SC phase with different pairing symmetries in n-doped cuprates, such as or mixed and phases [21, 22, 23]. However, this high-doping regime in beyond the scope of the present paper.
2 Method
We consider the two-dimensional single-band Hubbard model with nearest-neighbor () and next-nearest-neighbor () hoppings, and Hubbard repulsion . We take typical parameters valid for both hole- and electron-doped high- cuprates [24], namely and . Although some slight difference have been suggested between the parameter values ( and ) of n- and p-doped compounds, we keep them equal in order to just focus on the differences due to hole- and electron- doping only. We stress that the aim of our calculation is a general description of the materials, so that we don’t aim at carrying out an accurate fitting of the parameters. We have in fact checked that different values for the parameters (e. g., a different or within ) or a third-neighbor hopping does not affect our qualitative conclusions.
Within the CPT approach [25, 26], the lattice is partitioned into disconnected clusters. The Hamiltonian of the disconnected lattice can be solved by exact diagonalization. The intercluster hopping Hamiltonian is then treated perturbatively up to first order for the self-energy. VCPT (or SFA) [16, 17] generalizes this approach by decomposing into a “reference” part and a “perturbation” , the latter containing single-particle terms only. In general, one can take , i. e., add to the cluster an arbitrary single-particle Hamiltonian , as long as is still exactly solvable numerically. In order to conserve the total physical Hamiltonian , must then be subtracted from [17], which requires . This extension allows for the description of symmetry-broken phases by introducing, via , a corresponding symmetry-breaking field. Notice that, due to this subtraction the field is only fictitious. However, due to the fact that the subtraction is only carried out in a perturbative way, results in fact do depend on , except for the case where CPT becomes exact. This apparent “arbitrariness” in the choice of is restricted by the requirement that the self-energy functional [16] (which corresponds to the CPT grand-canonical potential)
| (1) |
has to be stationary with respect to . In (1), and are the grand-canonical potential and the Green’s function of the reference system , respectively, and is the Green’s function of the physical system calculated perturbatively in [17]. Physically, one can consider VCPT as an extension of CPT in which the intercluster perturbation is not carried out with respect to the exact cluster ground state but with respect to an “optimized” state parametrized by . This is similar in spirit to diagrammatic expansions in which the “bare” Green’s functions are replaced by “dressed” mean-field Green’s functions in some symmetry-broken state such as AF or SC.
Since we expect to describe both an AF and a d-wave SC phase, in our calculation contains both a staggered () and a nearest-neighbor d-wave pairing field (). More specifically, , where , and . Here, destroys an electron on lattice site with spin projection . is the corresponding density operator, is the antiferromagnetic wave vector, and the -wave factor is non vanishing for nearest-neighbor lattice sites only and is equal to () for in () direction. In the SC term, the sum is restricted to and belonging to the same cluster.
Away from half-filling, in addition to the symmetry-breaking terms, it is necessary to add to the reference system a “fictitious” on-site energy, i. e.
| (2) |
which plays the role of a “shift” in the cluster chemical potential with respect to the “physical” chemical potential . Without this term, which has been omitted in Ref. [12], the mean particle density ( is the doping, corresponds to p- and n-doping, respectively) cannot be unambiguously determined, as different results would be obtained by evaluating it as or as the usual trace over the Green’s function. Of course, a consistent treatment of the particle density is important for an accurate analysis of phase transitions as a function of doping, and of phase separation. Unfortunately, the inclusion of considerably complicates the numerical treatment, as now is not simply a minimum with respect to its parameters, but a saddle point (typically a maximum in the direction). Physically, one can regard as a Lagrange multiplier which enforces an appropriate constraint in the particle number [27]. Along this constraint, is then a minimum with respect to and .
For an appropriate characterization of the phase transition, it is necessary to evaluate with high accuracy. This is difficult to achieve by simply numerically carrying out the frequency integrals contained in the trace in (1). It is rather convenient to exploit the fact that these integrals can be replaced (at zero temperature ) by a sum over the negative poles of and of (see Ref. [28] for details). While the latter are directly given by the single-particle and single-hole excitation energies of the cluster, the former can be directly obtained as the eigenvalues of the matrix in Eq. (17) of Ref. [29] [27]. Since this method requires the evaluation of all cluster single-particle and single-hole states, a complete diagonalization of the cluster Hamiltonian must be carried out. In addition, the dimension of the matrix is equal to the number of single-particle and single-hole states. This restricts the maximum cluster sizes that can be considered in our VCPT calculation. For this reason, we only consider an infinite lattice split into clusters as a reference system. We stress again that this is necessary in order to achieve an accuracy that permits the resolution of the tiny phase-separation energy scale in the n-doped case (see blowup in Fig. 1). Of course one could argue that finite-size corrections may introduce a even larger inaccuracy. However, while quantitative changes are expected for larger clusters, we observe that our result about phase separation is quite robust and only weakly dependent on other parameters such as for , or . In addition, our calculation does show that at least such an accuracy is required in order to address the issue of phase separation in the n-doped case.
3 Results
Our calculation, thus, proceeds as follows. For a given value of the variational parameters , , and we carry out a complete diagonalization of the cluster Hamiltonian (due to the presence of the pairing field, particle number is not conserved), evaluate as described above, and look for a stationary solution as a function of the variational parameters. Quite generally, different stationary solutions can be found, corresponding, for example, to different phases. In this case, the minimum selects the most stable phase. Near half-filling, the two most stable solutions are a coherently mixed AF+SC and a pure SC phase, in agreement with Ref. [12]. Results for these solutions are plotted in Fig. 1 for the p- and n-doped cases. The AF order parameter is plotted as a dashed line for both n- and p-doped systems as a function of . monotonously decreases upon going away from half-filling. In Fig. 1, we also plot the doping and the difference between the grand-canonical potentials of the SC and the AF+SC solutions. While at lower doping the AF+SC phase is stable, a crossing to the SC phase occurs at a critical chemical potential for which is still nonzero, i. e. the transition is first order as a function of both for the p- as well as for the n-doped case, as anticipated. Although, from Fig. 1, this effect appears to be very small for the n-doped case, we stress that our calculation was carried out with sufficient accuracy to resolve this energy difference. At this value of , the doping of the AF+SC phase is different from the one of the pure SC phase so that there is a jump in the doping at indicating phase separation between a weakly doped AF+SC and a higher doped SC phase. Eventually, for some (further away from half filling than ) the AF+SC solution ceases to exist. In principle, an unstable AF+SC solution continues to exist for . However, in this region is a decreasing function of the particle density, which is an equivalent indication of phase separation.
The difference can be considered as a measure of the characteristic phase-separation energy per particle, i.e., it is proportional to the energy barrier between the two doping values and . As one can see from Fig. 1, in the p-doped case this energy scale () is about an order of magnitude larger than in the n-doped case (). Taking typical values for the energy unity (), this corresponds to a temperature scale of in p-doped, and in electron- doped cuprates, which is roughly of the order of the corresponding (low-energy) pseudogap temperature scales observed in these materials [30]. Also the discontinuity (not shown) is larger in the p-doped case (, vs. for n-doped), although the difference is not significant. At the same time, the doping at which the AF+SC solution is destroyed is much larger in n-doped () than in p-doped systems (), in qualitative agreement with experiments [8, 14]. Therefore, our results suggest that the AF+SC to SC transition as a function of is clearly first order in the p-doped case while weakly first order for n-doping.
4 Single-particle spectrum
The different behavior between n- and p-doped systems can be understood by considering the doping evolution of the single-particle spectrum from the AF insulator to a SC displayed in Fig. 2.
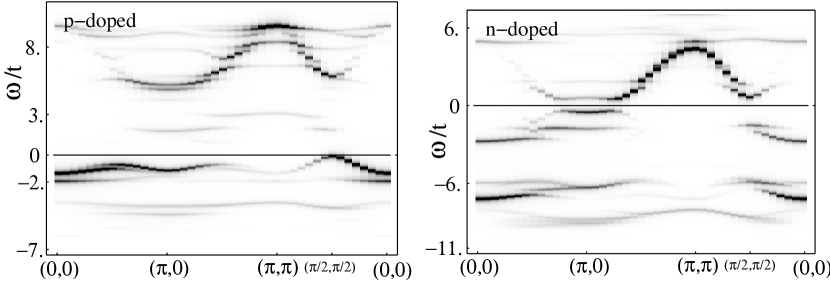
In agreement with experiments [31, 32], in p-doped cuprates doped holes first enter at [33]. On the other hand, in n-doped materials doped electrons initially form pockets around [31, 32, 11]. At the density of states is larger, and the fact that lies within the SC gap apparently stabilizes the AF solution for a larger doping range, allowing for the AF gap to decrease more gradually in the n-doped case. The transition to a non-magnetic solution appears to occur as soon as the Fermi energy touches the top of the band at . At this nodal point the SC gap is zero, so that doping into nodal particles apparently destabilizes the AF solution. This appears to be the reason why in the p-doped case the AF solution, where hole are first doped near (see also Ref. [11]), is stable only in a smaller doping range. Numerically, we observe the following behavior: as long as remains below (above for p-doped) the band around , there is only an absolute minimum of at a finite value of the staggered field (we keep the other two fields and at their saddle point). As soon as enters the band at , also develops a local minimum at , which becomes rapidly lower in energy than the minimum . Eventually, the local maximum lying between the two minima at and merges into the minimum at so that this latter minimum disappears. The observation that doping into makes the AF phase unstable suggests that the occurrence of phase separation is generic and quite independent on specific parameters (unless, of course, one adds some doping-dependent potential). Finally, let us mention that the Fermi-surface evolution of the n-doped system as a function of (not shown) qualitatively reproduces the ARPES experiments [32]: For small doping, we obtain electron pockets around , while for larger doping our results display an evolution to a large Fermi surface centered around .
5 Discussion and conclusions
The VCPT method exactly treats fluctuations up to the range of the cluster size, so that the question arises whether the SC solution we (and also others [22, 19, 12]) obtain within the AF phase is a true long-range SC phase or whether it is only a signal of strong pairing fluctuations within the AF phase leading to a SC pseudogap. The latter hypothesis could be supported by the fact that results obtained with different cluster sizes [12]seem to indicate a size dependence of the SC order parameter, and by the fact that the SC order parameter is about a factor three smaller in the AF+SC phase than in the pure SC one. The presence or not of such microscopic cohexistence phase may depend on material details. Certainly, our results suggest that the SC gap (or pseudogap in the case of fluctuations) is important in order to stabilize the AF phase in n-doped materials. On the other hand, hardly has an effect in p-doped systems since it does not produce any gap at the Fermi Surface, as doped holes first enter near the nodal points.
In conclusion, our calculations suggest that the destruction of the AF phase in n-doped systems is associated with a tendency towards phase separation, similarly to p-doped materials, although with an energy scale which is one order of magnitude smaller. In the presence of Coulomb interaction, this tendency is expected to produce a microscopically segregated phase, such as stripes or similar inhomogeneous structures [13] Following the idea that the pseudogap temperature is related to the formation of such segregated phases [2], our results provide reasonable orders of magnitudes for the pseudogap temperature scale, and, in particular, provide a possible explanation why this is much smaller in n-doped than in p-doped cuprates. The results of the present paper support the idea that the asymmetry between hole- and electron-doped materials can be understood within a simple single-band Hubbard model, at least concerning the portion of phase diagram we studied here. Of course, it remains an open issue, whether a three-band model may be necessary for a complete description. In fact, alternative theories propose that Ce- doping in n-doped compounds, such as NdCeCuO, occurs in a total different way. The idea there is that doped Ce atoms do not add electrons to the CuO2-layers, but rather are responsible for a quenching of Cu moments [34].
Acknowledgements.
We thank M. Potthoff and L. Alff for discussions and useful suggestions. This work is partially supported by the Doctoral Scholarship Program of the Austrian Academy of Sciences (M.A.) and by the DFG Forschergruppe n. 538.References
- [1] V. J. Emery, S. A. Kivelson, and J. M. Tranquada, Proc. Natl. Acad. Sci. USA 96, 8814 (1999).
- [2] E. W. Carlson, V. J. Emery, S. A. Kivelson, and D. Orgad, in The Physics of Superconductors, edited by K. H. Bennemann and J. B. Ketterson (Springer-Verlag, Berlin, 2003), Vol. I.
- [3] J. E. Hoffman et al., Science 295, 466 (2002).
- [4] U. Löw, V. J. Emery, K. Fabricius, and S. A. Kivelson, Phys. Rev. Lett. 72, 1918 (1994).
- [5] E. Arrigoni et al., Phys. Rev. B 65, 134503 (2002).
- [6] S. Caprara et al., JOURNAL DE PHYSIQUE IV 9, 329 (1999).
- [7] M. I. Salkola, V. J. Emery, and S. A. Kivelson, Phys. Rev. Lett. 77, 155 (1996).
- [8] G. M. Luke et al., Phys. Rev. B 42, 7981 (1990).
- [9] H.-H. Klauss private communication.
- [10] P. Dai et al., Phys. Rev. B (Condensed Matter and Materials Physics) 71, 100502 (2005).
- [11] C. Kusko, R. S. Markiewicz, M. Lindroos, and A. Bansil, Phys. Rev. B 66, 140513(R) (2002).
- [12] D. Sénéchal, P. L. Lavertu, M. A. Marois, and A. M. S. Tremblay, Phys. Rev. Lett. 94, 156404 (2005).
- [13] A. Sadori and M. Grilli, Phys. Rev. Lett. 84, 5375 (2000).
- [14] As a matter of fact, in some n-doped cuprates the SC phases sets on at relatively low dopings . For example, in La2-xCexCuO4 , see, e. g., M. Naito and M. Hepp, Jpn. J. Appl. Phys. 39, L485 (2000).
- [15] M. Potthoff, M. Aichhorn, and C. Dahnken, Phys. Rev. Lett. 91, 206402 (2003).
- [16] M. Potthoff, Eur. Phys. J. B 32, 429 (2003).
- [17] C. Dahnken et al., Phys. Rev. B 70, 245110 (2004).
- [18] J. Y. Gan, Y. Chen, Z. B. Su, and F. C. Zhang, Phys. Rev. Lett. 94, 067005 (2005).
- [19] A. I. Lichtenstein and M. I. Katsnelson, Phys. Rev. B 62, R9283 (2000).
- [20] M. Inui, S. Doniach, P. J. Hirschfeld, and A. E. Ruckenstein, Phys. Rev. B 37, R2320 (1988).
- [21] B. Stadlober et al., Phys. Rev. Lett. 74, 4911 (1995).
- [22] G. J. Chen, R. Joynt, F. C. Zhang, and C. Gros, Phys. Rev. B 42, 2662 (1990).
- [23] J. A. Skinta et al., Phys. Rev. Lett. 88, 207005 (2002).
- [24] C. Kim et al., Phys. Rev. Lett. 80, 4245 (1998).
- [25] C. Gros and R. Valenti, Phys. Rev. B 48, 418 (1993).
- [26] D. Sénéchal, D. Perez, and M. Pioro-Ladriere, Phys. Rev. Lett. 84, 522 (2000).
- [27] Details will be given elsewhere, M. Aichhorn, E. Arrigoni Unpublished.
- [28] M. Potthoff, Eur. Phys. J. B 36, 335 (2003).
- [29] M. G. Zacher, R. Eder, E. Arrigoni, and W. Hanke, Phys. Rev. B 65, 045109 (2002).
- [30] L. Alff et al., Nature 422, 698 (2003).
- [31] N. P. Armitage et al., Phys. Rev. Lett. 88, 257001 (2002).
- [32] N. P. Armitage et al., Phys. Rev. Lett. 87, 147003 (2001).
- [33] A. Damascelli, Z.-X. Shen, and Z. Hussain, Rev. Mod. Phys. 75, 473 (2002).
- [34] G. Baskaran, cond-mat/0505509 (unpublished).