Molecular motions in lipid bilayers studied by the neutron backscattering technique
Abstract
We report a high energy-resolution neutron backscattering study to investigate slow motions on nanosecond time scales in highly oriented solid supported phospholipid bilayers of the model system DMPC -d54 (deuterated 1,2-dimyristoyl-sn-glycero-3-phoshatidylcholine), hydrated with heavy water. This technique allows to discriminate the onset of mobility at different length scales for the different molecular components, as e.g. the lipid acyl-chains and the hydration water in between the membrane stacks, respectively, and provides a benchmark test regarding the feasibility of neutron backscattering investigations on these sample systems. We discuss freezing of the lipid acyl-chains, as observed by this technique, and observe a second freezing transition which we attribute to the hydration water.
pacs:
87.14.Cc, 87.16.Dg, 83.85.Hf, 83.10.MjI Introduction
Lipid membranes as model systems for more complex biological membranes Lipowsky and Sackmann (1995) cannot be understood without taking into account the structure and dynamics of their aqueous environment. The structure and dynamical properties of the bound water layers next to the bilayer as well as the ’free’ (bulk) water further away from the water/lipid interface are of importance in understanding the thermal, elastic and transport properties of membranes. Furthermore, the interaction between two bilayers is mediated by the hydration water Israelachvili and Wennerstroem (1990); Perera et al. (1996); Katsaras and Jeffrey (1997); Vogel et al. (2000); Pabst et al. (2002). A recent Molecular Dynamics (MD) simulation pointed out the importance of hydration water dynamics for the understanding of the dynamical transition of proteins Tarek and Tobias (2002). Complementing well established structure-function relationships in biophysics, possible dynamics-function relationships remain to date much less elucidated. The dynamical properties of membrane bound water present an important example in this context. While most spectroscopic techniques such as nuclear magnetic resonance (NMR) or dielectric spectroscopy, are limited to the center of the Brillouin zone and probe macroscopic responses, neutrons and within some restrictions also x-rays give unique access to microscopic dynamics on length scales of e.g. intermolecular distances. Here, we report on a high energy-resolution neutron backscattering study to investigate slow motions on nanosecond time scales in highly oriented solid supported phospholipid bilayers of the model system DMPC -d54 (deuterated 1,2-dimyristoyl-sn-glycero-3-phoshatidylcholine), hydrated with heavy water. The spectrum of fluctuations in biomimetic and biological membranes covers a large range of time and length scales König et al. (1992, 1994, 1995); Pfeiffer et al. (1989, 1993); Lindahl and Edholm (2000); Lipowsky and Sackmann (1995); Bayerl (2000); Salditt (2000), ranging from the long wavelength undulation and bending modes of the bilayer with typical relaxation times of nanoseconds and lateral length scales of several hundred lipid molecules to the short wavelength density fluctuations in the picosecond range on nearest neighbor distances of lipid molecules. Local dynamics in lipid bilayers, i.e. dynamics of individual lipid molecules as vibration, rotation, libration (hindered rotation) and diffusion, has been investigated by incoherent neutron scattering Pfeiffer et al. (1989); König et al. (1992, 1994) and nuclear magnetic resonance Nevzorov and Brown (1997); Bloom and Bayerl (1995) to determine, e.g. the short wavelength translational and rotational diffusion constant. Collective undulation modes have been investigated using neutron spin-echo spectrometers Pfeiffer et al. (1993); Takeda et al. (1999) and dynamical light scattering Hirn et al. (1998). Recently, the first coherent inelastic scattering experiments in phospholipid bilayers have been performed using inelastic x-ray Chen et al. (2001) and neutron Rheinstädter et al. (2004) scattering techniques to determine the short wavelength dispersion relation. Note that only scattering experiments give wave vector resolved access to dynamical properties, what is important to associate relaxation times with specific motions.
Information about fluctuations on mesoscopic length scales can be inferred from x-ray lineshape analysis Safinya et al. (1986); Nagle et al. (1996) in isotropic lipid dispersions. Off-specular x-ray and neutron reflectivity from aligned phases presents the additional advantage that the components of the scattering vector can be projected onto the symmetry axis of the membrane Lyatskaya et al. (2001); Salditt (2000); Salditt et al. (2003). In both examples, the time-averaged elastic scattering is studied, and information on e.g. elasticity properties and interaction forces can be obtained.
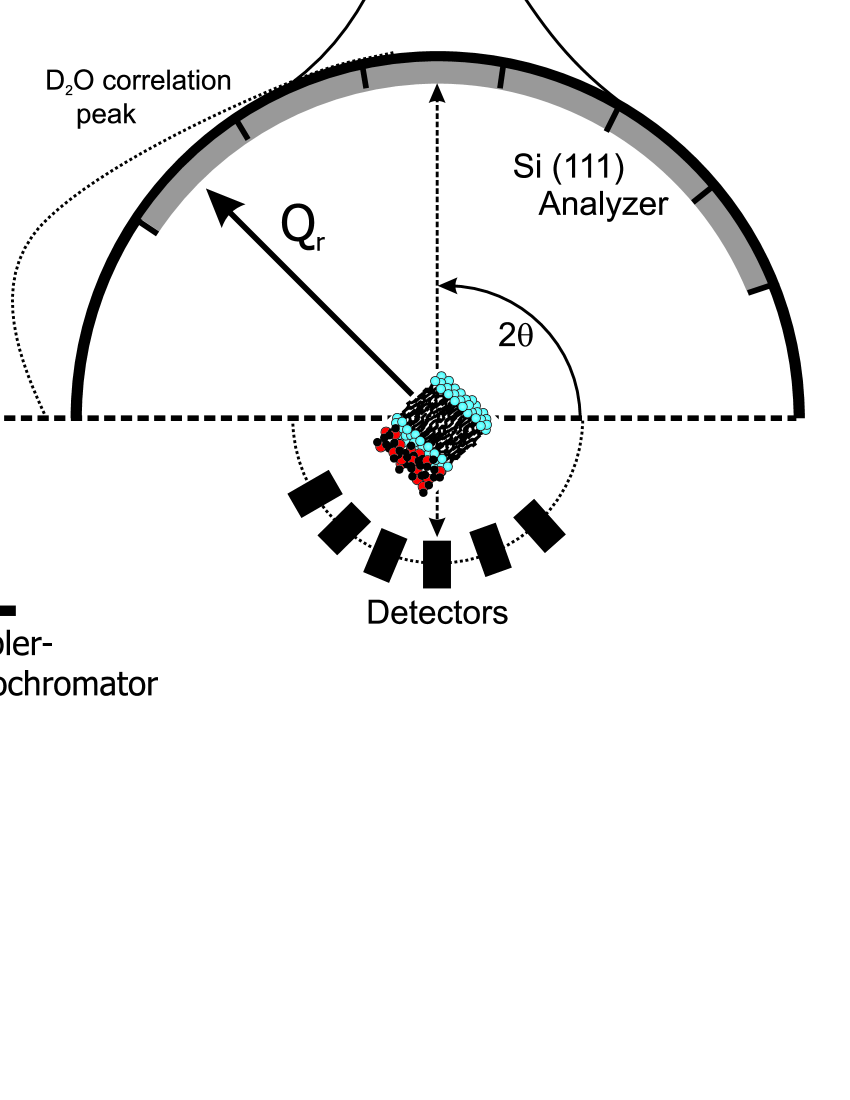
Contrarily, dynamical properties like transport coefficients can be inferred from direct measurements of dynamical modes. Again, these measurements are preferably carried out in aligned phases to preserve the unique identification of modes on the basis of the parallel and perpendicular components and of the scattering vector , as pictured in Fig. 1. Recently Rheinstädter et al. (2004), we have demonstrated that collective supra-molecular dynamics of planar lipid bilayers, notably the dispersion relation of density modes in the lipid acyl-chains, can be studied using the so-called three-axis neutron spectroscopy technique giving access to an energy resolution of up to about 300 eV . The low scattering volume of quasi two-dimensional planar membranes and the small inelastic signal pose particular experimental challenges. Sample preparation and experimental set-ups have to be adapted for inelastic experiments. In Ref. Rheinstädter et al., 2004 the scattering volume restriction was overcome by stacking several thousand highly aligned bilayers. These experiments shall be complemented in the present work by eV energy resolved spectra, achieved by the neutron backscattering technique. We thereby gain access to the low energetic density fluctuations corresponding to slow motions on nanosecond time scales. By analyzing the respective dependence, we simultaneously probe internal length scales from 3 to 18 Å and investigate freezing of the lipid acyl-chains and of the hydration water, i.e. the water layer in between the stacked membranes. The paper is organized as follows: In the next section, we briefly discuss hydration water in stacked planar membranes based on literature. Sect. III gives details of the experimental set-ups used for neutron backscattering and diffraction on three-axis spectrometers. The corresponding results are presented in Sects. III.1 and III.2 and discussed in Sect. IV.
II Hydration water in multilamellar oriented membrane stacks
Freezing of water in lamellar structures (DEPE, DEPC, DOPC) was first reported by Gleeson et al. Gleeson et al. (1994) from x-ray diffraction. König et al. König et al. (1994) have investigated the molecular dynamics of water in DPPC multilayers by quasielastic neutron scattering (QENS) and nuclear magnetic resonance (NMR). Neutron diffraction and QENS experiments on the interaction of hydration water and purple membranes have been reported by Lechner and Fitter and coworkers Lechner et al. (1998); Fitter et al. (1999). Additionally, Marrink et al. have investigated the ordering of membrane water in DPPC by Molecular Dynamics simulations (MD) Marrink et al. (1993).
The combination of experimental results and conclusions of the complementary techniques and experiments and the outcome of the simulations gives a plausible picture of the behavior of hydration water in multilamellar oriented membrane stacks. The basic scenario is the following Gleeson et al. (1994): The lamellar spacing proves to be a very fine measure for the water content in between the membrane stacks as it is sensitive to the number of water layers (hydration shells) between two bilayers (which have a thickness of about 3.5-4 Å). The membrane hydration water can be cooled well below the normal freezing point of (bulk) water. shows a hysteresis in heating and cooling cycles. When on cooling the temperature falls below the freezing temperature of bulk water and the hydration water becomes supercooled, starts to drop indicating a decreasing number of water layers between the stacks. Ice Bragg peaks appear with an intensity increase proportional to the decrease of . The authors conclude that the hydration water migrates out of the membrane stacks when freezing and condenses as ordinary ice outside the lamellar structure and the remaining hydration water is in equilibrium with bulk ice. There is no crystalline ice between lipid bilayers in an ordered multilamellar phase.
From QENS measurements at different degrees of hydration and orientations (with the scattering vector parallel and perpendicular to the plane of the bilayers), the different water dynamics and anisotropy can be extracted König et al. (1994). At low hydration of the bilayers, rotation of water molecules is the dominant motion without signs of translational diffusion. At high hydration a translational diffusion has to be allowed to fit the QENS spectra. The rotational degree of freedom corresponds to that of free bulk water, while the translational diffusion appears to be hindered, however, as compared to bulk water with a slightly but significantly smaller diffusion constant . The water dynamics is isotropic within the length scales probed of about 10 Å. The first hydration layers around the lipid head-groups are tightly bound and show rotational dynamics, only. Additional layers participate in the translational dynamics and behave like quasifree bulk water. The authors estimate that about 40% of the water in a hydrated sample is tightly bound.
The MD simulations show that the water structure is highly perturbed by the presence of the two membrane surfaces Marrink et al. (1993). The analysis of orientational polarization, hydrogen bonding and diffusion rates of the water molecules between the membranes reveals a strong perturbing effect, which decays smoothly towards the middle of the water layer. Bulk-like water is only found at a distance of 10 Å away from the interfacial plane. But even there, the hydrogen bonding pattern as well as diffusion rates show small but significant deviations, in agreement with the experiments.
III Experimental
Deuterated DMPC -d54 (deuterated 1,2-dimyristoyl-sn-glycero-3-phoshatidylcholine) was obtained from Avanti Polar Lipids. Highly oriented membrane stacks were prepared by spreading a solution of typically 25 mg/ml lipid in trifluoroethylene/chloroform (1:1) on 2” silicon wafers, followed by subsequent drying in vacuum and hydration from vapor Münster et al. (1999). Fifteen such wafers separated by small air gaps were combined and aligned with respect to each other to create a ’sandwich sample’ consisting of several thousands of highly oriented lipid bilayers (total mosaicity of about 0.6∘), with a total mass of about 400 mg of deuterated DMPC.
The experiment was carried out at the cold neutron backscattering spectrometer IN10 Alefeld et al. (1992) at the Institut Laue-Langevin (ILL) in its standard setup with Si(111) monochromator and analyzer crystals corresponding to an incident and analyzed neutron energy of 2.08 meV (=6.27 Å) (as sketched in Fig.1). Neutron backscattering was used to obtain wave vector-resolved dynamical information with a high resolution in energy transfer of about 0.9 eV FWHM. The high energy resolution in neutron backscattering results from the use of 90∘ Bragg angles at both the monochromator and analyzer crystals Maier-Leibniz (1966). Thus in principle the precision in the determination of the neutron wavelength is only limited by the Darwin width of the crystals used Darwin (1914). In the existing experimental implementations of the backscattering geometry, contributions from the beam divergence and deviations from exact 90∘ Bragg angles slighly deteriorate this precision. As is indicated in Fig.1, in the IN10 spectrometer a small deviation from exact backscattering occurs at the monochromator (less than 1∘) to allow for the returning neutrons to hit the deflector and subsequently illuminate the sample inside the secondary spectrometer. The scattered neutrons returning from the analyzers are detected in exact backscattering and thus may travel twice through the sample. This does not pose a problem since the total scattering probability by the sample is always kept below 10%. The incident beam is adequately pulsed, and therefore directly scattered neutrons can be discriminated from analyzed neutrons by their flight time.
The incident beam at the sample in our experiment was about 3 cm wide and 4.5 cm high with a divergence corresponding to the critical angle of Ni58. The sample was mounted in a hermetically sealed aluminium container within a cryostat and hydrated from vapor. Saturation of the vapor in the voids around the lipids was assured by placing a piece of pulp soaked in within the sealed sample container. The pulp was shielded by Cadmium to exclude any parasitic contribution to the scattering. The hydration was not controlled but we allowed the sample to equilibrate for 10 h at room temperature before the measurements. We note that the absolute level of hydration of the sample is therefore not precisely known 111A higher precision would require a cryostated in situ absorption isotherm apparatus which is at present not available., but the temperature of the main transition agrees quite well with literature values. We argue that the question of hydration might become more important when discussing relaxation times and diffusion constants while in this study we mainly concentrate on phase transitions and elastic scattering.
Using the IN10 spectrometer, two types of measurements could be performed: Firstly, fixed energy-window scans centered at zero energy transfer (FEW-scans), have been recorded as a function of the sample temperature. This scattering intensity can be regarded as purely elastic, within the excellent instrumental resolution rendering motions faster than approx. 4 ns already visible. Changes in this intensity may arise from either structural or dynamical changes, i.e. shifts of correlation peaks or freezing of dynamical modes. In connection with diffraction data, structural changes may be separated from dynamical effects. Thus, from FEW-scans, information on the onset and type of molecular mobility in the sample can be inferred and glass or melting transitions clearly identified and assigned to corresponding length scales by analyzing the corresponding -dependence. The second type of measurement was performed by Doppler-shifting the incident neutron energy through an adequate movement of the monochromator crystal. These energy scans correspond to a time range of motion in the sample on the order of .
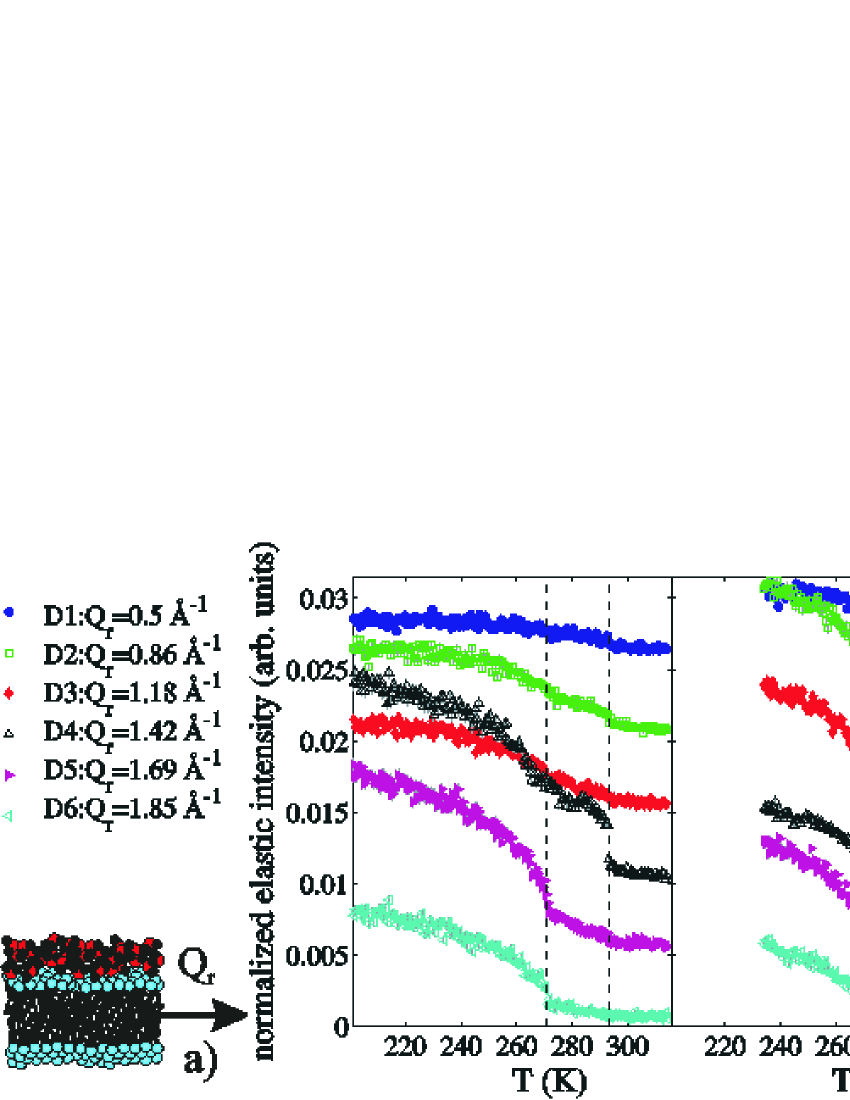
In view of its entangled geometry, the application of the neutron backscattering technique for probing dynamics at interfaces is challenging. Nevertheless, we demonstrate here the feasibility of backscattering on the lipid membrane sandwich samples. Analogously to the three-axis experiments, the samples have been oriented in the spectrometer to measure at wave vector transfers parallel and perpendicular to the lipid membrane plane, respectively. The IN10 analyzers cover an angular range of approximately 20∘ each, resulting in a rather poor -resolution (which does not allow to measure diffraction data to determine, e.g. the lamellar spacing ), but enhanced sensitivity for even very small inelastic signals. Note that we are therefore not sensitive to shifts of correlation peaks within this coarse resolution and corresponding structural changes of the bilayers. The six discrete detector tubes (D1-D6) of IN10 cover a total -range of 0.34 Å-1 up to 1.91 Å-1, namely
| Detector | center value | range |
|---|---|---|
| D1 | 0.5 Å-1 | 0.34 ÅD10.69 Å-1 |
| D2 | 0.86 Å-1 | 0.69 ÅD21.00 Å-1 |
| D3 | 1.18 Å-1 | 1.00 ÅD31.29 Å-1 |
| D4 | 1.42 Å-1 | 1.29 ÅD41.54 Å-1 |
| D5 | 1.69 Å-1 | 1.59 ÅD51.78 Å-1 |
| D6 | 1.85 Å-1 | 1.78 ÅD61.91 Å-1. |
The onset of molecular mobility can thus be measured separately but simultaneously for different molecular components at different values and length scales. The lipid acyl-chain correlation peak that occurs at 1.42 Å-1 was mainly detected in D4, as pictured in Fig. 1. Note that the diffraction angle of (heavy) bulk water (=2 Å-1) is not directly accessible on IN10 for geometrical reasons. The detector at highest angle (D6), which is centered at =1.85 Å-1, covers a range of approx. 1.78 Å1.91 Å-1 and measures in the tails of the broad (heavy) water correlation peak. D5 and D6 also cover the range of the (hexagonal, ) ice Bragg peaks (100), (002) and (101) at values of 1.605 Å-1, 1.706 Å-1 and 1.817 Å-1, respectively. We have measured all scans (elastic and inelastic) also with the membranes rotated by 90∘, hence with perpendicular to the membrane surface (), as a reference.
Complementary diffraction data have been measured on the cold and thermal three-axis spectrometers IN12 and IN3. IN3 was equipped with its multi analyzer detectorDemmel et al. (1998) to map out large areas of reciprocal space simultaneously, with all analyzers aligned to a fixed final energy of the scattered neutrons of =31 meV. IN12 was used with fixed =1.75 Å-1 resulting in a resolution of =0.02 Å-1. For the three-axis experiments, the sample was held in a dedicated humidity chamber and – as for the backscattering measurements – hydrated from the vapor phase. The use of a spectrometer to measure diffraction (energy transfer ) has a particular advantage when working with partially deuterated and/or biological samples containing C, O, N, H (or D). As the downstream analyzer cuts out the (within the instrumental resolution) elastically scattered neutrons, the quasielastic contribution to the background arising from incoherent scattering is reduced and the signal to noise ratio drastically improved.
III.1 Elastic neutron diffraction
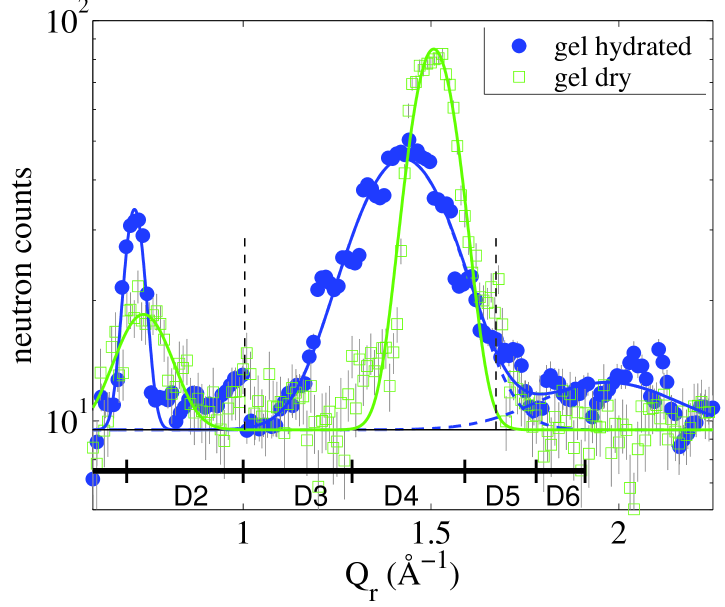
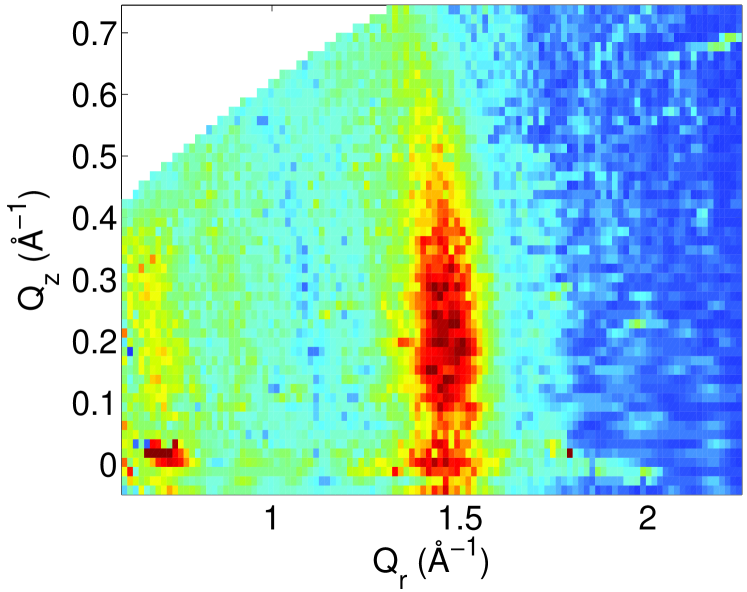
Figure 2 shows scans of DMPC, measured on IN12 and IN3 at =18, for a dry (ambient humidity) and a hydrated (=58.5 Å-1) DMPC sample, respectively. The measured range of 0.65 Å Å-1 covers the correlation peaks of the lipid acyl-chains ( Å-1) and heavy bulk water ( Å-1), which originate from the average nearest neighbor distances of acyl-chains and water molecules, respectively. The additional peak observed at around Å-1 could be a contribution of the packing of the lipid head groups in these gel or sub-gel phases, which is usually not seen with x-rays. But the exact assignment will need a dedicated study. As is well known, the position of the chain correlation maximum shifts to smaller values upon hydration, reflecting the corresponding increase of the nearest neighbor distance. An additional broad peak appears at around 2 Å-1 (FWHM 0.4 Å-1) and is attributed to the water layer between the membranes. Figure 3 shows a mapping of the elastic scattering intensity in the plane in the hydrated gel phase, at =18∘C. The intensity distribution reflects the quasi two-dimensional liquid structure, as discussed in Ref. Spaar and Salditt, 2003. The elongated rod-like peak can be understood by analogy with the well known crystal truncation rods in surface crystallography. This smearing of the intensity in the perpendicular direction is also well known from scattering of monolayers at the air water interface. Contrarily, the weak intensity at the water position ( Å-1) is truly isotropic and distributed over a Debye-Scherrer ring. Consequently, we expect a strong anisotropy in the backscattering experiment at the positions of the lipid acyl-chains, while scattering at the water position should be isotropic.
III.2 Backscattering
The intensity measured in the FEW scans is essentially equivalent to the ’elastic structure factor’ , except for minor temperature independent corrections, e.g. due to self-absorption or geometrical effects. In contrast to the x-ray or neutron elastic scattering factor, this is the ’true’ elastic scattering component which is measured with the highest possible energy resolution and minimal contribution from quasi-elastic or inelastic scattering. Changes in this intensity are basically sensitive to dynamical changes, since the excitation of dynamical modes will shift scattering intensity from zero to finite energy transfer, out of the tight fixed energy window. Note that FEW data may include contributions from coherent and incoherent scattering, i.e. from pair- and autocorrelated scattering (collective and local modes).
Figure 4 shows FEW scans for all detectors in a temperature range of 200-315 K to map out the transition of the different molecular components from immobile to mobile as a function of temperature for the two set-ups, with (a) the scattering vector placed in the plane of the membranes and (b) perpendicular to the bilayers. Both measurements have been taken while cooling with a constant rate of 0.1 K/min and counting times of 5 min per point. Note that we are therefore not sensitive to possible temperature shifts smaller than the temperature resolution of about 0.5 K. The data are shown as raw data without any correction, solely normalized to the incident beam monitor. The contributions by the Aluminum can and cryostat and Silicon wafers are in any case temperature independent, as is the individual detector efficiency and effects induced by the sample geometry. Note that the wavelength used is too long to excite the Aluminum Bragg peaks. The in-plane component () in Fig. 4 (a) shows a distinct step in D4 at 293 K, which is the temperature of the main transition from the (gel) into the fluid phase of the deuterated DMPC bilayers. The transition occurs some degrees lower in the deuterated compound (at 20.15∘C=293.3 K Guard-Friar et al. (1985)) as compared to protonated DMPC and is detected in D4, where the maximum of the static structure factor of the lipid-chains (the acyl-chains correlation peak) occurs. A second, kink-like anomaly appears in detectors D5 and D6 at about 271 K. In the perpendicular direction ( shown in Fig. 4 (b)), D5 and D6 display a similar temperature behavior as for . Thus, the scattering at the corresponding position can be concluded to be isotropic. Contrarily, the two D4 curves along and along , respectively, exhibit different functional forms. In particular the step-like anomaly at 293 K is lacking in the curve, indicating an anisotropic scattering at this . This strong anisotropy of the acyl-chain correlations has been suggested by the elastic intensity distribution in Fig. 3. It is therefore not astonishing that temperature induced changes in the dynamics (within the experimental window of time and length scales) measured at the position of the acyl chain peak is also anisotropic.
To quantify the anisotropy of the elastic scattering, we consider the intensity along as ’background’ (Fig. 4 (b)) and subtract these scans from the scans in Fig. 4 (a). Thus in Fig. 5 we plot the monitor normalized intensity differences . In this representation, isotropic contributions to the signal cancel out, and anisotropic contributions become more pronounced due to the background subtraction. Note that this intensity difference becomes negative if the elastic contribution along is stronger than along and can no longer to be considered as a background. This is the case for the small angle detectors D1-D3, which are expected to pick up signal from the lamellar Bragg sheet tails (non-specular reflectivity). As shown in Fig. 5, two well separated freezing steps (’immobile’ within the resolution window), of the lipid acyl-chains at 293 K and at about 271 K are clearly visible in detectors D4, D5 and D6.
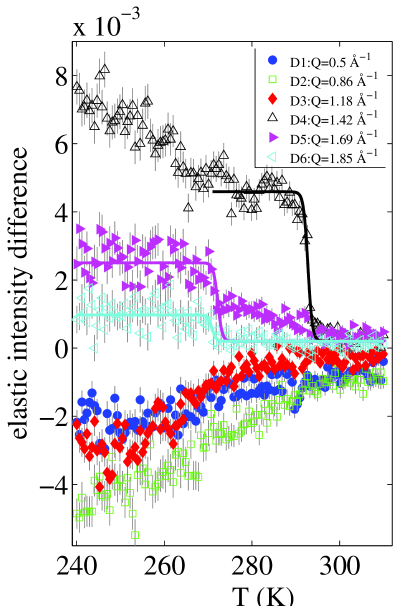
Note that D5 obviously still shows traces of the freezing step in the lipid acyl-chains.
Figure 6 shows the important temperature range around the main phase transition for the D4 detector, which is dominated by the lipid acyl-chain correlation signal.
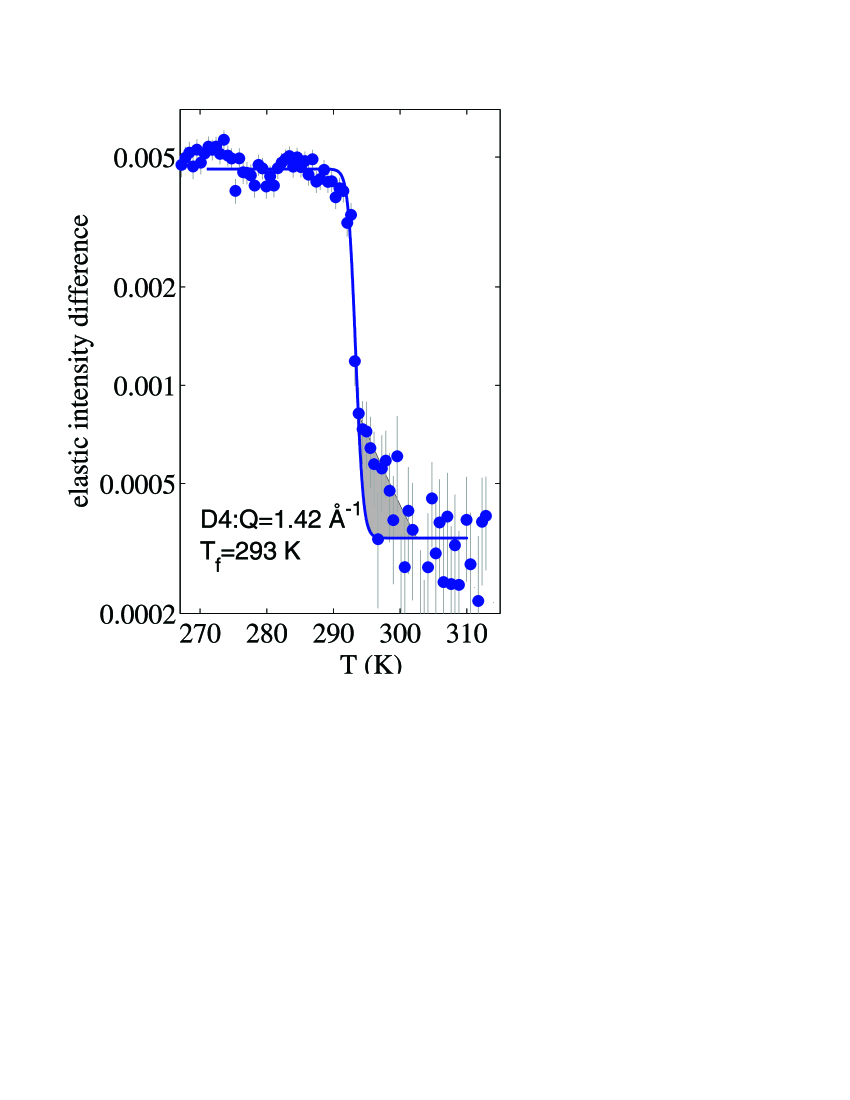
There is a sharp freezing step at =293 K, corresponding to the temperature of the gel-fluid phase transition in deuterated DMPC. Above up to about 302 K, we observe a regime with a smaller slope which coincides with the temperature range of pseudocritical (anomalous) swelling in DMPC, as it will be discussed below.
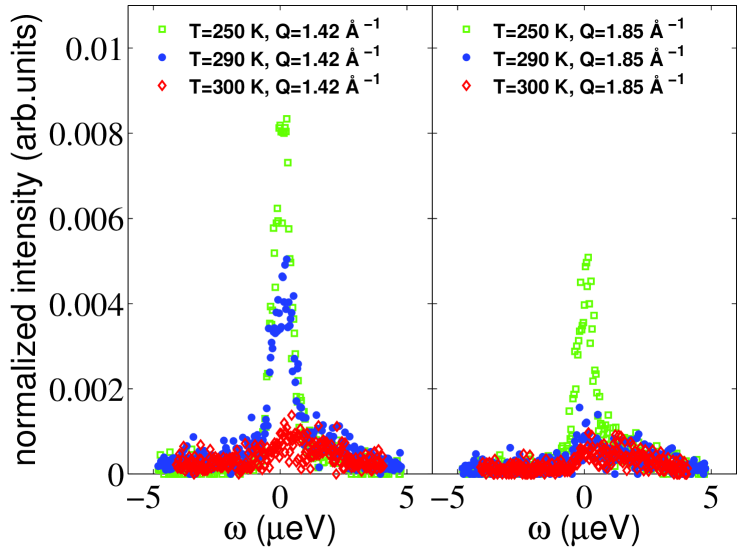
Fig. 7 shows representative energy transfer scans of the deuterated DMPC membrane stack. The data have been taken at three different temperatures, at =250 K, 290 K and 300 K with a typical counting time of about 9 hours per temperature. For these scans, the detected neutrons are sorted into discrete channels which are evenly spaced in the measured voltage signal arising from an induction coil at the mechanical Doppler drive. The energy transfer is then calculated from this voltage signal by using the known frequency of the sinosoidal Doppler monochromator movement and the constant channel width in terms of voltage. Therefore, we note that a systematic error may not be completely ruled out for the energy scale of the data. From the data, the onset of molecular mobility on the corresponding length scales can be inferred. The presence of an elastic peak in the spectra points to static order over the experimental time window. Note that a fluid system does not show elastically scattered intensity, i.e. no order at infinitely long time scales. Even within the very limited statistics, the different dynamics are clearly visible: While the lipid acyl-chains melt between 290 and 300 K, melting at the water position already occurs between 250 and 290 K.
IV Discussion
The backscattering detectors cover the range of the correlation peaks of the lipid acyl-chains, bulk water and ice. The diffraction data in Figs. 2 and 3 show that the corresponding correlations lead to signals in the neutron scattering experiments and allow to study simultaneously lipid and water dynamics in the backscattering experiment at the positions of the corresponding correlation peaks. In particular, this study allows to discriminate the immobile-to-mobile transitions of the lipid acyl-chains and the water. The dynamics of the membrane associated water is relevant for biological membrane function in the physiological temperature range. The neutron backscattering technique can contribute to a quantitative understanding of the water dynamics in membranes. Structural and dynamical changes can lead to an increase or loss of elastically scattered intensity in the backscattering experiment. A structural transition or change might lead to a shift of correlation peaks, which then move out of the respective detector. Slowing down (freezing with respect to the instrumental resolution and the accessible time window) of dynamical degrees of freedom gives a quasi-static contribution and leads to an increase in the elastically scattered intensity. Because of the relaxed resolution, the backscattering experiment does not allow to probe small -shifts of the acyl chain correlation peak 222The resolution is dependent and increases from =0.35 Å-1 for D1 to 0.13 Å-1 for D6. At the position of the lipid correlation peak (D4), the resolution is =0.25 Å-1. We are therefore not sensitive to the shift of the inter acyl-chain correlation peak from the gel into the fluid phase within less than 0.1 Å-1 (1.46-1.38 Å-1) (see e.g., Ref. Rheinstädter et al., 2004). and we therefore argue that we are basically sensitive to dynamical changes.
There is a sharp freezing step in the FEW scans in the detector located at =1.42 Å-1, indicating a first order transition at =293 K. The onset of mobility in the acyl-chains of the lipid membranes probably deviates from a simple melting transition, as suggested by the slow decrease of the elastically scattered intensity with temperature in the range 250 KT290 K (see Figs. 4,5). The melting (or freezing) of the lipid acyl-chains in DMPC and other lipids is indeed of first order, but is known to show a pseudocritical swelling, i.e. a continuous change of the lamellar -spacing above (see Refs. Nagle et al., 1998; Zhang et al., 1995; Chen et al., 1997; Mason et al., 2001) and also of the inter acyl-chain correlation peak Rheinstädter et al. (2004). The backscattering data probes the temperature induced changes of dynamical modes with ultra high energy but very modest resolution. Here we observe a region above of K, with a smaller slope in the anisotropic elastic scattering (Fig. 6) which coincides well with the region of pseudocritical swelling. There is an ongoing discussion about (pseudo)criticality in lipid bilayers and the different contributions of water layer and lipids to the anomalous expansion. Pabst et al. Pabst et al. (2003) report from x-ray diffraction on DMPC bilayers that the anomalous swelling is essentially the result of an expansion of the water layer and caused by increased fluctuations. They find a softening of the bilayer in the vicinity of , i.e. a (small) increase of the Caillé fluctuation parameter . The present backscattering study allows to assign the fluctuations to specific length scales. The critical swelling regime is thus accompanied by significant changes in the local and collective in-plane dynamics (diffusion, density fluctuations, undulations) of the lipid acyl-chains in the whole range of pseudocriticality.
A quantitative analysis of the step height in Fig. 6 shows that about 85% of the 2D dynamical modes in the plane of the membranes freeze at the main transition at . 15% freeze already in the region of critical swelling of the bilayers which may be accompanied by coexisting gel and fluid microdomains, as discussed in Ref. Rheinstädter et al., 2004 and also reported from NMR experiments König et al. (1994).
We attribute the second freezing transition at =271 K, which is observed in D5 and D6, to freezing of the membrane hydration water. Upon cooling, mobile bulk like water in the center of the water layer may leave the layer in between the membranes and condense as polycrystalline ice outside of the lamellar structure. Freezing of this water leads to disappearing of the respective dynamic modes and is responsible for the sharp freezing step in Fig. 5. The polycrystalline bulk ice then gives rise to an elastic contribution in detectors D5 and D6, as it is observed in Fig. 4. Unlike the lipid acyl-chains, the water shows a more gradual freezing. Freezing of the hydration water is lowered by about six degrees, as compared to pure heavy water () at 276.97 K Weast and Astle (1979). The reduced number of hydrogen bonds for the interstitial water, which was found in MD simulations Marrink et al. (1993), might be responsible for the supercooling. An interesting result of the present experiment is the fact that after subtraction of the FEW scans along the two principal axis of lamellar symmetry, there is a residual excess scattering contribution also in the so-called ’water peak’ detectors. In other words, a fraction of the water exhibits anisotropic scattering, and the freezing step of this component can be probed.
Below , all detectors in Fig. 4 show an increase in the elastically scattered intensity. It seems that the membranes become ’stiffer’ on all observed length scales upon cooling. This reduction of dynamical modes may also be linked to the decrease of the inter-bilayer distance when water freezes out.
V Conclusion and Outlook
We present the first neutron backscattering study to investigate molecular mobility of the different molecular components in a phospholipid membrane stack. By combining backscattering and diffraction data, we are able to separate pure structural from dynamical changes. The main transition from the gel to the fluid phase is connected with freezing of collective or diffusive motions of the acyl-chains. In the temperature range of the so-called pseudocritical (anomalous) swelling we find a continuous tail in the FEW scans at the high temperature side of the freezing step, presenting a deviation from the simplest scenario of a first order freezing transition. A second transition is observed at 271 K which we attribute to water molecules in the layer between the membrane stacks.
The experiment also provides a benchmark test for inelastic neutron studies of planar, i.e. quasi two-dimensional membrane model systems. Neutron beams for high resolution experiments are weak even at the most intense neutron sources, and this restriction of the low scattering intensity has been successfully circumvented by stacking the membranes as described above. The data are, however, still incomplete. In particular, the low count rate in the individual detector tubes does not allow for sufficient statistics (Fig. 7). Therefore, future experiments will be aimed at testing whether a quasi-elastic broadening indicating slow motion on nanosecond time scales occurs in the planar lipid membranes. In combination with the three-axis technique, where collective short wavelength fluctuations in the picosecond range are probed, the backscattering technique could thus give access to relaxations on the same length, but in the nanosecond time range. We also note that in the present study both the lipid acyl-chains and the water were deuterated. The experiment is therefore predominantly sensitive to detecting collective motions arising from coherent scattering. Further experiments will include a selective deuteration of the acyl-chains and the membrane water, respectively, to mask different types of mobility. In addition, structural information will be obtained by using diffraction detectors in parallel with the energy-discriminating backscattering detectors. The position of the reflectivity Bragg peaks and the lipid acyl-chain correlation peak will allow simultaneous detection of the lamellar spacing and thickness of the water layer , as well as the ordering of lipids in the plane of the membranes.
Acknowledgement: We are grateful to C. Ollinger and T. Gronemann (Institut für Röntgenphysik, Göttingen) for help with the sample preparation and to M. Elender (ILL) for technical and engineering support.
References
- Lipowsky and Sackmann (1995) R. Lipowsky and E. Sackmann, eds., Structure and Dynamics of Membranes, vol. 1 of Handbook of Biological Physics (Elsevier, North-Holland, Amsterdam, 1995).
- Israelachvili and Wennerstroem (1990) J. N. Israelachvili and H. Wennerstroem, Langmuir 6, 873 (1990).
- Perera et al. (1996) L. Perera, U. Essmann, and M. Berkowitz, Langmuir 12, 2625 (1996).
- Katsaras and Jeffrey (1997) J. Katsaras and K. R. Jeffrey, Europhys. Lett. 38, 43 (1997).
- Vogel et al. (2000) M. Vogel, C. Münster, W. Fenzl, and T. Salditt, Phys. Rev. Lett. 84, 390 (2000).
- Pabst et al. (2002) G. Pabst, J. Katsaras, and V. A. Raghunathan, Phys. Rev. Lett. 88, 128101 (2002).
- Tarek and Tobias (2002) M. Tarek and D. Tobias, Phys. Rev. Lett. 88, 138101 (2002).
- Salditt (2000) T. Salditt, Curr Opin Colloid In 5, 19 (2000).
- König et al. (1994) S. König, E. Sackmann, D. Richter, R. Zorn, C. Carlile, and T. Bayerls, J. Chem. Phys. 100, 3307 (1994).
- Pfeiffer et al. (1989) W. Pfeiffer, T. Henkel, E. Sackmann, and W. Knorr, Europhys. Lett. 8, 201 (1989).
- Lindahl and Edholm (2000) E. Lindahl and O. Edholm, Biophys. J. 79, 426 (2000).
- Bayerl (2000) T. Bayerl, Curr Opin Colloid In 5, 232 (2000).
- König et al. (1992) S. König, W. Pfeiffer, T. Bayerl, D. Richter, and E. Sackmann, J. Phys. II France 2, 1589 (1992).
- König et al. (1995) S. König, T. Bayerl, G. Coddens, D. Richter, and E. Sackmann, Biophys. J. 68, 1871 (1995).
- Pfeiffer et al. (1993) W. Pfeiffer, S. König, J. Legrand, T. Bayerl, D. Richter, and E. Sackmann, Europhys. Lett. 23, 457 (1993).
- Nevzorov and Brown (1997) A. Nevzorov and M. Brown, J. Chem. Phys. 107, 10288 (1997).
- Bloom and Bayerl (1995) M. Bloom and T. Bayerl, Can. J. Phys. 73, 687 (1995).
- Takeda et al. (1999) T. Takeda, Y. Kawabata, H. Seto, S. Komura, S. Gosh, M. Nagao, and D. Okuhara, J. Phys. Chem. Solids 60, 1375 (1999).
- Hirn et al. (1998) R. Hirn, T. Bayerl, J. Rädler, and E. Sackmann, Faraday Discuss. 111, 17 (1998).
- Chen et al. (2001) S. Chen, C. Liao, H. Huang, T. Weiss, M. Bellisent-Funel, and F. Sette, Phys. Rev. Lett. 86, 740 (2001).
- Rheinstädter et al. (2004) M. Rheinstädter, C. Ollinger, G. Fragneto, F. Demmel, and T. Salditt, Phys. Rev. Lett. 93, 108107 (2004).
- Safinya et al. (1986) C. R. Safinya, D. Roux, G. S. Smith, S. K. Sinha, P. Dimon, N. A. Clark, and A. M. Bellocq, Phys. Rev. Lett. 57, 2718 (1986).
- Nagle et al. (1996) J. Nagle, R. Zhang, S. Tristram-Nagle, W. Sun, H. Petrache, and R. Suter, Biophys. J. 70, 1419 (1996).
- Lyatskaya et al. (2001) Y. Lyatskaya, Y. Liu, S. Tristram-Nagle, J. Katsaras, and J. F. Nagle, Phys. Rev. E 63, 011907 (2001).
- Salditt et al. (2003) T. Salditt, C. Münster, U. Mennicke, C. Ollinger, and G. Fragneto, Langmuir 19, 7703 (2003).
- Gleeson et al. (1994) J. Gleeson, S. Erramilli, and S. Gruner, Biophys. J. 67, 706 (1994).
- Lechner et al. (1998) R. Lechner, J. Fitter, N. Dencher, and T. Hauß, J. Mol. Biol. 277, 593 (1998).
- Fitter et al. (1999) J. Fitter, R. Lechner, and N. Dencher, J. Phys. Chem. 103, 8036 (1999).
- Marrink et al. (1993) S.-J. Marrink, M. Berkowitz, and H. Berendsen, Langmuir 9, 3122 (1993).
- Münster et al. (1999) C. Münster, T. Salditt, M. Vogel, R. Siebrecht, and J. Peisl, Europhys. Lett. 46, 486 (1999).
- Alefeld et al. (1992) B. Alefeld, T. Springer, and A. Heidemann, Nucl. Sci. Eng. 110, 84 (1992).
- Maier-Leibniz (1966) H. Maier-Leibniz, Nukleonik 8, 61 (1966).
- Darwin (1914) C. Darwin, Philos. Mag. 27, 315 675 (1914).
- Demmel et al. (1998) F. Demmel, A. Fleischmann, and W. Gläser, Nucl. Instrum. Methods Phys. Res., Sect. A 416, 115 (1998).
- Spaar and Salditt (2003) A. Spaar and T. Salditt, Biophys. J. 85, 1576 (2003).
- Guard-Friar et al. (1985) D. Guard-Friar, C.-H. Chen, and A. Engle, J. Phys. Chem. 89, 1810 (1985).
- Nagle et al. (1998) J. Nagle, H. Petrache, N. Gouliaev, S. Tristram-Nagle, Y. Liu, R. Suter, and K. Gawrisch, Phys. Rev. E 58, 7769 (1998).
- Zhang et al. (1995) R. Zhang, W. Sun, S. Tristram-Nagle, R. L. Headrick, R. M. Suter, and J. F. Nagle, Phys. Rev. Lett. 74, 2832 (1995).
- Chen et al. (1997) F. Chen, W. Hung, and H. Huang, Phys. Rev. Lett. 79, 4026 (1997).
- Mason et al. (2001) P. Mason, J. Nagle, R. Epand, and J. Katsaras, Phys. Rev. E 63, 030902(R) (2001).
- Pabst et al. (2003) G. Pabst, J. Katsaras, V. A. Raghunathan, and M. Rappolt, Langmuir 19, 1716 (2003).
- Weast and Astle (1979) R. Weast and M. Astle, eds., CRC Handbook of Chemistry and Physics (CRC Press, Boca Raton, FL, 1979), 60th ed.