Anomalous optical absorption in a random system with scale-free disorder
Abstract
We report on an anomalous behavior of the absorption spectrum in a one-dimensional lattice with long-range-correlated diagonal disorder with a power-like spectrum in the form . These type of correlations give rise to a phase of extended states at the band center, provided is larger than a critical value . We show that for the absorption spectrum is single-peaked, while an additional peak arises when , signalling the occurrence of the Anderson transition. The peak is located slightly below the low-energy mobility edge, providing a unique spectroscopic tool to monitor the latter. We present qualitative arguments explaining this anomaly.
pacs:
78.30.Ly; 71.30.+h; 71.35.Aa; 36.20.KdQuantum dynamics of quasiparticles in random media has been a subject of extensive studies since the seminal paper by Anderson, who argued that quasiparticle states become localized for sufficiently large disorder, thus giving rise to a localization-delocalization transition (LDT) in three dimensions (3D) Anderson58 . The hypothesis of single-parameter scaling, introduced in Ref. Abrahams79, , lead to the general belief that all eigenstates of noninteracting quasiparticles were localized in one- (1D) and two dimensions, and that the LDT does not exist in low dimensional systems (for recent overviews see Refs. Beenakker97, and Janssen98, ). However, at the end of the eighties and beginning of the nineties several theoretical works provided clear evidences that short-range correlations in disorder may cause delocalization even in 1D systems Flores89 ; Phillips91 ; Flores93 ; Adame93 . This fact was put forward to explain the high conductivity of doped polyaniline Phillips91 as well as the transport properties of GaAs-AlxGa1-xAs superlattices with intentional correlated disorder Bellani99 .
At the end of the last decade, it was demonstrated that long-range correlations in disorder, with no characteristic spatial length (scale-free disorder), also acts towards delocalization of 1D quasiparticle states Moura98 . Random sequences of correlated site energies characterized by a power-like spectrum with , result in extended states provided is larger than some critical value Moura98 . The extended states form a phase at the band center, which is separated from localized states by two mobility edges. This theoretical prediction was experimentally validated by measuring microwave transmission spectra of a single-mode waveguide with inserted correlated scatterers Kuhl00 . The observed transmission spectra were nicely simulated by the theoretical model Izrailev99 , confirming the existence of a phase of delocalized states, in spite of the underlying randomness. Peculiarities of this type of disorder had also their trace in biophysics, explaining the long-distance charge transport in DNA sequences Carpena02 ; Yamada04 as well as the existence of a new class of level statistics Carpena04 .
Recently, we have shown that 1D disordered systems with the above mentioned correlated disorder in the site energies support Bloch-like oscillations Adame03 . The amplitude of the oscillations turned out to carry information about the energy difference between the two mobility edges. This finding opens the possibility to perform experiments on coherent dc charge transport for measuring the bandwidth of the delocalized phase in disordered systems with long-range correlated randomness. In this work we report on an anomaly of the linear absorption within the underlined model. We show a crossover of the absorption spectrum from a single-peaked to double-peaked shape when the exponent crosses the critical value . This behavior is not shared by the standard Anderson model and has never been mentioned before. Remarkably, the additional peak of the absorption is located close to the low-energy mobility edge, thus providing a simple spectroscopic tool to monitor it. We propose a simple explanation of the behavior found.
We consider a regular open chain of optically active two-level units with parallel transition dipoles, which are coupled by the resonant dipole-dipole interaction. The corresponding Hamiltonian reads
| (1) |
where denotes the state in which the -th unit, having the energy , is excited, whereas all the other units are in the ground state. The intersite dipole-dipole coupling is restricted to nearest-neighbors and set to over the entire lattice. is a stochastic long-range correlated sequence. We generate a realization of the sequence according to the following rule Moura98
| (2) |
Here, , and are independent random phases uniformly distributed within the interval . The random distribution (2) has zero mean and a correlation function
| (3) |
where indicates an average over the distribution of random phases and is assumed to be even. From (3) it follows that is the standard deviation of the distribution (2). This quantity will be referred to as magnitude of disorder. The long-range nature of the site potential correlations results from the power-law dependence of the amplitudes of the Fourier components in Eq. (2). As was shown in Ref. Moura98, , a phase of extended states occurs at the band center provided when .
The quantity of our primary interest is the absorption spectrum, which is defined as
| (4) |
where are the eigenenergies of the normalized eigenfunctions of the Hamiltonian (1). The quantity is the dimensionless oscillator strength of the -th state.
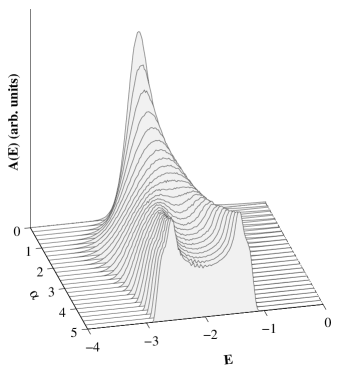
We have numerically diagonalized the Hamiltonian (1) and obtained the absorption spectrum for different values of the power exponent , considering open linear chains of size and setting the magnitude of disorder . The results comprise an average over realizations of the disorder for each value of . Figure 1 shows the output of the simulations. When the absorption spectrum displays a single and asymmetric peak slightly below the lower band edge of the periodic lattice (), i.e., only the lowest states of the band contribute to the absorption spectrum. This trend is exactly the same as that observed in 1D systems with uncorrelated randomness. The only noticeable effect upon increasing within the range is an increase of the absorption bandwidth. In other words, long-range correlations in disorder cause a stronger localization as compared to the uncorrelated case. A similar effect was found in 1D disorder-correlated systems with a characteristic spatial length and explained on the basis of the exchange narrowing concept Malyshev99 (see also Ref. Russ98, ).
The absorption shape changes dramatically when , as seen in Fig. 1: A single peak splits into a doublet. One of the doublet components (at low energy) is located at the bottom of the band as usual, whereas the other one (at higher energy) lies deep inside the band. This means that the oscillator strength does not decrease monotonously from the bottom to the center of the band, indicating strong and unexpected effects of the long-range correlated disorder on the spatial distribution of the probability amplitude. In contrast to the case , the broadening of the peaks drops down on increasing and then saturates. Finally, notice that the low-energy tail of the low-energy peak loses its characteristic Gaussian shape observed in uncorrelated disordered systems. All these features point out a rich phenomenology of the model under study that cannot be accounted for within the standard theoretical frameworks.
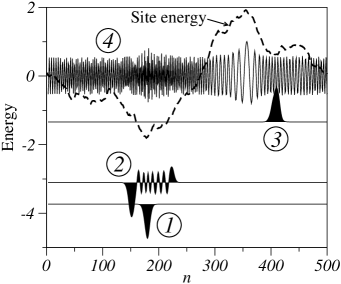
To get insight into the effects of scale-free disorder on the optical properties of the system, it is useful to have a look at the eigenfunctions of the Hamiltonian (1). In Fig. 2 we depict a subset of wave functions obtained for a typical random realization of the potential landscape. The baselines display the corresponding eigenenergies. The lowest state in Fig. 2 (labelled by ) is localized in the sense that it has a considerable amplitude within a domain of size , which is smaller than the system size . It shows a bell-like shape and carries a large oscillator strength . There are several states of such type (not shown in Fig. 2), which are close in energy to the state and do not overlap with each other. They contribute to the low-energy peak of the absorption spectrum. On increasing the energy, one observes eigenstates, like the one labelled by in Figure 2, which are more extended, as compared to the lowest one, and present several nodes within the localization segment. The oscillator strength of such states is smaller than . Consequently, they contribute to the absorption spectrum to a lesser extent. Remarkably, going further up in energy we again find bell-like states, as the one labelled by in Figure 2, which are characterized by a large oscillator strength. Those states form the high-energy peak of the doublet in the absorption spectrum. Finally, on approaching the center of the band one expects the occurrence of extended states. The state in Figure 2 represents an example.
Aiming to elucidate the anomalies found, we present a simplified model that explains the occurrence of the optically active states deep inside the band as well as sheds light on the nature of the LDT in the model under study. To this end, we recall that the site energy potential (2) is given by a sum of spatial harmonics. The amplitude of each term, , decreases upon increasing the harmonic number . For sufficiently high values of , the first term in the series (2) will be dominant, while the others are considerably smaller. Consequently, the site potential for a given realization represents a deterministic function of period (harmonic with ), perturbed by a colored noise (harmonics with ). Figure 3(a) shows the site energy landscape (2) for different values of , illustrating the statement above. Therefore, relevant information can be obtained by analyzing the first () term in the series (2).
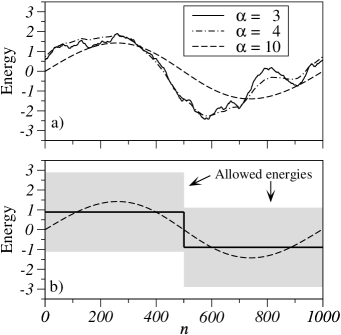
As a further step of simplification, we replace the sine-like site energy potential by a step-like one, as shown in Fig. 3(b). More specifically, we take , where is the average value of the site energies on the left half of the system. In doing so, we map the original lattice onto two uniform sublattices, coupled to each other through the hoping between sites and . The allowed energies of each decoupled sublattice form a band (referred hereafter, for the sake of clarity, to as subband), ranging from to and from to for the left and right sublattices, respectively [see Fig. 3(b)]. The absorption spectrum of such a system is expected to have two peaks caused by the transitions from the ground state to the bottom state of each subband. For their locations are and . We stress that these values are in a fairly good agreement with the results of exact calculations presented in Fig. 1, despite both the simplification involved and neglecting the coupling. This is a strong indication that the lowest states of the subbands are not very much modified after switching on the interaction between sublattices.
In order to understand the above features, let us consider the elements of the coupling matrix between segments, given by Malyshev99
| (5) |
Here, and , ranging from 1 to , number the eigenstates of the left and right sublattices, respectively. From (5) we find that the magnitude of coupling of the lowest state of the left sublattice () to the closest state of the left one () is , that is much smaller than , the energy difference between the lowest band edges (the limit of is implied). The magnitude of the coupling of the lowest state of the left sublattice () to the central band states of the right one is about , whereas the energy spacing at the center of the band is . Again, the coupling is smaller than the energy spacing. This explains the low sensitivity of the lowest states of the subbands to switching on the interaction between the sublattices.
Note the existence of an overlap of the two subbands shown in Fig. 3(b). The overlap region provides a pass-band filter for a quasiparticle. This is a crucial ingredient in understanding the origin of the appearance of both a phase of extended states at the center of the band and the LDT in the presence of disorder. Following the same reasoning as before, we can conclude that upon increasing , the role of the random phases in the series (2) gets smaller and smaller as compared to the leading term . Consequently, one ends up with our simplified model to explain the phase of extended states for higher values of .
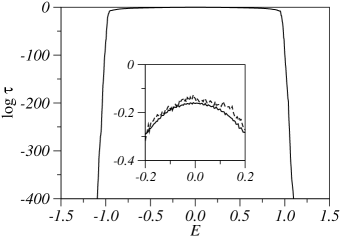
The cutoff energies of the pass-band can be associated with the mobility edges. The actual locations of the latter can be estimated by studying the transmission. In Fig. 4 we plotted the transmission coefficient as a function of the incoming energy, which was calculated for and (about the procedure for calculating see, e.g. Ref. Macia00, ). The presence of a pass-band is clearly seen. Furthermore, we observe that the low-energy transmission cutoff, , is very close to the location of the high-energy peak in the absorption spectrum, . This provides the link between the second peak in the doublet of the absorption spectrum and the low-energy mobility edge.
In summary, we have studied numerically the linear optical response of a quasiparticle moving in the long-range correlated energy landscape with a power-like spectrum . We found a crossover of the absorption lineshape from a single-peaked form to a doublet when varying the power exponent from zero to , where is the critical value for a LDT to occur in the present model; this signals the occurrence of the localization-delocalization transition. The low-energy peak is located at the bottom of the band, whereas the high-energy peak lies deep inside of the band, indicating the presence of band states with a large oscillator strength. The location of the high-energy peak is slightly below the low-energy mobility edge of the phase of extended states. This provides a unique possibility to monitor the mobility edge spectroscopically. The crossover found is a characteristic feature of the underlying long-range correlated random sequence and, thus, can also be used to distinguish it from other types of correlations.
Acknowledgements.
The authors thank A. V. Malyshev, M. L. Lyra and F. A. B. F. de Moura for helpful comments. This work was supported by DGI-MCyT (Project MAT2003-01533) and CAM (Project GR/MAT/0039/2004). V. A. M. acknowledges support from ISTS (grant #2679).References
- (1) P. W. Anderson, Phys. Rev. 109, 1492 (1958).
- (2) E. Abrahams, P. W. Anderson, D. C. Licciardello, and T. V. Ramakrishnan, Phys. Rev. Lett. 42, 673 (1979).
- (3) C. W. J. Beenakker, Rev. Mod. Phys. 69, 731 (1997).
- (4) M. Janssen, Phys. Rep. 295, 1 (1998).
- (5) J. C. Flores, J. Phys.: Condens. Matter 1, 8471 (1989).
- (6) P. Phillips and H.-L. Wu, Science 252, 1805 (1991).
- (7) J. C. Flores and M. Hilke, J. Phys. A 26, L1255 (1993).
- (8) F. Domínguez-Adame, E. Maciá, and A. Sánchez, Phys. Rev. B 48, 6054 (1993).
- (9) V. Bellani, E. Diez, R. Hey, L. Toni, L. Tarricone, G. B. Parravicini, F. Domínguez-Adame, and R. Gómez-Alcalá, Phys. Rev. Lett. 82, 2159 (1999).
- (10) F. A. B. F. de Moura and M. L. Lyra, Phys. Rev. Lett. 81, 3735 (1998).
- (11) U. Kuhl, F. M. Izrailev, A. A. Krokhin, and H. -J. Stöckmann, Appl. Phys. Lett. 77, 633 (2000).
- (12) F. M. Izrailev and A. A. Krokhin, Phys. Rev. Lett. 82, 4062 (1999).
- (13) P. Carpena, P. B. Galván, P. Ch. Ivanov, and H. E. Stanley, Nature 418, 955 (2002); 421, 764 (2003).
- (14) H. Yamada, Phys. Lett. A 332, 65 (2004); Int. J. Mod. Phys. B 18, 1697 (2004).
- (15) P. Carpena, P. Bernaola-Galván, and P. Ch. Ivanov, Phys. Rev. Lett. 93, 176804 (2004).
- (16) F. Domínguez-Adame, V. A. Malyshev, F. A. B. F. de Moura, and M. L. Lyra, Phys. Rev. Lett. 91, 197402 (2003).
- (17) V. A. Malyshev, A. Rodríguez, and F. Domínguez-Adame, Phys. Rev. B 60, 14 140 (1999).
- (18) S. Russ, S. Havlin, and I. Webman, Phil. Mag. B 77, 1449 (1998).
- (19) E. Maciá and F. Domínguez-Adame, Electrons, phonons and excitons in low-dimensional aperiodic systems (Editorial Complutense, Madrid, 2000).