Structural relaxations around Ti, Cr and Fe impurities in -Al2O3 probed by x-ray absorption near edge structure combined with first-principles calculations
Abstract
We determine the structural relaxations around paramagnetic impurities (Ti, Cr, Fe) in corundum (-Al2O3), by combining x-ray absorption near edge structure (XANES) experiments and ab initio calculations. The structural relaxations are found to be very local. We then show that XANES is sensitive to small variations in interatomic distances within the coordination shell of the absorbing atom. The experiments were carried out on single crystals of ruby and sapphires. Linear dichroic signals are essential to characterize the geometry of the impurity site. The calculations were performed within a self-consistent “non muffin-tin” framework, that uses pseudopotentials, plane-wave basis set, and the continued fraction for the absorption cross section.
pacs:
61.72.-y,78.70.Dm,71.15.Mb,61.66.-f,85.40.RyI Introduction
The presence of impurities in a crystal can influence its mechanical, magnetic, semiconducting, superconducting, dielectric, spectroscopic and transport properties. To cite just a few specific examples, impurities can improve the voltage holdoff capability of insulating materialsMiller (1981), they are critical for the optical properties of most laser materials and gemstones, and they turned out to be the secret of ancient Damascus steel blades.Verhoeven et al. (1998)
Still, the physics of impurity systems is not well developed. The local crystallographic structure around impurities is unknown in most cases, although it is an essential piece of information to undestand their influence on the physical properties of the host and to carry out ab initio simulations of these materials. This situation is due to the experimental and theoretical difficulties that are met to obtain microscopic information on impurity systems. From the theoretical point of view, quantum calculations of impurity systems require the use of large supercells that have long not been computationally manageable. From the experimental point of view, impurity systems can only be measured with methods which can selectively probe certain atomic species. Among such methods, many of them, such as electronic paramagnetic resonance, give only indirect information on the position and nature of the atoms surrounding the impurity. Due to the advent of third-generation synchrotron radiation facilities, x-ray absorption spectroscopy (XAS) is now able to investigate impurities in solids.
The extended x-ray absorption fine structure (EXAFS) region of a XAS spectrum provides quantitative information about the short range organization around the absorbing atom (coordination number, interatomic distances). The x-ray absorption near-edge structure (XANES) region usually gives qualitative information about the atomic arrangement up to the medium range order. XANES is sensitive to the electronic structure (bonding) and probes the empty states of solids. In the case of dilute elements in single crystals, especially at the edge of 3 transition elements, collecting EXAFS spectra with a good signal-to-noise ratio is a difficult task, because the intensity of diffraction peaks becomes much larger than the EXAFS signal. Taking the example of impurities in corundum -Al2O3,Gaudry et al. (2003) good EXAFS spectra could be collected for 10000 wt.ppm Cr3+ impurities, but the usable energy range obtained for 1500 wt.ppm Fe3+ impurities was already quite limited, and the concentration of coloring impurities is often an order of magnitude lower than this. In such cases, XANES becomes a practicle and precious technique to get information about the local structure of the absorbing atom.Waychunas et al. (2003) However, the analyzis of the experimental XANES data is not straightforward because of the photoelectron multiple-scattering processes that occur in the near-edge region. Ab initio XANES simulations are then required to relate the experimental spectral features to the local geometry around the aborbing atom.
Recently, an efficient first-principle approach based on plane-wave pseudopotential formalism has been developed to calculate -edge XANES spectra.Taillefumier et al. (2002) Here we apply this method to the -edge of substitutional paramagnetic impurities in aluminum oxide. More precisely, we investigate the structural modifications of the corundum crystal structure induced by the presence of substitutional Ti3+, Cr3+ or Fe3+. This system is chosen because corundum containing transition metal impurities is important for laser applications and as gemstones. Colorless corundum (-Al2O3) becomes red ruby, pink sapphire, or yellow sapphire when a small amount of Cr3+, Ti3+, or Fe3+ ions substitute for Al3+ ions, respectively.Burns (1993); Nassau (1983) The color of blue sapphire is due to the presence of (Fe-Ti) pairs in -Al2O3.
For this investigation, polarized XANES spectra are measured and calculated. Corundum belongs to the trigonal Bravais lattice, the optical axis being parallel to the [111] direction of the trigonal unit cell (i.e. to the -axis of the hexagonal cell). Corundum is then a dichroic compound in the electric dipole approximation. The dichroic signal is a direct signature of the departure of the impurity site from octahedral symmetry.Gaudry et al. (2003) XANES calculations are performed from structural models resulting from ab initio energy minimization calculations. The agreement of our experimental and theoretical spectra demonstrates that precise structural information can be extracted from the anglular-dependent XANES spectra, provided the electronic potential is accurately modelled.
II Experiments
II.1 Crystallographic structure of -Al2O3 and samples description
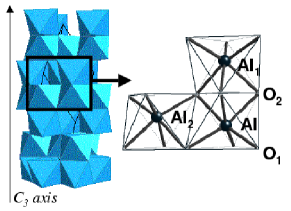
Corundum (-Al2O3) belongs to the () space group.Newnham and de Haan (1962) The trigonal unit cell contains two Al2O3 formula units. The atomic environment of aluminum is illustrated in Fig. 1. The atomic site of aluminum is a distorded octahedron with a 3 () local point symmetry. The AlO6 octahedron is characterized by two different Al-O interatomic distances. If we consider that the absorbing atom is denoted by Al in Fig. 1, the nearest three oxygen atoms are labeled O1 in Fig. 1. The farther three oxygen atoms, labeled O2, form a face shared by two octahedra along the three-fold symmetry axis. Beyond the coordination shell of aluminum, the next two neighbors are aluminum atoms, labeled Al1 and Al2 in Fig. 1, and are relative to face-shared octahedra and edge-shared octahedra, respectively.
Three synthetic single crystals of doped -Al2O3 (obtained by the Verneuil process) are used for this study: a red ruby (-Al2O3:Cr3+), a blue sapphire (-Al2O3:Fe-Ti) and a pink sapphire (-Al2O3:Ti3+). The impurity concentration in each sample is given in table 1. They are measured with the Cameca Microbeam electron microprobe at the CAMPARIS analytical facility of Paris. A 30 kV acceleration with a 15 nA beam current, defocused to 10m, is used. X-ray intensities are corrected for dead-time, background, and matrix effects using the Cameca ZAF routine. The standards used are -Al2O3, -Cr2O3, -Fe2O3 and TiO2. The blue sapphire sample is chosen to represent the model compound of iron impurity in corundum (-Al2O3:Fe3+). It is indeed preferred to a yellow sapphire sample, that only contains iron impurities, because synthetic yellow sapphires are known to be inhomogeneous.Eigenmann (1970) Consequently, in this study, we assume that the low concentration of titanium (750 wt.ppm) compared to that of iron (1500 wt.ppm) does not affect the site relaxation around iron.
| Samples | Cr (wt.ppm) | Fe (wt.ppm) | Ti (wt.ppm) |
|---|---|---|---|
| Red ruby | 10000 ( 1000) | - | - |
| Blue sapphire | - | 1500 ( 50) | 750 ( 30) |
| Pink sapphire | - | - | 540 ( 30) |
The samples are cylindrically shaped: 15 mm diameter and 3 mm thickness for the ruby sample, and 5 mm diameter and 1 mm thickness for the sapphire samples. They are cut so that the optical axis is in the plane of the disk surface, and the [10] direction of the trigonal cell is orthogonal to the disk surface.
II.2 X-ray absorption measurements
X-ray absorption measurements are carried out at the European Synchrotron Radiation Facility (ESRF) on the ID12 beam line, which is dedicated to polarization dependent spectroscopies.Goulon et al. (1998); Rogalev et al. (2001) The monochromatic x-ray beam is obtained through a double Si(111) crystal monochromator, with a resolution . The oriented samples are placed on a rotating holder with the normal of the disk surface parallel to the x-ray wave vector and to the rotation axis. The fluorescence intensity is measured by eight detectors symmetrically set around the x-ray beam.
XANES spectra are recorded for several angles between the optical axis of the sample and the x-ray polarization vector. We note and the absorption cross section obtained with and , respectively. In the electric dipole approximation, the isotropic signal is given by , and the dichroic signal is given by the difference . The measurement of x-ray absorption spectra of impurities in crystals is impeded by the presence of large diffraction peaks. In order to decrease the intensity of diffraction peaks and elastic scattering, V and Mn filters (50 m width) are used for the Cr edge in ruby and the Fe edge in blue sapphire, respectively. By so doing, the spectra recorded for the two angles and are not affected by diffraction peaks. On the contrary, no filter is available for the Ti edge and the absorption was measured for 100 angles from to . The and spectra are reconstructed from this amount of data by using a Fourier decomposition to remove the contribution of diffraction peaks to the spectra.
II.3 Calculation methods
The starting point of any XANES ab initio calculation is a structural model. Two structural models are considered for each compound. The first one, called non-relaxed model, corresponds to the substitution of one aluminum atom by one impurity Ti, Cr or Fe in the -Al2O3, without relaxing its structure. The second one, called relaxed model, is the result of ab initio energy minimization calculation carried out on the non-relaxed model. This calculation is performed using Car-Parrinello molecular dynamics with simulated annealingCar and Parrinello (1985) as implemented in the CPMD code.cpm The XANES calculations are then carried out within the scheme of the PARATEC code,par using the formalism described in Ref.Taillefumier et al. (2002) Both codes are based on the density functional theory (DFT) within the spin polarized local density approximation (LSDA), and use plane-wave basis set and norm-conserving Troullier-Martins pseudopotentialsTroullier and Martins (1991) in the Kleinman-Bylander form.Kleinman and Bylander (1982) In the following, we give all the parameters used in both kinds of calculation.
II.3.1 Structural model construction
The structural models are constructed from the lattice parameters and atomic positions resulting from a previous ab initio calculation, performed by Duan et al.Duan et al. (1998a, b) in -Al2O3. In Ref.Duan et al. (1998a), the trigonal unit cell parameters are Å and , the aluminum atoms are in 4 symmetry sitescry with and the oxygen atoms are in 6 symmetry sitescry with . We verify by using CPMD that this corundum optimized structure obtained by Duan et al. corresponds to atomic forces less than Ry/Å. Since we use periodic boundary conditions, we consider supercells. The supercells contain 80 atoms: 48 oxygen atoms, 31 aluminum atoms and 1 transition metal atom (Ti, Cr or Fe) in substitution for aluminum. With such large supercells, the interaction between two impurities (belonging to two neighboring cells) is negligible. These supercells define the non-relaxed models mentioned above. The relaxed models are obtained by minimization of the energy of the non-relaxed supercells. All atoms are allowed to relax, while the lattice constants are fixed. The impurities considered in this study are known to be in a high-spin state,Lever (1984) therefore the spin multiplet imposed on the trivalent impurities are S= for Ti3+ ([Ar]), S= for Cr3+ ([Ar]), and S= for Fe3+ ([Ar]). The parametrization of the norm-conserving Troulliers-Martins pseudopotentials is given in Table 2. The wave functions and the charge density were expanded in plane waves with cutoff of 80 Ry and 320 Ry, respectively. Since the supercell is rather large, and since the systems are insulating materials, the Brillouin zone is only sampled at the point.
| atom | Al | O | Ti | Cr | Fe |
|---|---|---|---|---|---|
| valence | (1.06) | (0.77) | (0.58) | (0.53) | (0.48) |
| states | (1.06) | (0.77) | (0.90) | (0.79) | (0.90) |
| (1.06) | (0.90) | (0.79) | (0.90) | ||
| local part |
II.3.2 XANES calculations
The method used for XANES calculations has been already described in Ref.Taillefumier et al. (2002); Cabaret et al. (2004) Therefore its main aspects are recalled here. The method uses periodic boundary conditions, plane-wave basis-set, pseudopotentials and reconstructs all-electron wave functions within the projector augmented wave (PAW) framework.Blöchl (1994) In order to allow the treatment of large supercells (hundreds of atoms), the scheme uses a recursion method to construct a Lanczos basis and then compute the cross section as a continued fraction,Haydock et al. (1972, 1975) in the electric dipole and quadrupole approximations.E1- Electric quadrupole transitions are relevant for the pre-edge region, in particular at the -edge of transition metals. The absorption cross section is calculated beyond the “muffin-tin” approximation, that is known to limit the applications of the multiple scattering theory traditionally used for XANES simulations.Ankudinov et al. (1998); Natoli et al. (1980); Benfatto et al. (2003)
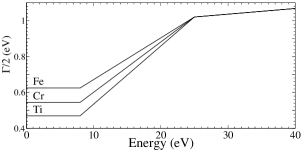
XANES spectra are computed at the transition metal edge for both relaxed and non-relaxed models of the three compounds, using the 80-atom supercells described in the previous subsection. For the pseudopotentials construction, we again use the parametrization given in Table 2. In order to take into account the core-hole effects in the calculations, the Ti, Cr and Fe pseudopotentials are generated with only one electron. The spin multiplet degeneracy is set by imposing the number of up and down states given by the CPMD code. Convergence of the XANES theoretical spectra is reached for the following set of parameters: a 64 Ry energy cutoff and one -point for the self-consistent spin-polarized charge density calculation, and 32 -pointsMonkhorst and Pack (1976) for the absorption cross section calculation. An energy dependent broadening parameter is used in the continued fraction (see Ref. Taillefumier et al. (2002); Cabaret et al. (2004)) in order to account for the two main photoelectron damping modes.Kokubun et al. (2004) This width corresponds through the time-energy uncertainty relations to a lifetime of the photoelectron. At low energy, the lifetime of the photoelectron is only limited by the core-hole lifetime within the plasmon pole approximation. The parameter was then set to a constant, which corresponds to level full width at half maximum given by Krause and Oliver.Krause and Oliver (1979) At higher energy, the kinetic energy of the photoelectron is great enough so that it can interact with the electron gas of the system. Its amplitude is damped, provoking a sharp decrease in the lifetime. Therefore the parameter was set to rapidly increase, and then to have a smooth linear behaviour. The energy-dependent parameters used in this study are displayed in Fig. 2.
III Results and discussion
This section is organized as follows. First, we present the results of the structural relaxation around the substitutional Ti3+, Cr3+ and Fe3+ ions in -Al2O3 (Sec.III.1). Second, we discuss the influence of the core-hole effects in the case of the Cr -edge in ruby (Sec.III.2). Third, we confront with experiments the calculated spectra obtained with both relaxed and non-relaxed models (Sec.III.3).
III.1 Structural model analysis
The relaxed models of -Al2O3:Cr3+ and -Al2O3:Fe3+ are already described and discussed in a previous work.Gaudry et al. (2003) However, in order to compare with the relaxed model of -Al2O3:Ti3+, most of the results of Ref.Gaudry et al. (2003) are recalled here.
The analysis of the relaxation can only be done by careful comparison of the relaxed and non-relaxed supercells. This is achieved by comparing clusters that are built from the supercells using the method detailed in Ref.Gaudry et al. (2003) These clusters are centered on the impurity and contain 66 atoms (5.2 Å radius). In order to avoid the influence of the impurity displacement in the relaxed model, we define the mass center of each cluster by calculating , where is the impurity position, refers to all the atoms within a given cluster except the impurity and is the mass of the atom . For each atom around the impurity, we evaluate the norm of the displacement vector, ,
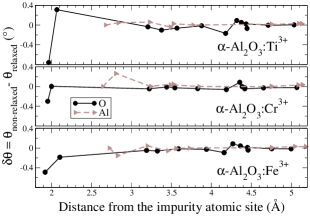
where () and () are the cartesian coordinates of vector in the non-relaxed and relaxed clusters, respectively. The angular relaxation was also determined. It was defined by the quantity , where and are the angles between the directions and the axis in the relaxed and non-relaxed clusters, respectively. The comparison of the relaxed and non-relaxed clusters leads to the following conclusions.
| Compound | Interatomic distances (in Å) | |||
|---|---|---|---|---|
| cation-oxygen | cation-cation | |||
| -Al2O3 (exp.Newnham and de Haan (1962)) | d =1.86 | d =1.97 | d=2.65 | d=2.79 |
| -Al2O3 (calc.Duan et al. (1998b)) | d =1.84 | d =1.95 | d=2.62 | d=2.77 |
| -Al2O3:Ti3+ (this calc.) | d =1.97 | d =2.07 | d=2.72 | d=2.83 |
| -Al2O3:Cr3+ (calc.Gaudry et al. (2003)) | d =1.95 | d =2.00 | d=2.64 | d=2.80 |
| -Al2O3:Fe3+ (calc.Gaudry et al. (2003)) | d =1.92 | d =2.10 | d=2.72 | d=2.83 |
| -Ti2O3 (exp.Newnham and de Haan (1962)) | d =2.01 | d =2.08 | d=2.59 | d=2.99 |
| -Cr2O3 (exp.Finger and Hazen (1980)) | d =1.96 | d =2.01 | d=2.65 | d=2.88 |
| -Fe2O3 (exp.Finger and Hazen (1980)) | d =1.94 | d =2.11 | d=2.90 | d=2.97 |
First, the impurity site symmetry is conserved: the Ti, Cr and Fe atoms are still in a point symmetry site, characterized by two kinds of M-O1 and M-O2 distances (M = Ti, Cr or Fe). The angular relaxation is found to be very small (i.e. less than 0.8 degrees). This is illustrated in Fig. 3, which gives as a function of the distance between the impurity and its neigboring atoms in the relaxed clusters.
Second, a displacement of the impurity from the initial aluminum site is observed in the three relaxed models. This displacement occurs along the axis, but its absolute value depends on the impurity. Chromium is displaced by 0.03 Å towards Al1 atom, titanium is displaced by again 0.03 Å but in the opposite direction, and iron is further moved (0.09 Å towards Al1 atom). The small displacement of chromium is in agreement with various experimental studies of the literature.Laurance et al. (1962); Lohr and Lipscomb (1963); Moss and Newnham (1964); McCauley and Gibbs (1972); Kizler et al. (1996) The result for iron is consistent with an analysis of electronic paramagnetic resonance (EPR) experiments, that gives a displacement of Å.Zheng (1998)
Third, an increase of distances within the coordination shell of the impurity is observed. This result is expected since the ionic radii of Ti, Cr and Fe in octahedral siteShannon (1976) ( Å, Å and Å) are all greater than the ionic radius of aluminum ( Å). The calculated M-O1 and M-O2 bond lengths in doped -Al2O3 were found to be close to M-O1 and M-O2 bond lengths in the corresponding metal oxides, -M2O3 (-Ti2O3, -Cr2O3 and -Fe2O3). On the contrary, the distances M-Al1 and M-Al2 were less affected by the relaxation process: they are closer to Al-Al1 and Al-Al2 bond lengths in corundum than the M-M1 and M-M2 distances in the corresponding oxides -M2O3. Tab.3 gathers the M-O1, M-O2, M-Al1 and M-Al2 distances in -Al2O3:M3+ deduced from the calculation, and compares them with the corresponding distances in -Al2O3, -Ti2O3, -Cr2O3 and -Fe2O3, resulting from x-ray diffraction experiments. One can remark in Tab. 3 that the Ti-O1 and Ti-O2 bond lengths in -Al2O3:Ti3+ (1.97 Å and 2.07 Å) are quite similar to those in -Ti2O3 (2.01 Å and 2.07 Å). Besides, the Ti-Al1 and Ti-Al2 distances in -Al2O3:Ti3+ (2.72 Å and 2.83 Å) are closer to the Al-Al1 and Al-Al2 distances in corundum (2.65 Å and 2.79 Å) than to the Ti-Ti1 and Ti-Ti2 distances in -Ti2O3 (2.59 Å and 2.99 Å). One can notice that the experimental distances Cr-Cr1 in -Cr2O3 and Al-Al1 in -Al2O3 are both equal to 2.64 Å. Thus one expects that Cr-Al1 distance in ruby (-Al2O3:Cr3+) should be around 2.64 Å. The calculated distances of -Al2O3:Cr3+are slightly larger (+0.015 Å) than those determined from EXAFS measurements on powder samples,Kizler et al. (1996) and in good agreement (+0.005 Å) with EXAFS measurements performed and on the same single crystal as the one used in the present study.Gaudry et al. (2003) They are also consistent with data extracted from optical spectroscopy.Langer (2001) For -Al2O3:Fe3+, the calculated distances are in agreement with EXAFS experimentsGaudry et al. (2003) and with EPR results.Zheng (1998)
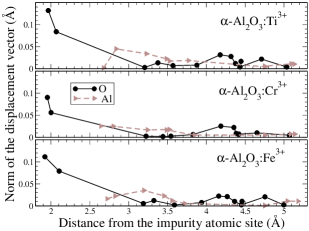
Finally, the M-O and M-Al distances deduced from the ab initio relaxation calculations suggest that the structural relaxation around the transition metal impurities is quite local and mainly concern the coordination shell. This point is confirmed by the calculations of the atomic displacements between the relaxed and non-relaxed. Fig. 4 represents the norm as a function of the distance between the impurity and its neighbors in the relaxed model. It clearly shows that the oxygen coordination shell absorbs almost the relaxation. The displacement of atoms farther than 2.5Å from the impurity is less than 0.035 Å. Comparing the three compounds, one also observes that the relaxation is slightly larger around titanium and iron than around chromium.
III.2 Core-hole effects
The influence of the core-hole can be described by calculating a self-consistent potential around a core-hole or by solving a Bethe-Salpeter equation.Shirley (1998); Soininen and Shirley (2001) For impurity systems, solving a Bethe-Salpeter equation is probably beyond the reach of available computer programs. Moreover, it was already observed that both methods give quite similar results.Taillefumier et al. (2002) Therefore, we shall describe the influence of the core-hole by calculating a self-consistent potential in the presence of a 1s core-hole.
Calculated spectra performed with or without the presence of a core-hole on the chromium absorbing atom are compared in Fig. 5. It clearly appears that the core-hole is needed to obtain a good agreement with the experimental curve. In particular, the intensity and the energy positions of the features within the 6005-6017 eV energy range are not well reproduced if the core-hole is not taken into account in the calculation. We have noticed similar behaviors due to the presence of the core-hole at the titanium and iron -edges in -Al2O3:Ti3+ and -Al2O3:Fe3+, respectively.
On the other hand, the presence of the core-hole has a non-negligible impact in the pre-edge region. This is illustrated in the inset of Fig. 5, which represents the pre-edge region (5985-5998 eV) of the Cr edge in -Al2O3:Cr3+. An interpretation of this region in terms of group theory has been detailed in Ref. Gaudry et al. (2004) In the pre-edge region both electric dipole () and quadrupole () transitions occur. Since the site of the impurity in doped -Al2O3 is not centrosymmetric, the states are present in the pre-edge through hybridization.
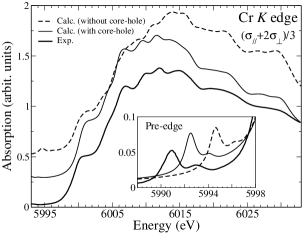
electric dipole () and quadrupole () transitions occur. Since the site of the impurity in doped -Al2O3 is not centrosymmetric, the states are present in the pre-edge through hybridization. The calculated curves shown in the inset of Fig. 5 are the sum of both contributions. For the calculation of electric quadrupole transitions, the direction of the wave vector of the photon beam, , has to be specified. In the experiments, the single crystals were placed on the rotating holder so that the wave vector was parallel to the [10] crystallographic direction. Consequently, the spectra shown in Fig. 5 are calculated with .qua The two features of the experimental pre-edge are reproduced with or without the 1 core-hole (see inset of Fig. 5). The presence of the core-hole essentially provokes a 2.5 eV shift towards lower energy of the pre-edge features, while the main rising edge is not shifted. A similar energy shift due to the core-hole was already observed for electric quadrupole transitions at the Ti pre-edge in rutile.Joly et al. (1999) Unfortunately, here the shift induced by the presence of the core-hole is not large enough to give a perfect agreement with experiment. This problem may be due to the limit of the density functional theory within LDA to model the core hole-electron interaction for empty states of 3 transition metals. LDA+U calculations could possibly improve the agreement in the pre-edge region. Indeed in Ref.Mazurenko et al. (2004), the authors show that LDA+U calculations performed on ruby essentially affect the positions of Cr level relative to the valence and the conduction band.
III.3 Comparison between experimental and calculated XANES spectra
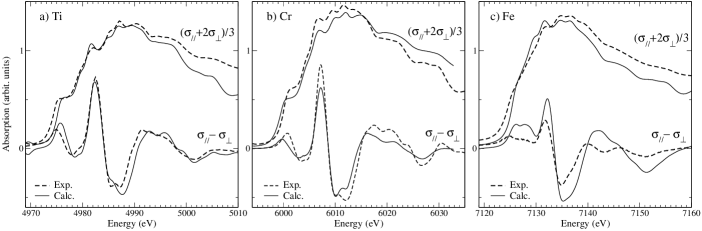
Fig. 6 compares experimental XANES data with the theoretical spectra obtained with the relaxed models. The and signals are displayed at the Ti edge for the pink sapphire sample (Fig.6a), at the Cr edge for the ruby sample (Fig.6b) and at the Fe edge for the blue sapphire sample (Fig.6c).
One observes that the experimental spectra present comparable overall shapes. The Fe edge seems to be less resolved than the Ti and Cr edges, probably due to the following two reasons: (i) the core-hole lifetime is shorter at the Fe -edge (1.25 eV) than at the Cr -edge (1.08 eV) and at the Ti -edge (0.94 eV);Krause and Oliver (1979) (ii) the instrumental resolution is estimated to 0.9 eV at the Fe -edge while it is 0.6-0.7 eV at both the Cr and Ti -edges. We also noticed similarities between the M edges (M=Ti, Cr, Fe) in -Al2O3:M3+ and in -M2O3 (see Ref.Grunes (1983) for the Cr edge in -Cr2O3 and the Fe edge in -Fe2O3, and Ref.Waychunas (1987) for the Ti edge in -Ti2O3). At least to a certain extent, these spectra could be considered as the signature of a transition metal ion with a +III oxydation state in six-fold coordinated environment. However it is here necessary to perform calculations to go farther in the XANES analysis.
It can be seen in Fig. 6 that a good agreement is obtained between experimental data and calculated spectra carried out on the relaxed structural models. The agreement is especially good for ruby at the Cr edge, where energy positions and relative intensities of the various features are well reproduced. It should be emphasized that not only the averaged spectra are correctly reproduced, but also the dichroic signal, from which more precise structural information could be extracted. Such a good agreement with angular dependent spectra has been also obtained with the same calculation method: at the Al edge in corundumCabaret et al. (2004) and at the Si edge in -quartz.Taillefumier et al. (2002)
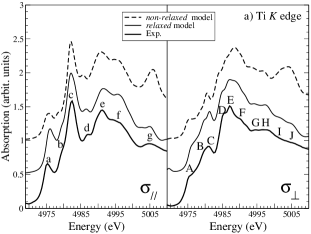
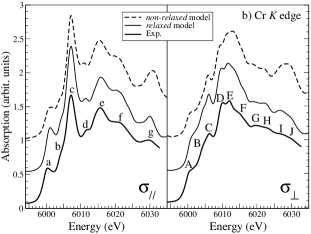
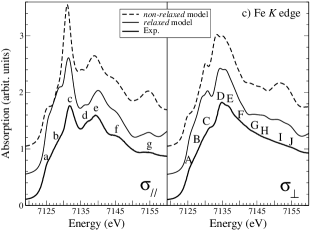
We have seen in Sec. III.1 that the differences between the relaxed and non-relaxed structures are essentially concerned with the interatomic distances within the coordination shell of the impurity. Therefore, it is interesting to test the sensitivity of XANES to such subtle structural modifications. Fig. 7 compares and experimental spectra with the corresponding calculated ones performed from both non-relaxed and relaxed models. First of all, it is worth noting that the differences observed between calculated spectra are small but not negligible. For all compounds, peaks labeled in and labeled and in are too strong in the non-relaxed calculated spectra. Consequently, these features (all located at about 30 eV above the edge) are clearly correlated to the first interatomic distances around the impurity. The same conclusion can be made for the shoulders labeled and in and in . Especially at the Cr edge in signal, one can see that the double-feature ( and ) is better reproduced by the relaxed calculation than by the non-relaxed one.
In a previous study,Gaudry et al. (2003) the relaxed model was validated up to the second neighbors around the impurity by comparison with EXAFS measurements. Here, thanks to the very good agreement obtained between experimental and relaxed calculated XANES spectra, the relaxed structural model is again validated and this time to greater extent.
IV Conclusions
In this paper, we have shown that XANES can provide precious information about the small structural relaxation occuring within the atomic site of impurity in an aluminum oxide matrix. This has been achieved by (i) measuring angular dependent XANES spectra in order to probe the distortion of the impurity site, (ii) calculating structural model by ab initio energy minimization, (iii) calculating the XANES spectra from the previous theoretical structural models using the full-potential pseudopotential self-consistent method of Ref.Taillefumier et al. (2002) The good agreement obtained between experimental and calculated spectra permits the validation of the structural models. We have also pointed out the importance of the electronic potential construction to carry this study to a successful conclusion. These results opens new applications in XANES analysis, in particular for dilute samples for which good quality EXAFS measurements are difficult to collect.
Acknowledgements.
We wish to acknowledge the computational support of the French Institut du Développement et de Recherche en Informatique Scientifique in Orsay, where all the calculations of this study were carried out.References
- Miller (1981) H. Miller, Physica C 104, 183 (1981).
- Verhoeven et al. (1998) J. D. Verhoeven, A. H. Pendray, and W. E. Dauksch, JOM 50, 58 (1998).
- Gaudry et al. (2003) E. Gaudry, A. Kiratisin, Ph. Sainctavit, Ch. Brouder, F. Mauri, A. Ramos, A. Rogalev, and J. Goulon, Phys. Rev. B 67, 094108:1 (2003).
- Waychunas et al. (2003) G. A. Waychunas, C. C. Fuller, J. A. Davis, and J. J. Rehr, Geochim. Cosmochim. Acta 67, 1031 (2003).
- Taillefumier et al. (2002) M. Taillefumier, D. Cabaret, A.-M. Flank, and F. Mauri, Phys. Rev. B 66, 195107 (2002).
- Burns (1993) R. G. Burns, Mineralogical Applications of Cristal Field Theory, vol. 5 of Cambridge topics in Mineral Physics and Chemistry (Cambridge University Press, 1993), 2nd ed.
- Nassau (1983) K. Nassau, The Physics and Chemistry of Color (Wiley Interscience, 1983).
- Newnham and de Haan (1962) R. Newnham and Y. de Haan, Zeit. Kristallogr. 117, 235 (1962).
- Eigenmann (1970) H. K. Eigenmann, Ph.D. thesis, Eidgenössischen Technischen Hochschule, Zürich (1970).
- Goulon et al. (1998) J. Goulon, A. Rogalev, C. Gauthier, C. Goulon-Ginet, S. Paste, R. Signorato, C. Neumann, L. Varga, and C. Malgrange, J. Synchrotron Rad. 5, 232 (1998).
- Rogalev et al. (2001) A. Rogalev, J. Goulon, C. Goulon-Ginet, and C. Malgrange, in Magnetism and Synchrotron Radiation, edited by E. Beaurepaire, F. Scheurer, G. Krill, and J.-P. Kappler (Springer, 2001).
- Car and Parrinello (1985) R. Car and M. Parrinello, Phys. Rev. Lett. 55, 2471 (1985).
- (13) ”CPMD V3.7 Copyright IBM Corp 1990-2003, Copyright MPI fuer Festkoerperforschung Stuttgart 1997-2001”. For more information see http://www.cpmd.org.
- (14) Calculations were performed with PARATEC (PARAllel Total Energy Code) by B. Pfrommer, D. Raczkowski, A. Canning, S.G. Louie, Lawrence Berkeley National Laboratory (with contributions from F. Mauri, M. Cote, Y. Yoon, Ch. Pickard and P. Haynes). For more information see www.nersc.gov/projects/paratec.
- Troullier and Martins (1991) N. Troullier and J. L. Martins, Phys. Rev. B 43, 1993 (1991).
- Kleinman and Bylander (1982) L. Kleinman and D. M. Bylander, Phys. Rev. Lett. 48, 1425 (1982).
- Duan et al. (1998a) W. Duan, R. M. Wentzcovitch, and K. T. Thomson, Phys. Rev. B 57, 10363:10369 (1998a).
- Duan et al. (1998b) W. Duan, G. Paiva, R. M. Wentzcovitch, and A. Fazzio, Phys. Rev. Lett. 81, 3267 (1998b).
- (19) Within the space group, the 4 symmetry site corresponds to the positions and the 6 symmetry site corresponds to the positions .
- Lever (1984) A. Lever, Inorganic Electronic Spectroscopy (Elsevier, 1984).
- Cabaret et al. (2004) D. Cabaret, E. Gaudry, M. Taillefumier, P. Sainctavit, and F. Mauri, Physica Scripta, Proc. XAFS-12 conference (2004), to be published.
- Blöchl (1994) P. E. Blöchl, Phys. Rev. B 50, 17953 (1994).
- Haydock et al. (1972) R. Haydock, V. Heine, and M. J. Kelly, J. Phys. C: Solid State Phys. 5, 2845 (1972).
- Haydock et al. (1975) R. Haydock, V. Heine, and M. J. Kelly, J. Phys. C: Solid State Phys. 8, 2591 (1975).
- (25) For electric dipole and quadrupole transitions, the operator of Eq.2 in Ref. Taillefumier et al. (2002) is equal to and to , respectively. The unit vector is the direction of the polarisation of the incident photon beam, and is the wave vector.
- Ankudinov et al. (1998) A. L. Ankudinov, B. Ravel, J. J. Rehr, and S. D. Conradson, Phys. Rev. B 58, 7565 (1998).
- Natoli et al. (1980) C. R. Natoli, D. K. Misemer, S. Doniach, and F. W. Kutzler, Phys. Rev. A 22, 1104 (1980).
- Benfatto et al. (2003) M. Benfatto, S. D. Longa, and C. R. Natoli, J. Synchrotron Rad. 10, 51 (2003).
- Monkhorst and Pack (1976) H. J. Monkhorst and J. D. Pack, Phys. Rev. B 13, 5188 (1976).
- Kokubun et al. (2004) J. Kokubun, K. Ishida, D. Cabaret, F. Mauri, R. V. Vedrinskii, V. L. Kraizman, A. A. Novakovich, E. V. Krivitskii, and V. E. Dmitrienko, Phys. Rev. B 69, 245103 (2004).
- Krause and Oliver (1979) M. Krause and J. Oliver, J. Phys. Chem. Ref. Data 8, 329 (1979).
- Laurance et al. (1962) N. Laurance, E. C. McIrvine, and J. Lambe, J. Phys. Chem. Solids 23, 515 (1962).
- Lohr and Lipscomb (1963) L. L. Lohr and W. H. Lipscomb, J. Chem. Phys. 38, 1607 (1963).
- Moss and Newnham (1964) S. C. Moss and R. E. Newnham, Zeitschr. Kristallogr. 120, 359 (1964).
- McCauley and Gibbs (1972) J. W. McCauley and G. V. Gibbs, Zeitschr. Kristallogr. 135, 453 (1972).
- Kizler et al. (1996) P. Kizler, J. He, D. R. Clarke, and P. R. Kenway, J. Am. Ceram. Soc. 79, 3 (1996).
- Zheng (1998) W.-C. Zheng, Physica B 245, 119 (1998).
- Shannon (1976) R. D. Shannon, Acta. Cryst. A32, 751 (1976).
- Langer (2001) K. Langer, Z. Kristallogr. 216, 87 (2001).
- Shirley (1998) E. L. Shirley, Phys. Rev. Lett. 80, 794 (1998).
- Soininen and Shirley (2001) J. A. Soininen and E. L. Shirley, Phys. Rev. B 64, 165112(1 (2001).
- Gaudry et al. (2004) E. Gaudry, D. Cabaret, Ph. Sainctavit, Ch. Brouder, F. Mauri, A. Rogalev, and J. Goulon, Physica Scripta Proc. XAFS-12, Sweden, 2003 (2004).
- (43) One should keep in mind that is what has been measured. It corresponds to the isotropic spectrum only in the electric dipole approximation, but under no circumstances in the electric quadrupole approximation.
- Joly et al. (1999) Y. Joly, D. Cabaret, H. Renevier, and C. R. Natoli, Phys. Rev. Lett. 82, 2398 (1999).
- Mazurenko et al. (2004) V. V. Mazurenko, A. N. Varaksin, V. G. Mazurenko, V. S. Kortov, and V. I. Anisimov, Physica B 344, 385 (2004).
- Grunes (1983) L. A. Grunes, Phys. Rev. B 27, 2111 (1983).
- Waychunas (1987) G. A. Waychunas, Am. Mineral. 72, 89 (1987).
- Finger and Hazen (1980) L. W. Finger and R. M. Hazen, J. Appl. Phys. 51 (1980).