Scaling in public transport networks
Abstract
We analyse the statistical properties of public transport networks. These networks are defined by a set of public transport routes (bus lines) and the stations serviced by these. For larger networks these appear to possess a scale-free structure, as it is demonstrated e.g. by the Zipf law distribution of the number of routes servicing a given station or for the distribution of the number of stations which can be visited from the chosen one without changing the means of transport. Moreover, a rather particular feature of the public transport network is that many routes service common subsets of stations. We discuss the possibility of new scaling laws that govern intrinsic features of such subsets.
PACS: 89.75.-k, 89.75.Da, 05.65.+b
1 Introduction. What are complex networks for a physicist
Complex networks have only recently become a subject discussed on the pages of physical journals [1]. However, currently the statistical mechanics of complex networks is an important and quickly evolving field of physics [2], as one can check e.g. making a search in the WWW (the latter being another huge complex network and hence by itself an important subject of study). As has been worked out in the meantime, complex web-like structures are involved in such different systems as the already mentioned WWW (with its documents as nodes and links as edges) [4], the metabolism of a biological cell (substrates connected by bio-chemical reactions) [5], social communications (human beings connected by various relationships) [6], ecological systems (food webs joining different species) [7], etc. Therefore, these and similar systems can be formally described in terms of the same formalism and very often they manifest similar statistical behaviour.
Of particular interest for our study is the question if the network displays scale-free properties: a notion introduced to characterize a network which does not posses a typical scale [3]. A network is called scale-free when its node degree distribution, i.e. the probability that a randomly selected node has edges, possesses a power-law tail:
| (1) |
Since its first observation by G.K. Zipf in quantitative linguistics [8] the power law (1) is referred to as Zipfs law. For a physicist working in the field of statistical physics, appearance of universal power laws - scaling laws - serves as a manifestation of collective behaviour of a many-particle system at the critical point [9]. This explains, in particular, why physicists (often those, working in a field of critical phenomena) apply their efforts and skills in the network theory and why these efforts may be fruitful.
The last decades of the past century offered theoretical descriptions of critical phenomena which show why universal scaling laws (1) emerge and give reliable numerical estimates for the exponents governing the scaling of different physical observables [10]. This description was made possible by the application of field theoretical methods in many particle physics [11] and serves as a background to explain and to predict scaling in various systems. However, the modern theory of networks differs from the modern theory of critical phenomena in a way that although it operates with models describing different types of networks and looks for the Zipf laws governing the scaling of the properties of these networks, the prediction or explanation of certain scaling properties is done mainly via computer simulations, or a simple (mean-field like) analysis. A theoretical description of complex networks, involving e.g. a theory beyond the tree graph approximation similar to the field-theoretical description of critical phenomena with non-trivial interactions [9, 10, 11] is still missing.
At this level of network analysis it is important both to search for new types of networks that exist in complex structures as well as to collect “empirical data”: to look for observables describing these networks and to analyse their properties. In our paper, we want to attract attention to a feature frequently encountered in complex networks: Looking at the paths of connections on the “motherboard” of a computer, the wiring in a car, or even the neural connections along the spine of vertebrates one observes as a common feature that the physical paths used by the lines connecting different nodes are often shared by many other lines connecting other nodes. We are interested in the distribution of the load along these paths. We study this property for more easily accessible examples of networks of public transport (PT networks). We will show that a PT network may demonstrate a scale-free behaviour. Moreover, a rather particular feature of the PT network is that many routes possess common subsets of stations. We will demonstrate that new scaling laws may govern intrinsic features of distributions defined on these subsets.
The rest of the paper is organized as follows: in the next section 2 we explain what we mean by a PT network, introduce the observables used to describe it and give the sources of our further analysis. In section 3 we will show that the node degree distribution of PT networks obeys the Zipf law (1) and hence a PT network may constitute an example of a scale-free network [3]. In section 4 we will consider in particular the traffic load distribution of paths of different length studying situations where many routes possess common subsets of nodes. We check these properties for scale-free behaviour and speculate on a generalization. Conclusions and an outlook are given in section 5.
2 A PT network
In our study we consider networks of public transport (buses, trams, and subways), called hereafter PT networks. In a PT network, the nodes are the stations of public transport and the edges are the links connecting them along the route (see figure 1). We will be interested in various characteristics of PT networks that describe statistical properties of node-link distributions. The examples are given below. We will perform our study according to the following scheme:
a) choose a PT network;
b) make an ordered list of stations visited by each line;
c) check the network statistics.
Let us comment on each of the above items before giving results about the network structure.
a) As usual, to allow general properties of a network structure to manifest themselves, the network analysed should be large enough in terms of numbers of nodes and edges. Therefore, we choose the PT networks of big cities, having large numbers of routes and stops. The results presented below are based on an analysis of PT networks of Berlin (198 routes and 2952 stations), Düsseldorf (124 and 1615) and Paris (232 and 4003). In an extension of our present study which is under way we analyse the PT networks of more and larger cities.
b) The schedules of public transport for the above cities were downloaded from the internet [12] and brought into appropriate format to construct the ordered lists of stations serviced by each line (hereafter we do not make any difference between bus/tram/subway PT lines). These serve as a background for the network structure analysis.
c) The ordered lists of stations allow to perform some statistics checking typical quantities describing the network. The most simple one concerns the number of lines that service a given station [13] and the number of other stations one may reach without changing the bus/tram from a given station. The distribution of the first quantity gives the familiar node degree distribution introduced in the previous section. The choice of the second quantity comes about as a node degree distribution of a conjugated network where each station (node) is connected with all other stations for which there is a route servicing both. This has quite practical consequences: it describes the neighbourhood of given station and hence its ”utility”. Below, we will denote this the size of this neighbourhood by .
A lot of different characteristics of the network can be introduced depending on the particular problem one is interested in. Here, we want to attract attention to a particular feature of a PT network: often, a sequence of nodes is joined by more than one line. This is the familiar situation when one can go from one station to another by different train or bus lines without making a change. To study the distribution of such sequences of stations, let us introduce the quantity : the number of node segments of length connected by lines.
Results of numerical analysis of the above introduced quantities and will be presented in the next two sections.
3 Scale-free behaviour
First, we examine the node degree distribution of the PT networks. Results are shown in the figure 2, where we plot the number of stations for the PT networks of Berlin, Düsseldorf, and Paris as a function of the routes going through them (a node degree [13]). Being normalized by the overall number of stations, this function gives the node degree distribution , hence both quantities obey the same scaling. One observes a power-law behaviour (1) in figure 2 which leads to the conclusion that the PT networks may be scale-free. The least squares fit for all data points of each city gives: Berlin: 2.90; Düsseldorf: 2.45; Paris: 2.94. The values of the two larger networks are close to corresponding to the preferential attachment scenario [2].
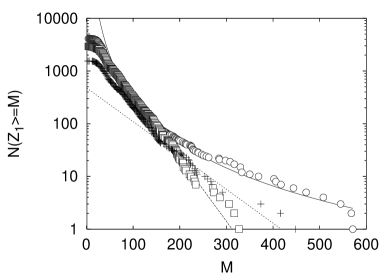
Another network property analysed here is the size of the direct neighbourhood of a given station introduced in the section 2: the number of stations one may reach without changing from that station. By definition, for a given station this quantity is obtained by counting all stations which belong to the routes crossing it. We show the number of stations with a neighbourhood larger than as function of in figure 3. This function corresponding to an integrated distribution is by definition monotonous and thus smoother than the distribution of itself. As is seen from the double logarithmic and log-linear plots only the largest (Paris) network develops a clear power law tail with an exponent for the integrated distribution of about . The Duesseldorf network may also be approximated by two exponentials.
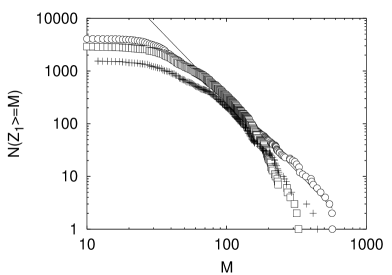
Recently, another PT network property was reported to possess universal scaling behaviour: it was shown that the mean distance between nodes of different degrees is governed by a scaling law [14].
4 Segment distributions
As we have already seen in the previous section, large PT networks may have scale-free properties as shown by the power-law behaviour of their node-degree distribution. Our next step will be to study some other characteristics of the PT networks and to check them for a power-law behaviour. Another example was given in the previous section by the neighbourhood size . Here, we will continue the analysis for the values , as introduced in section 2: a number of node segments of length connected by lines. Our interest in these values is caused by the fact, that for a real “physical” network different numbers of links between nodes correspond to different loads on the connection between these nodes. Besides the PT network an example may be given by the network of wires connecting complex electric circuit, or a network of tubes transmitting a fluid etc. In these cases, the information about the loads on the links and their distribution is important not only for understanding the entire network features, but also for optimizing its structure.
First, we analyse : the number of segments of length 1 consisting of lines. From now on we will calculate the integral characteristics, that is calculating we take into account all sequences of stations of length 1 consisting of lines. The result is shown in figure 4.a. Again, a power law holds:
| (2) |
with the exponent ranging from 3 to 4 for the networks considered. The least squares fit gives the values given in table 1.
| Berlin | Düss. | Paris | |
|---|---|---|---|
| 1 | 3,47 | 3,09 | 3,97 |
| 2 | 3,58 | 3,58 | 4,59 |
| 3 | 3,77 | 4,08 | 4,95 |
| 4 | 4,55 | 3,82 | 6,06 |
| 5 | 4,75 | 3,9 | 5,9 |
Obviously, the power-law behaviour found for should not hold for all values of and . Indeed, the other limiting case describes distribution of lengths of different routes. Function will have a maximum corresponding to the mean length of route, provided the network has enough routes for a good statistics. The behaviour of the function with increasing is shown by figures 4. It is tempting to describe the plots given in the figures by power-laws with exponents , depending on the line length :
| (3) |
Numerical values of the corresponding exponents are given in the table 1 for . The columns of the table give results obtained by the least-squares fit for each city separately. The data of figures 4.a-f seem obey power laws, but obviously it is too early to state this as a definite conclusion at least for two reasons. The first obvious reason is that the statistics considered so far concerns three different networks only (PT networks of three different cities). Although the networks themselves were chosen to be large enough (see section 2), still it is desirable to support the data obtained by analysis of a larger number of networks. The second reason is more subtle: it is obvious, that decreases with for the (real) PT networks considered here. Indeed, the larger the the smaller (1) and the smaller the probability that several () subsequent nodes have the same node degree. Therefore, the number of data points for always will decrease with and leading to poor statistics for any real network: c.f. number of data points in figures 4.a and 4.f. So the data for presented in the table 1 for each separate network networks are to be considered rather as an attempt for a power law fit, and not as a definite conclusion about the universal power-law distribution. Nevertheless, we consider this observation to be interesting for further study.
5 Conclusions, outlook, and …best wishes!
This paper is written for a special issue of CMP in honour of Reinhard Folk 60th birthday. The majority of the contributions to the Festschrift reflect the honorees field of activity: phase transitions in condensed matter physics. In our introduction we tried to show a possible link between complex network behaviour and criticality in condensed matter provided by the scaling phenomenon, as we, being new to the fascinating field of complex networks understand it. By this paper we want to congratulate Reinhard Folk on the occasion of his birthday and to acknowledge his vivid interest and active participation in the numerous discussions about complex networks during the great time two of us (CvF and YuH) had enjoying his wonderful hospitality in Wintersemester 2004 in Linz.
The PT networks discussed in this paper provide one more example of the scale-free networks, as demonstrated by the power law behaviour (1) of their node degree distribution (figure 2). Besides, some other properties of these networks may obey scaling laws. An example was given by the integrated distribution of the neighbourhood size describing the number of stations which can be serviced from the chosen one without making a change. We found evidence that the functions - the number of node segments of length connected by lines - may be described by power-law fits (3) at least for low . Our interest in these values is caused by the fact, that they are important to understand specific properties of PT networks, where many routes possess common subsets of nodes and other examples of similar structure that were briefly mentioned in the paper as well.
A natural continuation of this study is to improve the network statistics considered here, by taking a larger number of PT networks as well as to continue analysis of different network characteristics.
One of us (YuH) acknowledges the Austrian Fonds zur Förderung der wissenschaftlichen Forschung for support under project No. 16574-PHY.
References
- 1. For an introduction to networks which does not postulate any professional preparation see e.g.: A.-L. Barabási. Linked. Plume, 2003. A recent book which gives the essentials of the theory: S. N. Dorogovtsev, J. F. F. Mendes. Evolution of networks. Oxford University Press, Oxford, 2003
- 2. R. Albert, A.-L. Barabási. Rev. Mod. Phys. 74 47 (2002)
- 3. A.-L. Barabási, R. Albert. Science 286 509 (1999)
- 4. R. Albert, H. Jeong, A.-L. Barabási. Nature (London) 401 130 (1999)
- 5. H. Jeong, B. Tombor, R. Albert, Z.N. Oltvai, A.-L. Barabási. Nature (London) 407 651 (2000)
- 6. M.S. Granovetter. Am. J. Sociol. 78 1360 (1973)
- 7. J.M. Montoya, R.V. Solé. preprint cond-mat/0011195 (2000); R.V. Solé, J.M. Montoya. Proc. R. Soc. Lond. B 268 2039 (2001)
- 8. G. K. Zipf. The psycho-biology of language. An introduction to dynamic philology. Houghton Mifflin Comp., Boston, 1935.
- 9. C. Domb. The critical point. Taylor & Francis, London, 1996; P.M. Chaikin, T.C. Lubensky. Principles of condensed matter physics. Cambridge University Press, Cambridge, 1995.
- 10. Recent papers reviewing critical phenomena may be found in: Yu. Holovatch (Ed.). Order, disorder and criticality. Advanced problems of phase transition theory. World Scientific, Singapore, 2004.
- 11. J. Zinn-Justin. Quantum field theory and critical phenomena. Oxford University Press, Oxford, 1996; H. Kleinert, V. Schulte-Frohlinde. Critical properties of -theories. World Scientific, Singapore, 1991.
- 12. The data for the public transport of Berlin, Düsseldorf and other German cities may be fould following links on http://www.oepnv.de/. Data for the Paris bus network used in our study is available at http://www.citefutee.com/.
- 13. Here, we take the node degree to be equal to the number of PT routes going through the given node (which is half the number of lines for the internal nodes crossed by these routes).
- 14. J.H. Holyst, J. Sienkiewicz, A. Fronczak, P. Fronczak, K. Suchecki. preprint cond-mat/0411160, 2004.