Polyelectrolyte-induced peeling of charged multilamellar vesicles
Abstract
We study mixtures of charged surfactants, which alone in solution form uni- and multilamellar vesicles, and oppositely charged polyelectrolytes (PEs). The phase behavior is investigated at fixed surfactant concentration as a function of the PE-to-surfactant charge ratio . We find that, for , aggregates form. Light microscopy and X-ray scattering experiments show that the isoelectric point plays a crucial role since the morphology and the microscopic structure of the aggregates are different before () and after the isoelectric point (). To better understand the dynamics for the formation of PE/surfactant complexes, we perform light microscopy experiments where we follow in real-time the effect of a PE solution on one multilamellar vesicle (MLV). We find that the PE induces a peeling of the bilayers of the MLV one by one. The peeling is accompanied by strong shape fluctuations of the MLV and leads ultimately to a pile of small aggregates. This novel phenomenon is analyzed in detail and discussed in terms of PE-induced tension, and pore formation and growth in a surfactant bilayer.
1 Introduction
The phase behavior of mixtures of polymers and surfactants is extensively studied because of both fundamental and industrial interests [2], these mixed systems being widely used in industrial applications ranging from food, to cosmetic or health-care. Among polymer/surfactant composites, blends of polyelectrolyte (PE) and oppositely charged surfactants have received particular attention [3]. Very generally, around the isoelectric point, which is characterized by an equal number of positive and negative charges brought by the two species, an associative precipitation occurs. The driving force for this associative precipitation is mainly the electrostatic interactions between PE and surfactants where entropy is gained thanks to the counterions released upon polymer-surfactant binding. Other forces, such as the hydrophobic interactions between the polyelectrolyte backbone and the surfactant hydrocarbon tails [4], may however play an important role as well. Recently, it has been shown that the condensate exhibits very often a long-range order reminiscent of the structures classically found in surfactant/water mixtures (lamellar, hexagonal and cubic phases) [5, 6, 7]. When the surfactant forms bilayers, the presence of PE may convert the largely separated bilayers into densely packed membrane stacks with PE strands sandwiched between the surfactant bilayers. This phenomenon has been referred to as bridging by the polyelectrolyte [8, 9] and appears promising for many industrial or therapeutic applications. However, its exact mechanism and its dynamics have never been investigated experimentally.
Thus, despite a large amount of experimental studies, surprisingly enough, not much is known on the dynamics of associative precipitation between PE and oppositely charged surfactants. In order to gain insight on the dynamics, novel experimental approaches are needed. We therefore have started real-time observations by light microscopy of the effect of a polyelectrolyte solution on assemblies of oppositely charged surfactants. Our experiments allow a detailed investigation of the polyelectrolyte-induced morphological transition of a multilamellar vesicle (MLV) to be performed. They show quite unexpectedly that the polyelectrolyte provokes a slow but continuous peeling of the MLV through successive removal of the bilayers one after the other.
The paper is organized as follows. In Sec. 2, we investigate by visual inspection, light microcopy, and X-ray scattering the phase-diagram of the PE/surfactant mixtures obtained by gently mixing together the PE and the surfactant solutions. In the range of surfactant concentration investigated, we find that the structure and morphology of the PE/surfactant complexes depend only on the PE-to-surfactant charge ratio, . We then present in Sec. 3 our main results concerning real-time observation of the interaction between a MLV and a PE solution and finally discuss a possible physical mechanism for polyelectrolyte-induced peeling of the MLVs. We conclude in Sec. 4.
2 Phase diagram of the surfactant/polyelectrolyte mixtures
2.1 Materials
We use Didodecylammonium Bromide, DDAB, , as cationic surfactant and an alternating copolymer of styrene and maleic acid in its sodium salt form, , as negatively charged polyelectrolyte. The polyelectrolyte (PE) and DDAB are purchased from Aldrich and used as received. The PE molar weight is g/mol, which corresponds approximatively to monomers per molecule. The pH of the PE solution is around , while the pKa of the two acidic functions of maleic acid are and ; this ensures that the PE is indeed in the basic form as indicated by the supplier and possesses thus negative charges per monomer.
We call and respectively the surfactant and polyelectrolyte concentrations. In most experiments, we use dilute surfactant solutions with mM or mM (it corresponds respectively to and % w/w). At these concentrations, surfactant molecules simply diluted in water give a mixture of unilamellar vesicles and multilamellar vesicles (MLVs), with a relatively large amount of big MLVs (size ). We define as the polyelectrolyte-to-surfactant charge ratio ( corresponds to the stoichiometric charge neutrality) and calculate assuming that there is no counterion condensation. As we will see later, different behaviors are observed in the phase diagram, for and . The fact that the cross-over between two regimes is observed at is a clear hint that our determination of should be correct. In most experiments, varies between and , which corresponds to a maximum PE concentration equal to w/w (resp. w/w) for mM (resp. mM)
2.2 Light microscopy observations
Samples are prepared by gently mixing together a surfactant solution and a polyelectrolyte solution. The final surfactant concentration is fixed ( mM or mM) and the PE concentration is changed in order to vary .
Macroscopically, one finds that as PE is added to the surfactant solution, the mixture becomes instantaneously turbid, indicating the presence of aggregates of micrometer size. The turbidity continuously increases as the amount of PE increases up to the isoelectric point. Above the isoelectric point (), aggregates precipitates into larger flocculates that may stick to the container walls. As more PE is incorporated, the flocculates start to resolubilize until a totally transparent solution is recovered at very large PE excess (for larger than ).
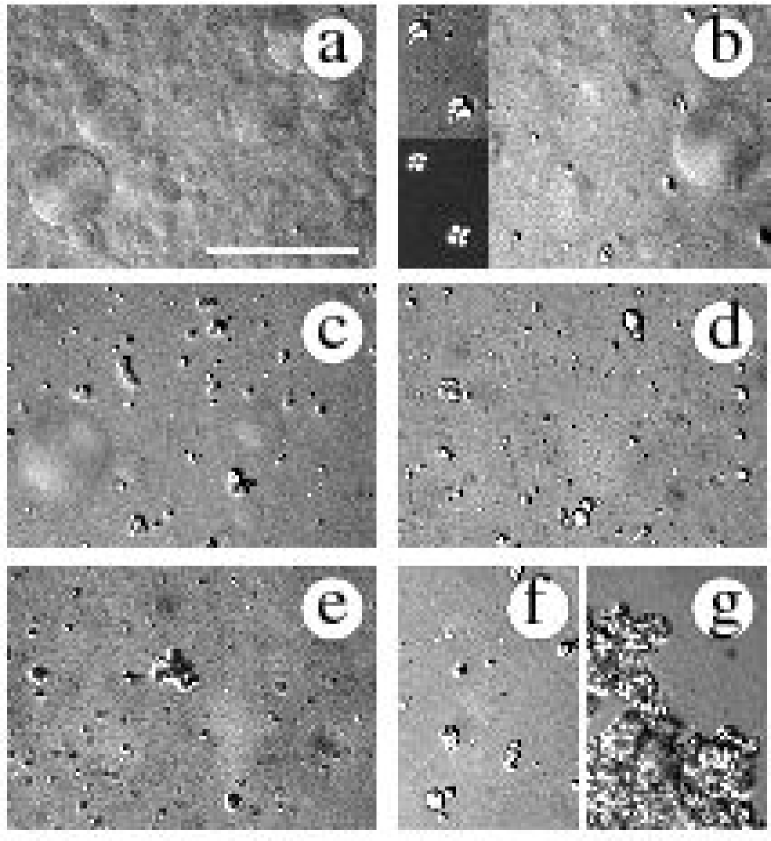
Observations of the samples with a light microscope corroborates the macroscopic observations described above. Figure 1 presents a series of micrographs, taken under differential interference contrast conditions, of the PE/surfactant systems that follow the evolution of the microstructures with changes in the PE-to-surfactant charge ratio. For , that is in excess of surfactant, one observes the coexistence of apparently unaffected surfactant assemblies and aggregates (fig.1a-c). Even for very small, hence in large excess of surfactant, one observes aggregates instead of a solubilization of the PE by the surfactant as very often seen in PE/surfactant mixtures (a similar effect has been noticed in Ref.[10]). We note that the aggregates can be unambiguously distinguished from the multilamellar vesicles because of their much higher contrast. The aggregates have a rather spherical shape and a smooth interface. They are polydisperse with a maximum size of about m. Moreover, they are birefringent and exhibit surprisingly nice maltese crosses when viewed between crossed polarizers (see fig.1b), suggesting that their structure is lamellar [11]. The respective proportion of MLVs and aggregates decreases as increases and at the isoelectric point, no surfactant multilamellar vesicles are apparently present anymore: only the spherical and birefringent aggregates persist (fig.1d). Beyond the isoelectric point, in excess of PE, large flocculates with more corrugated surface than the aggregates are observed (fig.1e-g). These flocculates eventually dissolve in a large excess of polyelectrolyte (for ). They are also birefringent but contrary to the aggregates observed below the isoelectric point, no clear texture is distinguishable between crossed polarizers.
We note that all the structures described here form instantaneously upon mixing the PE and surfactant solutions and appear to be quite stable, as they do not evolve with time.
2.3 X-ray scattering experiments
Small-angle X-ray scattering (SAXS) experiments have been performed using an in-house setup with a rotating anode X-ray generator equipped with two parabolic mirrors giving a highly parallel beam of monochromatic Cu K radiation (wavelength nm). The SAXS intensity is collected with a two-dimensional detector.
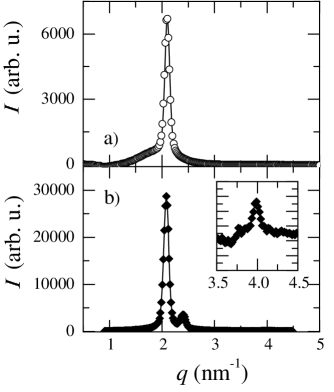
We find that the SAXS patterns of the mixtures of PE and surfactant do not depend on the surfactant concentration (for in the range mM). Two markedly different scattering patterns are however obtained for , that is in excess of surfactant or at the isoelectric point, and for , that is in excess of PE. A typical spectrum measured in the regime is shown in fig.2a. A unique and sharp peak is obtained at a wave-vector . This peak is unambiguously due to the scattering of the aggregates aggregates because at equivalent concentrations the scattered intensity of the surfactant or of the polyelectrolyte alone in solution is essentially flat in the range of q-vectors investigated here (). Although the birefringence pictures of the aggregates suggest that they have a lamellar symmetry, no peak can be detected at higher wave-vector (in particular at ). The spectra shown fig.2a can be compared to the one obtained when a high salt (NaCl) concentration (M) is added to a same DDAB solution causing the collapse of the surfactant bilayers: in that case, two peaks are obtained, a sharp and intense one at a wave-vector slightly smaller than the one obtained for the DDAB/PE mixture () and a weak second order at (with maximum intensity more than one order of magnitude smaller than the one of the first peak), indicating a condensed lamellar phase. Because of the birefringence signature, as well as the fact that for the PE/DDAB mixture the full width at half maximum of the peak is equal to the one of the first order of the lamellar phase induced by NaCl, we believe that the PE-induced aggregates possess also a lamellar symmetry. However, because of contrast effect, the second order could not be detected because it would fall in the close vicinity of a minimum of the form factor. To conclude, the PE-induced aggregates are presumably PE/surfactant complexes constituted of a condensed lamellar phase with an interlayer spacing nm, which is slightly larger than the surfactant bilayer thickness nm [12, 13].
Beyond the isoelectric point, the microscopic structure is radically different. Three peaks are systematically obtained at , and . As can be seen in fig.2b, the second peak has a maximum intensity about one order of magnitude smaller than the first one, while the third one is extremely weak, with a maximum intensity more than two orders of magnitude smaller than that of the first peak. The relative positions of the three peaks rule out a hexagonal symmetry ; a cubic symmetry is also excluded because aggregates are birefringent. In addition, because the relative intensities of the peaks at and does not change when varying (but keeping ), these two peaks do not originate from the coexistence of two types of aggregates in our samples but correspond instead to a unique structure. Thus, the data suggest rather a complex structure with a condensed lamellar phase, giving rise to the two peaks at and , with an in-plane order, which is at the origin of the peak at . The interlamellar distance is nm and the characteristic size of the in-plane order is nm. We note that the interlayer spacing is the same as the one observed before the isoelectric point, the only difference between the structure before and after the isoelectric point being the existence of the in-plane order.
2.4 Discussion
Both light microscopy and X-ray scattering evidence two distinct regions, depending on the PE-to-surfactant charge ratio. One important result is that only two structures exist for the PE/surfactant complexes. In particular the structural characteristic lengths do not depend on the surfactant concentration neither on the values of the global PE-to-surfactant charge ratio of the mixtures but only on whether be smaller or larger than . This suggests that each of the two types of PE/surfactant complexes is characterized by a fixed PE-to-surfactant charge ratio : before the isoelectric point, because of the depletion in PE, complexes and apparently unaffected surfactant self-assemblies coexist in solution, and after the isoelectric point, the excess of PE is used to resolubilize the aggregates, the mixture being composed of resolubilized species (which are not observable by light microscopy and do not give a signal in the wave-vectors window probed by SAXS) and PE/surfactant complexes, directly observed by light microscopy.
Our results suggest moreover the existence of an in-plane correlation. We note that this type of structure is reminiscent of the one measured when DNA is added to a mixture of neutral and cationic lipids. In that case, the lamellar condensates of lipids and DNA shows a two-dimensional in-plane order of DNA intercalated between the lipidic bilayers [14, 15]. Contrary to what has been measured with DNA, the in-plane correlation peak measured here appears only in excess of polyelectrolyte and its position is independent of the PE-to-surfactant charge ratio (as long as ). A crucial difference between the experimental conditions of Refs.[14, 15] and ours is presumably that DNA is a much stiffer polyelectrolyte than the one we use. In-plane correlation has also been observed by electron microscopy for flexible polyelectrolytes [16] and has been attributed to hexagonally ordered polyions blobs at the surface of a lipid bilayer. No quantitative investigation on the concentration dependence of the in-plane correlation length has however been performed in that case.
In summary, the structures of the PE/surfactant complexes both before and after the isoelectric point are in agreement with the physical picture of bridging of the bilayers by the PE molecules since a condensed lamellar phase is measured in both cases. In addition, because the PE we use is an alternated copolymer of a charged monomer and a hydrophobic monomer (styrene), insertion of the PE in the surfactant bilayers is conceivable. The rather peculiar features of the phase diagram described here may be due to a subtle interplay between electrostatic and hydrophobic interactions between the surfactant bilayers and the polyelectrolyte molecules.
3 Real-time observations: polyelectrolyte-induced peeling of multilamellar vesicles
In order to gain insight on the dynamics of the condensed lamellar phase, we perform time-resolved light microscopy experiments where we follow in real-time the morphological transitions of a MLV induced by a polyelectrolyte solution.
3.1 Results
3.1.1 Experimental procedure
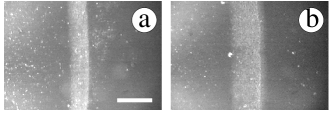
We use an observation chamber of approximative thickness m formed from heat sealing a glass coverslip to a glass slide with a Parafilm spacer. The surfactant solution is introduced by capillarity into the chamber, a drop of the PE solution is then put into contact with the surfactant solution, after which the apertures of the chamber are sealed with vacuum grease to avoid solvent evaporation and convective flow. In this way, a nice and smooth interface between the surfactant and the PE solutions is formed. The interface is betrayed by a strong contrast in bright field light microscopy because of the presence of highly contrasted (with respect to pure PE solution and to pure surfactant solution) PE/surfactant complexes (fig.3). As interdiffusion of the species proceeds, the interface initially very thin broadens.
We fix the surfactant and PE concentrations respectively at % w/w and , which correspond to concentrations of electric charges of respectively mM and mM. The concentration and respective volume of the two solutions are such that the overall PE-to-surfactant ratio is of the order of . Note that we have diluted the PE in a mixture of water and glycerol ( water) so as to increase the viscosity of the PE solution and hence slow down the diffusion of the PE into the surfactant solution [17].
In most experiments we focus on a unique large MLV using differential interference microscopy. Because of its large size, the MLV is essentially immobile in the field of view. The PE-induced morphological transitions are recorded on video-tapes and digitalized afterwards. We point out that in this type of experiment out-of-equilibrium structures are observed since there is a continuous supply of polyelectrolyte due to diffusion.
3.1.2 Observations
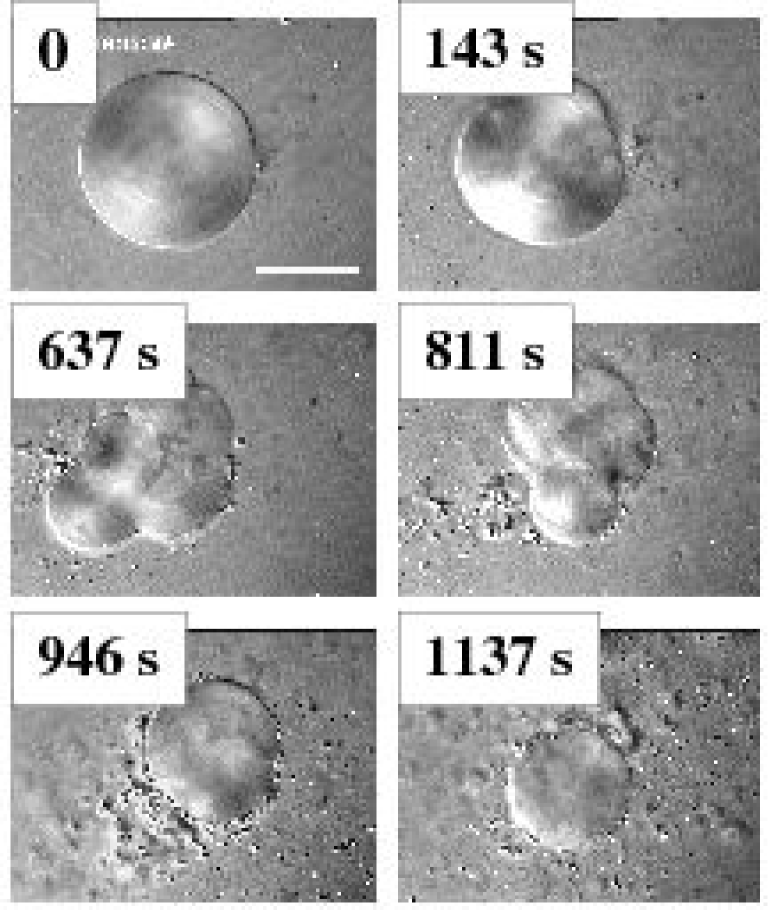
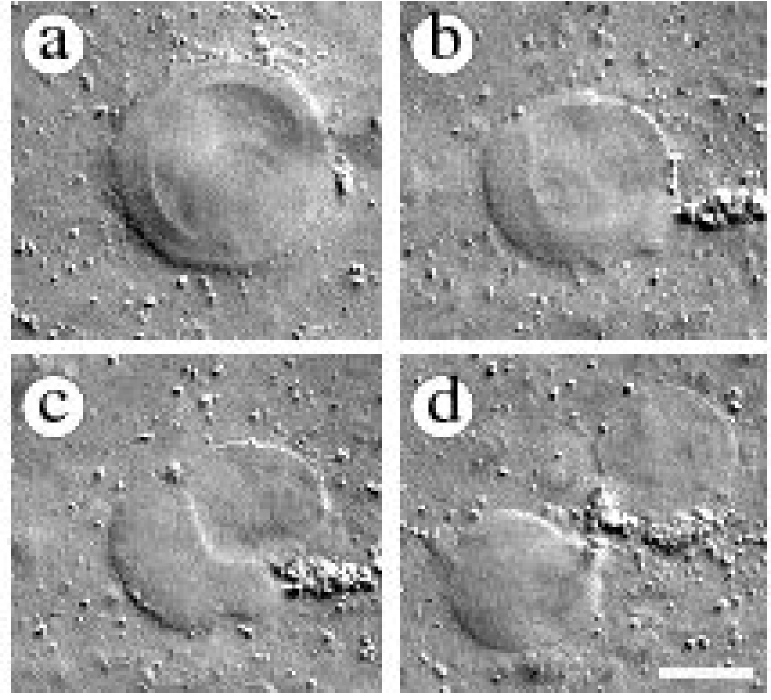
Figure 4 presents a series of snapshots of a MLV as it interacts with the polyelectrolyte solution. Time zero in this experiment is defined as the time where the MLV starts to experience modifications. This time coincides with the time at which small aggregates with a strong contrast appear in the field of view: this is the time when the PE, which is diffusing, reaches the MLV. As time goes on, one observes that the size of the MLV decreases continuously until its complete disappearance. The size decrease is accompanied by the formation in the close vicinity but also at the surface of the MLV of small aggregates A pile of small aggregates is left after complete disappearance of the MLV. The aggregates have a strong contrast and a morphology analogous to the PE/surfactant complexes observed in the regime above the isoelectric point (excess of PE) (fig.1e-g). A remarkable feature is that the size decrease and the formation of aggregates are associated with marked shape distortion of the initially spherical MLV. The shape of the MLV fluctuates strongly and can evolve very rapidly from a very distorted shape to a perfectly spherical one and back to another distorted shape. In order to quantify the morphological transition of the MLV, we define the average size of the MLV as the arithmetic mean of the minor, , and major, , dimensions of the MLV as measured from digitalized micrographs of D cross-sections of the MLV. In fig.5a, we plot the time evolution of this quantity normalized by the initial size of the MLV, . We observe a continuous decrease of , which has diminished by half in about s. In addition, we quantify the shape distortions by the anisotropy ration , which is found to range from (for a spherical object, see for instance fig.4 at and s) and almost (when the MLV is highly distorted as in fig.4 at and s). As can be seen in fig.5b, varies in a very erratic way with time, reflecting the fast changes of shape of the MLV.
We believe that the polyelectrolyte induces a progressive peeling of the MLV, i.e. a discrete removal of the bilayers of the MLV one after the other. Several experimental observations support this mechanism. First of all, all along the process and until the complete disappearance of the MLV, the contrast between the MLV and the outside solvent does not change and the contrast inside the MLV remains homogeneous. This suggests that all phenomena take place only at the interface between the MLV and the solvent as expected for a peeling mechanism for which, at any time, only the outer bilayer (i.e. the one in contact with the outside solvent) interacts with the polyelectrolyte solution.
Moreover, we were able to observe occasionally the division of one vesicle into two, which subsequently evolved independently. A very naive interpretation of this observation, compatible with the peeling scenario, is that at a certain time of the evolution of the mother MLV, the two preexisting daughters vesicles were uniquely maintained together by one bilayer. Once this bilayer has been peeled off, the two MLVs are released in solution and become independent one with respect to the other one. We point out that the micrographs showing this event (fig.6) are reminiscent to what has been recently observed in Ref.[18] but the physical mechanisms involved are different since membrane is created during the process described in Ref.[18].
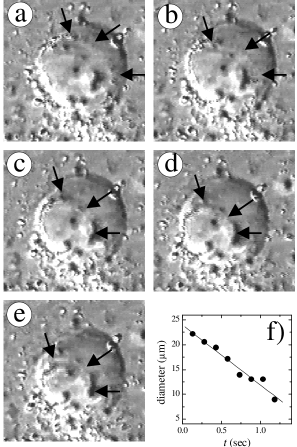
Finally, a careful inspection of the video-tapes allows individual peeling events to be identified. The series of micrographs in fig.7 shows several steps of one peeling event. In these pictures, a rim decorated by small aggregates is visualized, whose initial diameter is as large as the diameter of the MLV and which retracts with time until complete closure. The retraction lasts less than s and occurs as constant speed as can be shown from the plot of the radius of the rim as a function of time (fig.7f). We find . The closing of the rim marks the late stage of one peeling event that can be schematically described as follows: rupture of the outside bilayer, opening-up and growth of a hole until failure (i.e. detachment of the bilayer). Note that beyond the point when the diameter of the hole is larger than that of the MLV, the growth of the hole is visualized as the retraction (in a point diametrically opposed to the opening-up location) of the remaining bilayer. The retraction of the bilayer is visualized in fig.7. We note that we were not able to experimentally track the opening up of a hole which implies that this first stage must be much more rapid than the second stage observed experimentally.
A simple estimation of the size of the PE/surfactant complexes can be done, assuming that each peeled-off bilayer gives birth to one aggregate. The peeling of one bilayer of initial diameter releases a surface area , which will entirely be used to create a condensed aggregate. For the sake of simplicity, the aggregate is assumed to be a cube of side constituted of a perfectly lamellar structure with a periodicity equal to that measured by SAXS. Equalling the surface areas reads , hence . For the MLV shown in fig.4, at the beginning of the process (). One thus obtains , in good agreement with the size of the complexes measured in the vicinity of the MLV a few minutes later. This evaluation implies that no multiple pores are formed simultaneously on one given bilayer, which would result in smaller complexes. In addition, one would also expect the size of the complexes to decrease as the peeling proceeds since smaller surface of bilayer is available as the peeling progresses into the core of the MLV. However, testing this conjecture is difficult, in particular because, as mentioned above, all PE/surfactant complexes formed do not originate from the bilayers peeled-off from large MLVs but also from small surfactant assemblies, undetectable by light microscopy.
3.2 Discussion
3.2.1 Role of osmotic effects?
As a control experiment, we use the same experimental procedure but take a neutral polymer (polyoxyethylene with a molar weight of g/mol, at a concentration of in water) in place of the polyelectrolyte. When a MLV is put in contact with the neutral polymer solution, its size decreases with time, due to an osmotic de-swelling, but the MLV keeps a perfectly spherical shape all along the process and no aggregates form. The MLV size reductions measured when the MLV is in contact with a PE and a neutral polymer solutions are plotted in the inset of fig.5 and show in both cases a linear variation with time. The speed is however about faster for the PE than for the neutral polymer, although the neutral polymer concentration is higher and osmotic effects are thus expected to be higher. This ensures that osmotic effects are negligible in our observations. Instead, strong electrostatic, presumably coupled to hydrophobic, attractions between the surfactant bilayers and the PE are the driving force for the observed transition of the MLV.
3.2.2 Polyelectrolyte-induced pore formation and growth
Pore formation in unilamellar vesicles has been observed in different experimental conditions (application of an electric field [19, 20], interaction with an amphiphilic protein [21] or attractive interactions with a surface [22]). Pores are commonly assumed to be created above a critical surface tension for the membrane. Electrostatic-driven tension and rupture of a bilayer has been recently observed when a charged vesicle is immersed in a solution containing oppositely charged macroions such as very small vesicles or colloidal particles [23]. In Ref.[23], the tension results from the coating of the macroions by part of the lipid membrane. In our case, a very similar mechanism comes presumably into play. In fact, because of the attractive interactions between the PE and the surfactant bilayer, part of the surface area of the outside bilayer is used up to form PE/surfactant complexes. This creates a tension in the bilayer which ruptures above a critical tension, leading to the formation of a pore. Generally, the pore growth, stability, and closing result from a competition between the line tension (of the rim) and the surface tension of the membrane [24]. Pore growth is very often arrested as the surface tension relaxes because of the hole opening and due to the release of inner solvent in the outside medium. By contrast, in our case, the pore grows until failure because the surface tension cannot relax faster than the pore grows. This may be due to the combination of two effects: first, because of the continuous supply of PE, the surface tension continues to increase; secondly, owing to the fact the vesicle is multilamellar, the release of solvent requires the water to permeate through the dense stack of bilayers and is very slow, as inferred from the osmotic de-swelling experiment (inset fig.5). Examples on unilamellar copolymer vesicles where pores (formed by application an electric field) grow until failure can be found in Ref.[25]. We are not aware of experimental studies visualizing in real-time pore formation and growth in multilamellar systems. We point out nevertheless that a peeling mechanism has been invoked for the destabilization of liposomes in contact with a peptide [26] involving probably the same kind of mechanisms as the one proposed here but Ref.[26] does not provide clear experimental data nor detail investigation supporting a peeling mechanism.
Very often, when pores open in giant unilamellar vesicles, strong shape fluctuations due to thermal energy are observed (see for instance [23, 25]). In our experiments, the MLVs display pronounced shape changes as well, which shows that shape fluctuations, and pore opening and growth are intimately connected in multilamellar systems as well. This is surprising and indicates that cooperative effects involving a very large number of bilayers come into play. The rapid transitions between a strongly distorted MLV and a perfectly spherical one hint at the crucial role of surface tension which leads, in the absence of pores, the MLV to recover a spherical shape.
The pore growth at constant speed is puzzling. In fact, exponential growth has been observed experimentally with unilamellar vesicles, in agreement with theoretical predictions when friction in the bilayer dominates over viscous dissipation in the surrounding liquid [24]. By contrast, a linear growth is predicted in the opposite limit with a velocity where is the initial surface tension of the bilayer and is the viscosity of the liquid inside the vesicle. Using the velocity measured experimentally, and Pas as the viscosity of water, one obtains that the initial surface tension is of the order of N/m. This value is extremely small. Uncertainties may come from the evaluation of the viscosity . In fact, a much higher viscosity should be taken into account due to the packing of bilayers in the MLV which certainly increases the viscous dissipation.
4 Conclusions
We have studied mixtures of polyelectrolytes and bilayer-forming oppositely charged surfactants and have investigated the morphology and structures of the complexes formed when the two species are combined together. To better understand the dynamics for the formation of the surfactant/PE complexes, we have chosen a novel approach for real-time light microscope visualization of the interactions of individual mesoscopic surfactant self-assemblies (multilamellar vesicles) with PE solutions. We have shown that the PE provokes a peeling of the MLV and that complexes formed progressively through the peeling-off of the bilayers. Although real-time light microscopy is not a standard method in the field of associative precipitation of surfactant and polymers, it is frequently used with giant and unilamellar lipid vesicles. For instance, interactions between charged lipids and polyelectrolytes have been studied and have shown that the polyelectrolyte provokes endocytosis phenomena [27, 28]. Our experiment with MLVs exhibit a very different behavior. In general, when multilamellar vesicles are used, richer behaviors may be expected, since cooperative effects due to the dense packing of bilayers may play an important role.
Future work in this area should generate a more complete description of the dynamics of formation of polyelectrolyte/surfactant complexes and should address the role of kinetics and osmotic effects. Preliminary work in this direction shows more complex and intriguing behaviors when the PE concentration increases.
Acknowledgments. Discussions with M. In and G. Porte are greatly acknowledged. We thank P. Dieudonné for his assistance during the X-ray scattering experiments and L. Cipelletti for a critical reading of the manuscript.
References
- [1]
- [2] Kwak, J. C. T. (Editor) Polymer-Surfactant Systems, Surfactant Science series, 77; Marcel Dekker, New-York, 1998.
- [3] Thalberg, K.; Lindman, B. Interactions of Surfactants with Polymers and Proteins; Goddard, E. D., Ananthapadmanabhan, K. P., Eds.; CRC Press: Bocca Raton, FL, 1993; pp 203-276.
- [4] Kogej, K.; Evmenenko, G.; Theunissen, E.; Berghmans, H.; Reynaers, H. Langmuir 2001, 17, 3175.
- [5] Carnali, J. O. Langmuir 1993, 9, 2933.
- [6] Ilekti, P.; Piculell, L.; Tournilhac, F.; Cabane, B. J. Phys. Chem. B 1998, 102, 344.
- [7] Ilekti, P.; Martin, T.; Cabane, B.; Piculell, L.; J. Phys. Chem. B 1999, 103, 9831.
- [8] Akesson, T; Woodward, C. E.; Jönsson, B. J. Chem. Phys. 1989, 91, 2461.
- [9] Podgornik, K. J. Phys. Chem. 1991, 95, 5249.
- [10] Nizri, G.; Magdassi, S.; Schmidt, J.; Cohen, Y.; Talmon, Y. Langmuir 2004, 20, 4380.
- [11] Boltenhagen, P.; Lavrentovich, O. D.; Kléman, M. Phys. Rev. A 1992, 46, 1743.
- [12] Dubois, M.; Zemb, T. Langmuir 1991, 7, 1352.
- [13] Brotons, G.; Salditt., T.; Dubois, M.; Zemb, T. Langmuir 2003, 19, 8235.
- [14] Rädler, J. O.; Koltover, I.; Salditt, T.; Safinya, C. R. Science 1997, 275, 810.
- [15] Salditt, T.; Koltover, I.; Rädler, J. O.; Safinya, C. R. Phys. Rev. Lett. 1997, 79, 2582.
- [16] Bordi, F.; Cametti, C.; Diociaiuti, M.; Gaudino, D.; Gili, T.; Sennato, S. Langmuir 2004, 20, 5214.
- [17] We expect that the presence of glycerol does not modify the phase-diagram of the polyelectrolyte/surfactant mixture.
- [18] Takakura, K.; Sugawara, T. Langmuir 2004, 20, 3834.
- [19] Harbich, W.; Helfrich, W. Z. Naturforsch. 1979, 34a, 1063.
- [20] Zhelev, D. V.; Needham, D. Biochim. Biophys. Acta 1993, 1147, 89.
- [21] Saitoh, A.; Takiguchi, K.; Tanaka, Y.; Hotani, H. Proc. Natl. Acad. Sci. USA 1998, 95, 1026.
- [22] Bernard, A.-L.; Gueudeau-Boudeville, M.-A.; Palacin, S.; Di Meglio, J.-M.; Jullien, L. Langmuir 2000, 16, 6801.
- [23] Solon, J. PhD thesis, Paris VI (2004).
- [24] Sandre, O.; Moreaux, L.; Brochard-Wyart, F. Proc. Natl. Acad. Sci. USA 1999, 96, 10591.
- [25] Bermúdez, H.; Aranda-Espinoza, H.; Hammer, D. A.; Discher, D. E. Europhys. Lett. 2003, 64, 550.
- [26] Machida, S.; Niimi, S.; Shi, X.; Ando, Y.; Yu, Y. Biosci. Biotechnol. Biochem. 2000, 64, 985.
- [27] Angelova, M. I.; Hristova, N.; Tsoneva, I. Eur. Biophys. J. 1999, 28, 142.
- [28] Hristova, N. I.; Angelova, M. I.; Tsoneva, I. Bioelectrochemistry 2002, 58, 65.
- [29]