General Dynamics of Topology and Traffic on Weighted Technological Networks
Abstract
For most technical networks, the interplay of dynamics, traffic and topology is assumed crucial to their evolution. In this paper, we propose a traffic-driven evolution model of weighted technological networks. By introducing a general strength-coupling mechanism under which the traffic and topology mutually interact, the model gives power-law distributions of degree, weight and strength, as confirmed in many real networks. Particularly, depending on a parameter that controls the total weight growth of the system, the nontrivial clustering coefficient , degree assortativity coefficient and degree-strength correlation are all in consistence with empirical evidences.
pacs:
02.50.Le, 05.65.+b, 87.23.Ge, 87.23.KgThe past few years have witnessed a great devotion of physicists to understand and characterize the underlying mechanisms of complex networks including the Internet Internet , the WWW WWW , the scientific collaboration networks (SCN) CN1 ; CN2 and world-wide airport networks (WAN)air1 ; air2 . So far, researches on networks have mainly focused on unweighted graphs. Barabási and Albert have proposed a well-known model (BA model) that introduces the degree preferential attachment mechanism to mimic unweighted growing networks BA . Most recently, the availability of more complete empirical data has allowed scientists to consider the variation of the weights of links that reflect the physical characteristics of many real networks. Obviously, there is a need for a modelling approach to complex networks that goes beyond the purely topological point of view. Alain Barrat, et al. presented a model (BBV model) that integrates the topology and weight dynamical evolution to study the growth of weighted networks BBV . Their model yields scale-free properties of the degree, weight and strength distributions, controlled by an introduced parameter . However, its weight dynamical evolution is triggered only by newly added vertices, resulting in few satisfying interpretions to the collaboration networks or the airport systems. In fact, the dynamics and properties of social and technological networks are quite different and should be addressed individually. It is well-known that networks are not only specified by their topology but also by the dynamics of weight (e.g. information flow) taking place along the links. For instance, the heterogeneity in the intensity of connections may be very important in understanding technological systems. The amount of traffic characterizing the connections of communication systems or large transport infrastructure is fundamental for a full description of these networks top10 . Take the WAN for example: each given edge weight (traffic) is the number of available seats on direct flight connections between the airports and . Weighted networks are often described by an adjacency matrix which represents the weight on the edge connecting vertices and , with , where is the size of the network. We will only consider undirected graphs, where the weights are symmetric (). As confirmed by measurements, complex networks often exhibit a scale-free degree distribution with 23 air1 ; air2 . The weight distribution that any given edge has weight is another significant characterization of weighted networks, and it is found to be heavy tailed, spanning several orders of magnitude ref1 . A natural generalization of connectivity in the case of weighted networks is the vertex strength described as , where the sum runs over the set of neighbors of node . The strength of a vertex integrates the information about its connectivity and the weights of its links. For instance, the strength in WAN provides the actual traffic going through a vertex and is obvious measure of the size and importance of each airport. Empirical evidence indicates that in most cases the strength distribution has a fat tail air2 , similar to the power law of degree distribution. Highly correlated with the degree, the strength usually displays scale-free property traffic-driven ; empirical .
The previous models of complex networks always incorporate the (degree or strength) preferential attachment mechanism, which may result in scale-free properties. Essentially, this mechanism just describes interactions between the newly-added node and the old ones. Actually, such interactions also exist between old nodes. Perhaps, the most reasonable and simplest way to express such interactions is by the product form of related vertex strengths, i.e. the pairwise interaction between vertices and is proportional to (strength coupling form). Let’s review BA model: a new vertex is added with edges that are randomly attached to an existing vertex according to the degree preferential probability, which can be written in the product form of degrees
| (1) |
Analogously, in BBV networks one can rewrite the strength preferential probability:
| (2) |
We argue that such interactions (actually driven by traffic) exist between old vertices in the same way, and will considerably affect the flows between them: First, new edges should be allowed to add between old nodes; second, the pre-existing traffic flows along the links will be updated with the growth of networks. Indeed, physical interaction of nodes plays a crucial role in determining the network topology during its dynamical evolution. Our above perspectives have been partly inspired by the work of Dorogovtsev and Mendes (DM) DM who proposed a class of undirected and unweighted models where new edges are added between old sites (internal edges) and existing edges can be removed (edge removal).
In the letter, we present a model for weighted technological networks that considers the topological evolution under the general traffic-driven interactions of vertices. It can mimic the reinforcement of internal connections and the evolution of many infrastructure networks. The diversity of scale-free characteristics, nontrivial clustering coefficient, assortativity coefficient and strength-degree correlation that have been empirically observed can be well explained by our microscopic mechanisms. Moreover, in contrast with previous models where weights are assigned statically ref2 ; ref3 or rearranged locally (BBV model), we allow the flows to be widely updated.
The model starts from an initial configuration of vertices connected by links with assigned weight . The model is defined on two coupled mechanisms: the topological growth and the strengths’ dynamics:
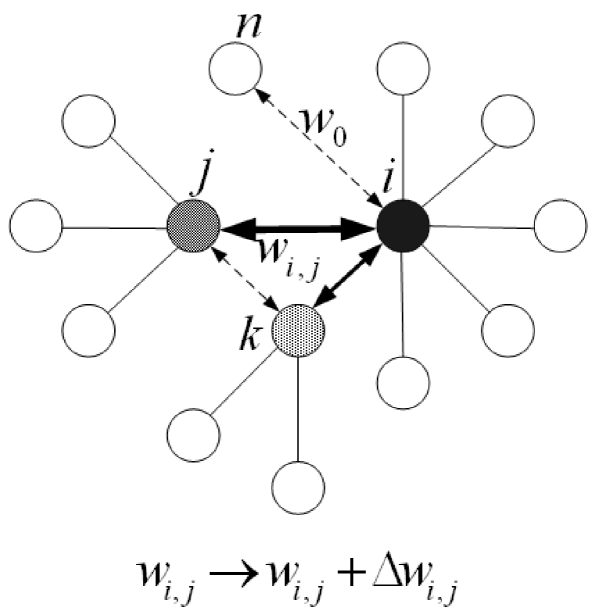
(i)Strengths’ Dynamics. From the beginning of the evolution, all the possible (existing or not) connections at each time step are supposed to update their weights according to the strength-coupling mechanism:
| (3) |
where
| (4) |
integrates the strength coupling of vertices and , and determines the increment probability of weight (if and are unconnected, ). The total weight of the edges in statistical sense is modified by the amount , which is assumed constant for simplicity. This parameter reflects the growing speed of the network’s total traffic load; for instance, the increasing rate of total information flow in a communication system. The always growing traffic plays the driving role in network evolution. One may notice that is very likely to exceed one if the initial number of nodes is small. When exceeds one, it is automatically assumed to be one. This treatment of will probably affect the initial network evolution, while it is not significant for discussing the statistical measures, as they are almost independent of initial states.
(ii)Topological Growth. At the same time step, a new vertex is then added with edges that are randomly attached to an existing vertex according to the strength preferential probability (Eq. (2)). The weight of each new edge is also fixed to . In fact, the strength preferential attachemnt is essentially the same with the mechanism traffic-driven interactions we have argued.
The network provides the substrate on which numerous dynamical processes occur. In previous models, traffic was often assumed just as an appendix to the network structure. Actually, traffic and the underlying topology are mutually correlated and it is very important to define appropriate quantities and measures capable of capturing how all these ingredients participate in the formation of complex networks top10 . Technology networks provide large empirical database that simultaneously captures the topology and the dynamics taking place on it. For Internet, the information traffic between routers (nodes) can be represented by the corresponding edge weight. The total traffic that each router deals with can be denoted by the node strength, which also represents the importance of given router. The increasing information flow as an internal demand always spurs the expansion of technological networks. Specifically, the largest contribution to the growth is given by the emergence of links between already existing nodes. This clearly points out that the Internet growth is strongly driven by the need of a redundancy wiring and an increasing need of available bandwidth for data transmission empirical . On one end, newly-built links (between existing routers) are supposed to preferentially connect high strength routers, because otherwise, it would lead to the unnecessary traffic congestion along indirect paths that connect those high strength nodes. Naturally, traffic along existing links between high strength routers, in general, increases faster than that between low strength routers. All the points are reflected in our strength-coupling mechanism. On the other end, new routers preferentially connect to routers with larger bandwidth and traffic handling capabilities (the strength driven attachment). Those phenomena also exist in airport system, power grid, and railroad network; and they could be explained by the traffic-driven mechanism of our model. For power grid and railroad network, the cost by distance has a distinct effect to their topological properties. Their degree distributions, for example, are not scale-free. In a word, topology and traffic interact with each other in networks under general interactions of vertices driven by the internal increasing traffic demand.
The model time is measured with respect to the number of nodes added to the graph, i.e. , and the natural time scale of the model dynamics is the network size . In response to the demand of increasing traffic, the system must expand. With a certain size, one technological network assumably has a certain ability to handle certain traffic load. Therefore, it could be reasonable to suppose that the total weight on the networks increases synchronously by the natural time scale. That is why we assume as a constant. This assumption also bring us the convenience of analytical discussion. Using the continuous approximation, we can treat , , and the time as continuous variables Internet ; BA . Then Eq. (3) indicates:
| (5) |
The strength of vertex can increase either if a new-added node connects to by the topological growth dynamics or any possible (exsiting or not) connections to are updated by the strengths’ dynamics:
| (6) |
where the last expressions recovered by noticing that . From Eq. (6), one can analytically obtain the power-law distribution of strength () with the exponent BA ; BBV : . Obviously, when the model is topologically equivalent to the BA network and the value is recovered. For larger values of , the distribution is gradually broader with when .
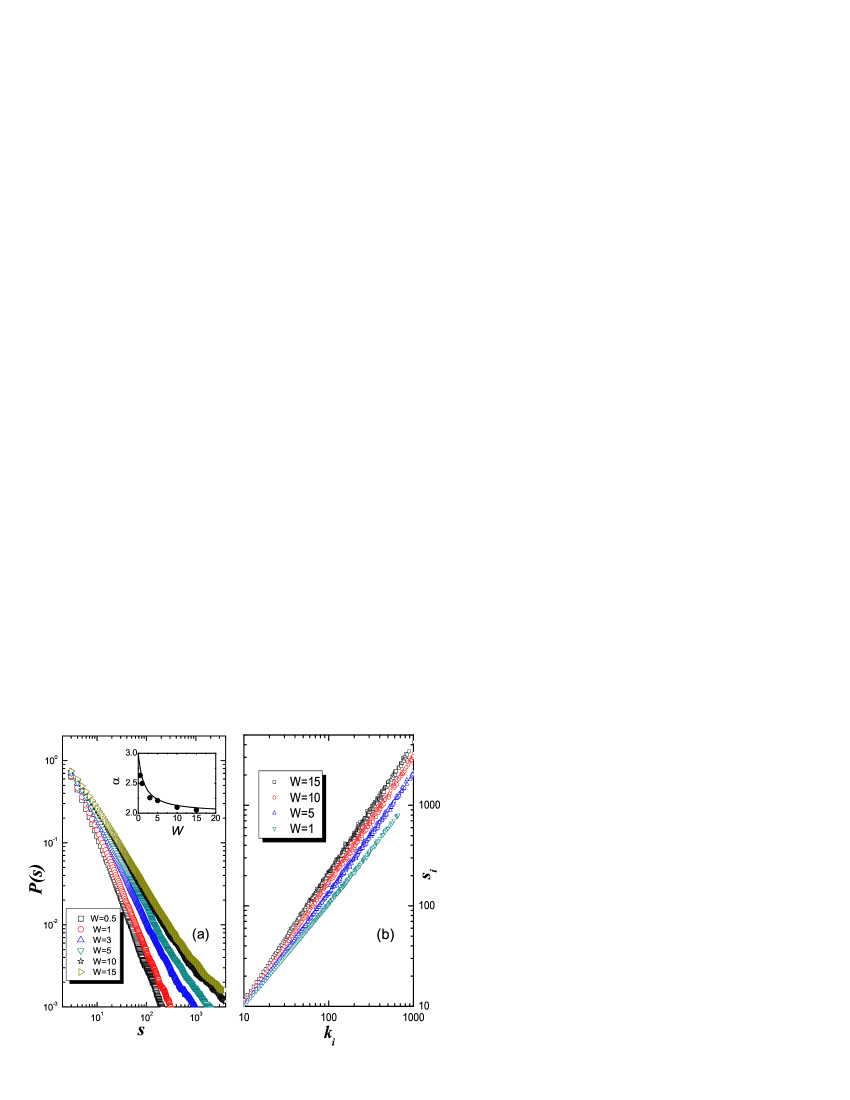
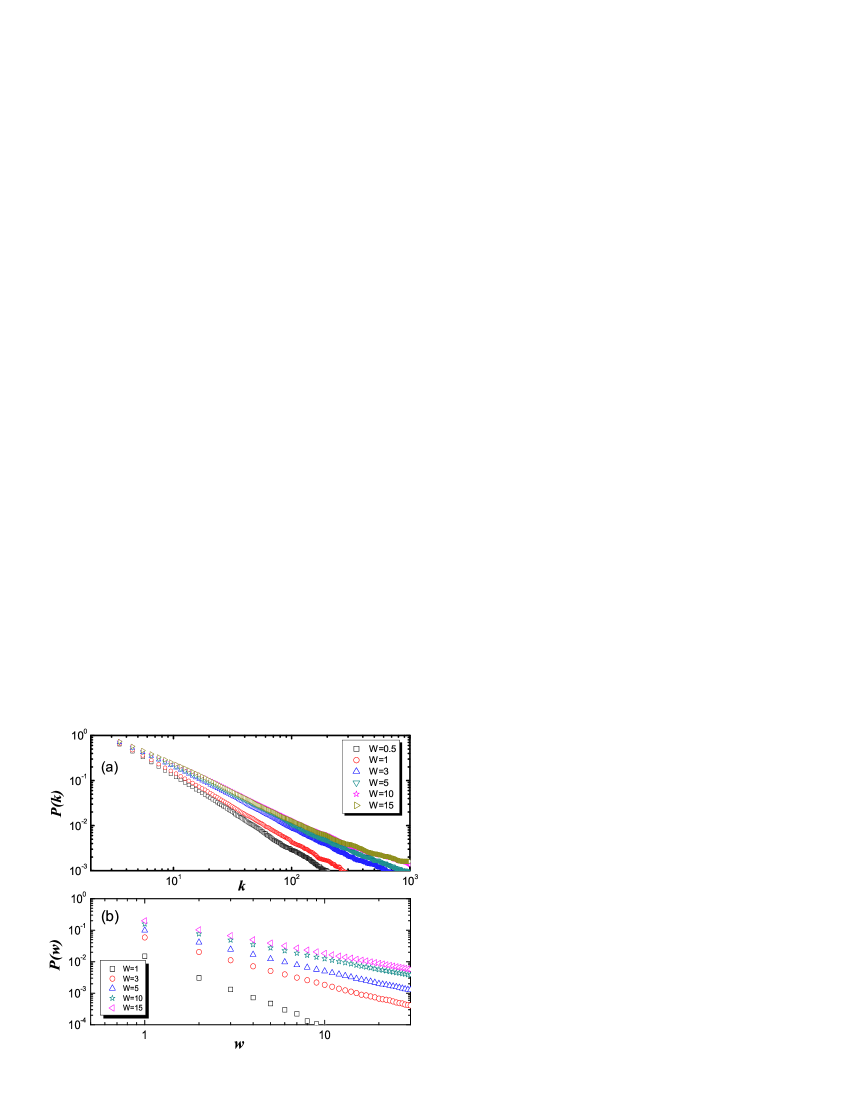
We performed numerical simulations of networks generated by choosing different values of and fixing , and . We have checked that the scale-free properties of our model networks are almost independent of the initial conditions. Numerical simulations are consistent with our theoretical predictions, verifying again the reliability of our present results. Fig. 2(a) gives the probability distribution , which is in good agreement with the theoretical predictions. We also report the average strength of vertices with degree , which displays a nontrivial power-law behavior as confirmed by empirical measurement. Unlike BBV networks (where ), the exponent here varies with the parameter in a nontrivial way as shown in Fig. 2(b). Moreover, the major difference between our model and DM network is reflected in the strength-degree correlation graph. Though DM model allows the emergence of internal edges, it could not mimic the reinforcement of pre-existing connections in that it is unweighted. The nontrivial correlation demonstrates the significant part of weight increment along existing edges, and thus implies that our model is reasonable in the light of traffic flow. More importantly, one could check the scale-free property of degree distribution () by combining with . Considering , the exponent is easily calculated: . The scale-free properties of weight and degree obtained from simulations are presented in Fig. 3(a)(b). Finally, it is worth remarking that for the BA networks, the clustering coefficient is nearly zero, far from the practical nets that exhibit a variety of small-world properties. In the present model, however, clustering coefficient is found to be a function of (Fig. 4(a)), also supported by empirical data of a broad range.
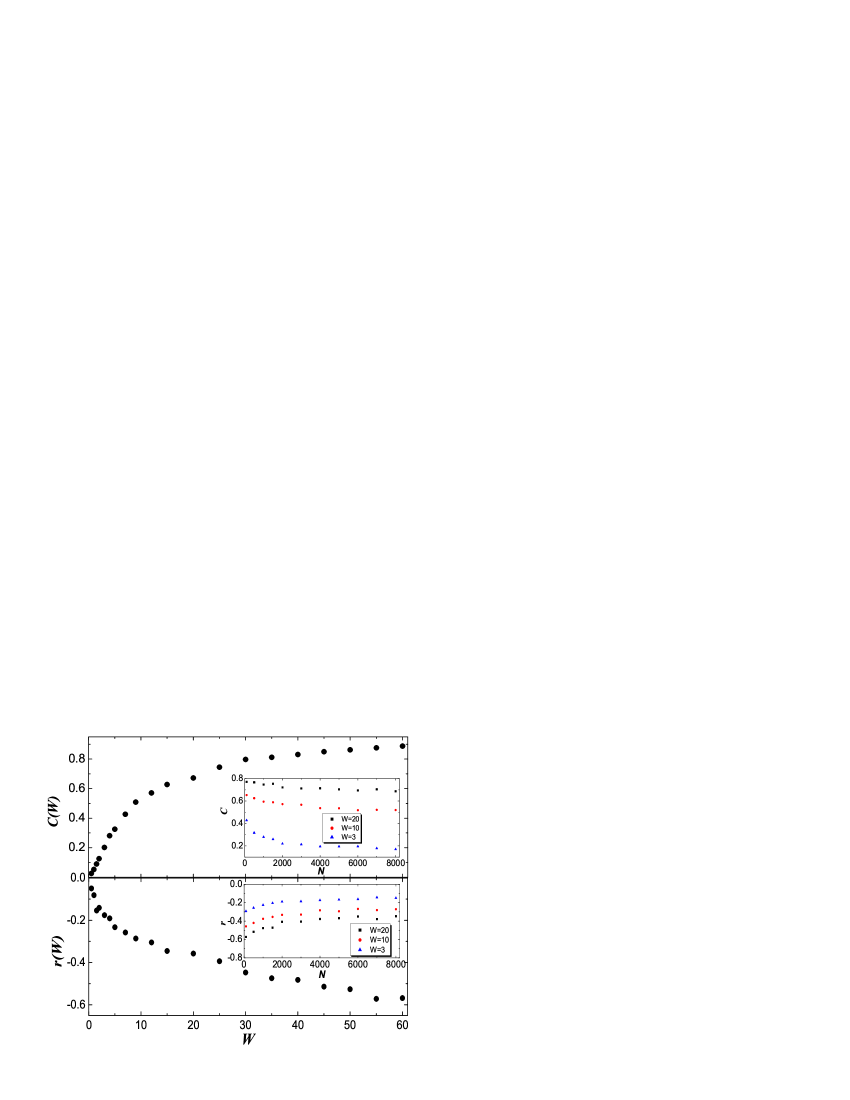
In the social networks, connections between people may be assortative by language or by race. Mixing can also be disassortative, i.e. vertices in the network preferentially form connections to others unlike them. Newman proposed some simple measures for these types of mixing, which we call assortativity coefficients mixing . In the case of mixing by vertex degree, a remarkable pattern emerges. Almost all the social networks studied show positive assortativity coefficients while all others, including technological and biological networks, show negative coefficients. It is not clear if this is a universal property; the origin of this difference is not understood either. In our views, it represents a feature that should be addressed in each network individually. We argue that the adaptive evolution of topology in response to the increasing traffic is the major cause of disassortative mixing of technological networks. Using the formula defined in Ref. mixing (Eq. (26)), we calculate the degree assortativity coefficient (or degree-degree correlation) of the graphs generated by our model. Simulations given in the Fig. 4(b) are supported by empirical measurements mixing . The restriction of our model to technological networks is for that there are few empirical data for statistical analysis on “weighted” biological networks, where many interacting mechanisms are far from present knowledge either. But hopefully, our model may be very beneficial for future understanding or characterizing biological networks and social ones, as it generates many topological properties observed in those real networks. Due to its apparent simplicity and the variety of controllable results, we believe that some of its extensions will probably help address the other two classes of networks.
In conclusion, the universal interactions of nodes and internal traffic demand of the system will determine the topology evolution of technological network. This general traffic-driven mechanism provides a wide variety of scale-free behaviors, clustering coefficient and nontrivial correlations, depending on the parameter that governs the total weight growth. All the results are supported by empirical data. Therefore, our present model for all practical purposes will demonstrate its applications in future weighted network research.
We gratefully thank Yan-Bo Xie and Tao Zhou for useful discussion. This work is funded by NNSFC under Grant No. 10472116 and No. 70271070.
References
- (1) R. Pastor-Satorras and A. Vespignani, Evolution and Structure of the Internet: A Statistical Physics Approach (Cambridge University Press, Cambridge, England, 2004).
- (2) R. Albert, H. Jeong, and A.-L. Barabási, Nature 401, 130 (1999).
- (3) M.E.J. Newman, Phys. Rev. E 64, 016132 (2001).
- (4) A.-L. Barabási, H. Jeong, Z. Néda. E. Ravasz, A. Schubert, and T. Vicsek, Physica (Amsterdam) 311A, 590 (2002).
- (5) R. Guimera, S. Mossa, A. Turtschi, and L.A.N Amearal, cond-mat/0312535.
- (6) A. Barrat, M. Barthélemy, R. Pastor-Satorras, and A. Vespignani, Proc. Natl. Acad. Sci. U.S.A. 101, 3747 (2004).
- (7) R. Albert and A.-L. Barabási, Rev. Mod. Phys. 74, 47 (2002).
- (8) A. Barrat, M. Barthélemy, and A. Vespignani, Phys. Rev. Lett. 92, 228701 (2004).
- (9) Virtual Round Tabel on ten leading questions for network research, L.A.N. Amaral, A. Barrat, A.L. Barabasi, et al. Eur. Phys. J. B 38, 143-145 (2004).
- (10) C. Li and G. Chen, cond-mat/0309236.
- (11) K.-I. Goh, B. Kahng, and D. Kim, cond-mat/0410078 (2004).
- (12) R. Pastor-Satorras, A. Vázquez, and A. Vespignani, cond-mat/0105161 (2002).
- (13) S.N. Dorogovtsev and J.F.F. Mendes, Europhys. Lett. 50, 33 (2000).
- (14) S.H. Yook, H. Jeong, A.-L. Barabási, and Y. Tu, Phys. Rev. Lett. 86, 5835 (2001).
- (15) D. Zheng, S. Trimper, B. Zheng, and P.M. Hui, Phys. Rev. E 67, 040102 (2003).
- (16) M. E. J. Newman, Phys. Rev. E 67, 026126 (2003).