Thermomodulation studies of heat transport in heavy-doped n-GaAs by using the temperature dependence of metal-semiconductor contact resistance
Abstract
The heat transport in heavy-doped n-GaAs has been investigated at temperatures K and K using the irradiation of the metal-semiconductor contact by modulated CO2-laser radiation. It is shown this approach giving an opportunity to determine the thermo-diffusion coefficient and Seebeck coefficient without direct measurements of the temperature gradient. It was also found out that the thermalization length of hot electrons exceeds in of order of magnitude the assessment which can be done based on the reference data for GaAs. To elucidate the origin of the observed phenomenon the measurements were conducted out with Schottky contacts made on the thin doped GaAs layer epitaxially grown on the semi-insulating GaAs substrate. In this case the degenerate electron gas occupies only insignificant part of the heat-conducting medium. In addition, the injection of hot electrons into the semiconductor by current pulses through the Schottky barrier was used to clear up whether there is a dependence of the effect on the method of the electron heating. The nonequilibrium of LO-phonons and the change in the electron-phonon collisional integral due to the non-equilibrium pair correlations of the electrons are suggested as a possible explanation. 111Presented in part on 13th International Conference ”Nonequilibrium Carrier Dynamics in Semiconductors” (HCIS-13), Modena, Italy, 2003 and 6th Russian Semiconductor Physics Conference, S-Peterburg, 2003
1 Experiment and data handling
The frequency dependence of thermal response of the degenerate electron gas in GaAs (the Fermi energy meV) has been studied at spatially-nonuniform heating. The surplus energy of the electron gas was produced by free carriers absorption of chopped - laser radiation (see Fig.1).
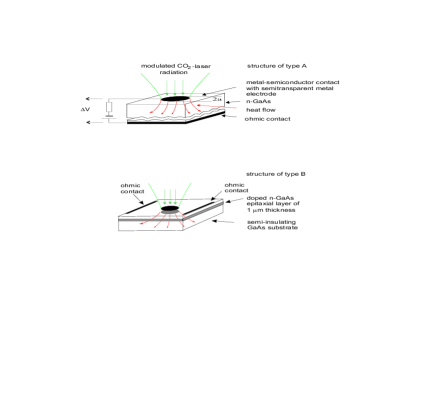
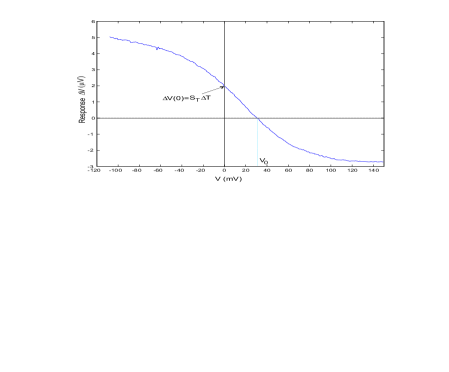
The opposite side of the sample was held at the equilibrium temperature. The change in the electron temperature close to the metal-semiconductor interface led to change in the metal-semiconductor tunnel junction resistance and to the nascent thermoelectromotive voltage. The plot in Fig.2 demonstrates the dependence of the response on the voltage bias measured by phase-sensitive detector. At the response is the sole thermoelectromotive signal. At the response is the sum of the thermo-e.m.f. and the change in the in the case of non-zero current through the junction due to the temperature dependence of the junction resistance .
1.1 Bias dependence of thermoresponse and determination of Seebeck coefficient
Such an experimental setup allows us to suggest a simple way of measurement of the Seebeck coefficient for the degenerate electron gas in the heavy-doped semiconductor when the standard methods give a large spread of values (see e.g. [1]). A simple circuit small-signal analysis with the current-driven junction gives the condition for the bias where :
| (1) |
Here is the temperature difference averaged over the metal contact area. Evidently, it is possible to determine from Eq.(1) without measuring. All other quantities involved in this relation characterize the junction itself and can be easily measured. As an example, the value of mV presented in the Fig.1 being combined with the value of K-1 gives V/K in good agreement with the value expected for the indicated electron density and temperature. In fact, the derivation of Eq.(1) is based on the potentiality of the temperature- and Coulomb fields and on the constancy of the Coulomb potential along all metal contacts including ohmic ones [2]. This allows to prove the Eq.(1) is independent of geometry of the current and heat flows in the samples as long as the junction resistance is much greater than the bulk resistance of the substrate. Therefore, both type of the structures shown in Fig.1 have been suitable for that sort of measurements.
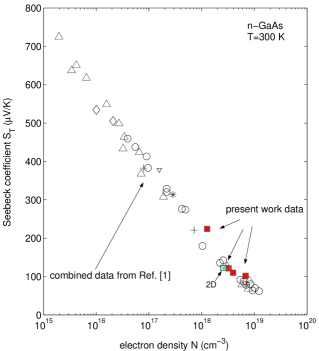
The Seebeck coefficients for several structures with various values of electron density measured by this technique are presented in the Table and compared with known data in Fig.3.
Table. Parameters of structures and respective Seebeck
coefficients
preparation
structure
,
,
, K∘
technology
type
1018cm-3
KOhm
10K∘
mV
V/K∘
(F=600 Hz)
MOCVD
B
1.27
124.0
-6.49
34.4
-223
0,03
MBE
B
3.25
0.945
-17.8
6.8
-121
0,07
MBE
B
3.95
5.590
-11.1
9.93
-110
0,06
zone-melting
A
6.80
0.004
-7.64
13.4
-102
0,11
MBE
B
2.60222Equivalent volume density of 2D electrons with
cm-2 in -doped layer of order of nm
width.
7.480
-6.38
19.2
-123
0,03
1.2 Modulation frequency dependence of thermoresponse and determination of hot-electron thermalization length
The measured frequency dependences of the thermoresponse for three junctions at two ambient temperatures are shown in Fig.4 by markers. The curves 1-3 were measured with the same junction made on the bulk-doped GaAs substrate. The curves 4 and 5 were measured with the junctions made on the epitaxially-doped side of the semi-insulating GaAs substrate. The thicknesses of the substrates varied in the mm range. The thickness of the doped epi-layer of the sample for curve 4 was about m. The junction relating to the curve 5 was formed by surface-deposited metal film and 2D electron gas in the -doped channel placed at the nm distance from the semiconductor surface.
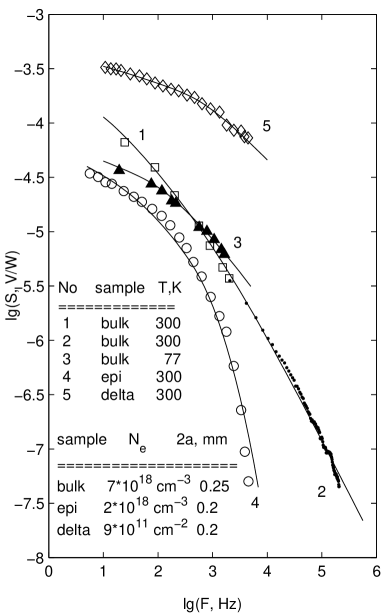
It is noticeably that curves 4 and 5 show more slow-down behavior than the curve 1 as a function of the modulation frequency in the low-frequency region up to Hz. In fact, this dependence is closer to for the curve 4 and 5 and to for the curve 1. More quantitative comparison of the measured curves with the heat transport theory has been carried out on the base of the theoretical analysis presented in [4].
For the sake of simplicity of the discussion let us consider the corresponding expression for the response which takes into account all essential details of the measurements but the finite thickness of the substrate:
| (2) |
Certainly, the real calculations have been conducted with the full more complicated formula. Here is the power of the incident radiation beam, , is the radiation reflection coefficient, is the radius of the metal contact, is the dispersion of the Gaussian distribution of the radiation power across the beam in the focal spot, is the distance along the sample surface between the centre of the metal contact and the focal spot, is the semiconductor heat conductivity and is the free carrier absorption coefficient. In the case of heat transport in homogeneous medium the quantity is the root of dispersion equation. At the real the plays the role of the wavelength and the is the attenuation length of the heat wave.
For the inhomogeneous heating under consideration the frequency dependence of the right-hand side of Eq.(2) at is determined an interrelation between and reminder of the scale parameters . The case must be considered separately.
The qualitative analysis of the expression (2) as a function of with account for the actual limitation of the integration region by the damping exponential- or oscillating Bessel function (or both) in the integrand shows that at factual values of parameters and of order m and of order of m the response must down as in the range of Hz Hz and transforms to law at higher frequencies. All these estimations are made at K and reference value of the thermodiffusion coefficient cm2/s obtained from thermoconductivity Wcm-1K-1 and heat capacity Jcm-3K-1of GaAs given in [3] and [5]. Respective values for K are Wcm-1K Jcm-3K cm2/s .
The observed behavior of the curve 1-3 in Fig.4 is evidently in contradiction with the reasoning presented above and exact computations of Eq.(2) support this evidence. Since the experimental data is represented in the form of amplitude of oscillating response, the thin theoretical curves in Fig.4 represents the absolute value of the Eq.(2). The fitted solid curves show results of calculations with optimal values of the thermodiffusivity coefficient and the reference values [1, 3] of the radiation absorption coefficient . 1-2: cm2/s, cm-1, 3: cm2/s, cm-1. The theoretical curves 4 and 5 were calculated at the reference values of cm2/s and cm-1. These results prove that the response of the samples where degenerate electron gas occupies only small part of the substrate volume can be described with the standard value of the thermodiffusivity . Otherwise (curves 1-3), the values of were needed to decrease in 10 times. The very sharp drop of the curve 4 in the high-frequency tail is the result of large displacement (m) between the centers of the focused laser beam (m) and the metal electrode. Such a kind of measurements allows to determine directly disregarding uncertainties of other parameters involved as it will farther be explained.
By inspecting of Fig.4 one can see that exact calculations of Eq.(2) with the indicated reference values of the parameters and enable to describe the measured frequency dependence for the junctions on the epitaxially-grown substrates only (curves 4 and 5). Just in this case the heat transport passes mainly through the part of the semiconductor substrate that is free of electrons. In the other case, presented by curves 1-3, the used values of were reduced in 10 times to reach an agreement with experimental data under all measurement conditions. Almost the same results can be obtained with the reference values of and reduced in 10 times . The meaning of this interchangeability will be discussed later. It follows that just the electronic constituent is responsible for the anomalous heat propagation in the semiconductor.
To check if the observed effect depends on the way of the electron heating, the pulsed current heating at the reverse- and the forward polarities was realized by specially designed switching electronic circuit. The circuit enabled to measure the thermoresponse signal of order of nV in s after the voltage pulse of V magnitude was supplied, in spite of the large capacitance nF of the investigated junctions. The time-dependent pulsed response measured by the boxcar integrator was converted then in the frequency domain using digital Fourier transformation.
It turn out that frequency dependences obtained at the reverse and forward pulsed bias are different. At the forward bias the non-equilibrium electrons were generated inside the metal film and the emitted phonons only were primary mechanism for the heat transport into the semiconductor. In that case, the calculated frequency dependence of the response manifested drop-down behavior up to several hundred kHz corresponding to the near-surface heat generation and the normally expected lattice heat transport into the semiconductor. At the reverse bias electrons were injected across the Schottky barrier from the metal electrode into the semiconductor with kinetic energy about eV above Fermi level and produced highly non-equilibrium state of the electron gas due to intensive electron-electron collisions. That is the Joule heat was directly scattered inside the electron gas of the semiconductor. The respective frequency dependence shows the main sign of the abnormal heat transport, e.g., the fall off more sharp then beginning from several hundred Hz.
In principle, the thermoresponse can fall off with the frequency more quickly then even under the normal heat transport conditions as it is seen from the experimental and calculated curves 4 in Fig.4. That case takes place for , i.e., when there is a distance between the centers of the metal electrode and the focal spot. Surely, this behavior is contained in the Eq.(2) and can be explained on that ground. However, there is a simpler way to understanding that gives us also some practically useful means. The solution of the heat conductivity equation far away the excitation region has the asymptotic form like . Taking into account the definition of given above it is easy to obtain the dependence of the response on the frequency at constant in the form
| (3) |
Accordingly to this expression there is the linear dependence of on . That dependence can be applied to the determination of without any reference to the junction (heat detector) characteristics and irradiation conditions excluding the distance . The application of the claimed method to the curve 4 results in the value of cm2/s in a good agreement with the adopted value cm2/s.
2 Discussion
The observed anomalous frequency dependence of the thermal response can be related either to a diminution of an effective thermal diffusivity in the system of electrons + LO-phonons + acoustic phonons or to a real increasing of the size of the region where the thermalization of the nonequilibrium electron - LO-phonon subsystem takes place owing to the interaction with the thermal bath of acoustic phonons. The investigated frequency band of the heating modulation is too low-frequency for one to expect diminution of the thermal diffusivity owing to the mechanism examined in [6]. The change in may be attributed either change in or in or in both. Since the heat conductivity appears in Eq.(2) in front of the integral besides we can use the absolute magnitude of the response to distinguish the contributions of and in the observed change of thermodiffusivity . The realization of this procedure shown that the main role in the change of belong to the heat capacitance, if this change does exist. The joint set of heat conductivity equations for the electrons, LO-phonons, and acoustic phonons analyzed in [4] allows supposing that the first case might be considered as the result from rising the contribution of the nonequilibrium electron - LO-phonon subsystem to the heat capacity of the semiconductor.
The second case may be taken into consideration because the calculated curves consist also with the measured data 1-3 for the bulk-doped sample in Fig.4 at thermodiffusivity cm2/s and cm2/s (reference values) and reduced radiation absorption coefficient cm-1 instead of cm-1. The value cm2/s has been confirmed by direct measurements of the thermoresponse as a function of the intercenter distance according to Eq.(3). The observed phenomenon can then be interpreted as a long-range tail effect in the spatial response of an inhomogeneous electron gas corresponding to the known long-time tail in the time response of spatially-homogeneous electron gas. As it is known, the latter is related with the nonequilibrium corrections to the pair correlation function of electrons. In [7] the expression for the electron energy loss rate via electron-phonon interaction was derived with explicitly found contribution of the nonequilibrium pair correlations. However, the role of this correction in the heat transport is unclear yet.
References
References
- [1] Gallium Arsenide. Making and properties. Editors F.P. Kesamanly and D.N. Nasledov. M., Nauka FM, 1973
- [2] A.Ya. Shul’man, to be published elsewhere
- [3] J.S. Blakemore, J. Appl. Phys. 53, R123 (1982)
- [4] A.Ya. Shul’man, Phys. Stat. Sol. (b), 204, 136 (1997)
- [5] P.I. Baransky, V.P. Klochkov and I.V. Potykevich, Semiconductor electronics. Handbook. Kyiv, Naukova Dumka, 1975.
- [6] S.G. Volz, Phys. Rev. Lett. 87, 074301 (2001)
- [7] A.Ya. Shul’man, Contribution of One-Time Pair Correlation Function to Kinetic Phenomena in Nonequilibrium Gas. In ”Progress in Nonequilibrium Green’s Functions-2”, ed. M. Bonitz and D. Semkat. World Scientific Publishing, Singapore, 2003, p.74