Localized microwave resonances in strained SrTiO3 thin films
Abstract
Local frequency-dependent polar dynamics of strained SrTiO3 films grown on DyScO3 are investigated using time-resolved confocal scanning optical microscopy. Spectroscopic information is obtained with m spatial resolution over the frequency range 2-4 GHz. Most of the DyScO3 film is found to be spatially homogeneous, in contrast to relaxed films. A strong correlation between spatial and spectral homogeneity is revealed. In addition, resonant structures are discovered that are localized both in space and in frequency.
pacs:
77.80.-e, 77.22.Gm, 85.50.-nUnderstanding the relationship between the polar structure and dynamic response of ferroelectrics is critical for the development of integrated devices. There are many factors which can produce dielectric dispersion in these systems. Some are intrinsic to the phase transition itself, while others depend on the existence of domain structures and their dispersive properties. Arlt et al. have predicted that stripe domain patterns in bulk BaTiO3 single crystals will produce strong dispersion in the GHz regime (Arlt and Böttger, 1994). Similarly, polar complexes observed in relaxor ferroelectrics have been identified by their characteristic frequency response (Viehland et al., 1992; Wakimoto et al., 2002). McNeal and coworkers have linked the domain state of BaTiO3 (by way of grain and particle size) with microwave resonances (McNeal et al., 1998). The relevant length scales for ferroelectrics span an unusually wide range, from the atomic (Drezner and Berger, 2003) to the crystal dimension itself (Pattnaik and Toulouse, 1997), and frequency responses can also span from quasi-dc ( Hz) (Dunn, 2003) to the ferroelectric soft mode ( Hz) (Vorobiev et al., 2004; Carlson et al., 2000). Understanding how polar structure at a given length scale relates to the dynamic response at a given frequency scale can shed light on basic issues for device fabrication such as the fundamental limitations for domain switching and mechanisms of microwave dielectric loss.
The dielectric constant of capacitors fabricated from ferroelectric thin films can be changed with modest applied DC voltages, making them suitable for tunable microwave devices such as phase shifters (Mueller et al., 2001) and filters (Findikoglu et al., 1996). A widely investigated material system is BaSrTiO, whose Curie temperature can be varied from nearly 0 K for pure SrTiO3 () to 400 K for pure BaTiO3 () (Lancaster et al., 1998). For thin films grown under most conditions, non-uniform strain as well as stoichiometry fluctuations can lead to an inhomogeneous broadening of over hundreds of degrees. The growth of high-quality ferroelectric films is complicated by a lack of suitably lattice matched substrates. Recently, bulk single crystals of DyScO3 have been synthesized and used to grow uniformly strained SrTiO3 films by molecular beam epitaxy (Haeni et al., 2000, 2004). The large biaxial tensile strain in this system results in ferroelectric behavior at room temperature (Haeni et al., 2004; Chang et al., 2004).
Here we describe local spectroscopic investigations of polar dynamics in a 500 ᅵ thick SrTiO3 film grown on DyScO3 (Haeni et al., 2004), We have developed an extension of time-resolved confocal scanning optical microscopy (TRCSOM) that enables local polar dynamics to be measured as a function of frequency as well as spatial location. Using the electro-optic response to reveal polar dynamics in the SrTiO3 film, we identify localized resonant features associated with the periodic domain boundaries. While the domain structure appears to be templated by the DyScO3 substrate, the existence of these resonant features represent the first direct experimental evidence linking microwave resonances to domain structures.
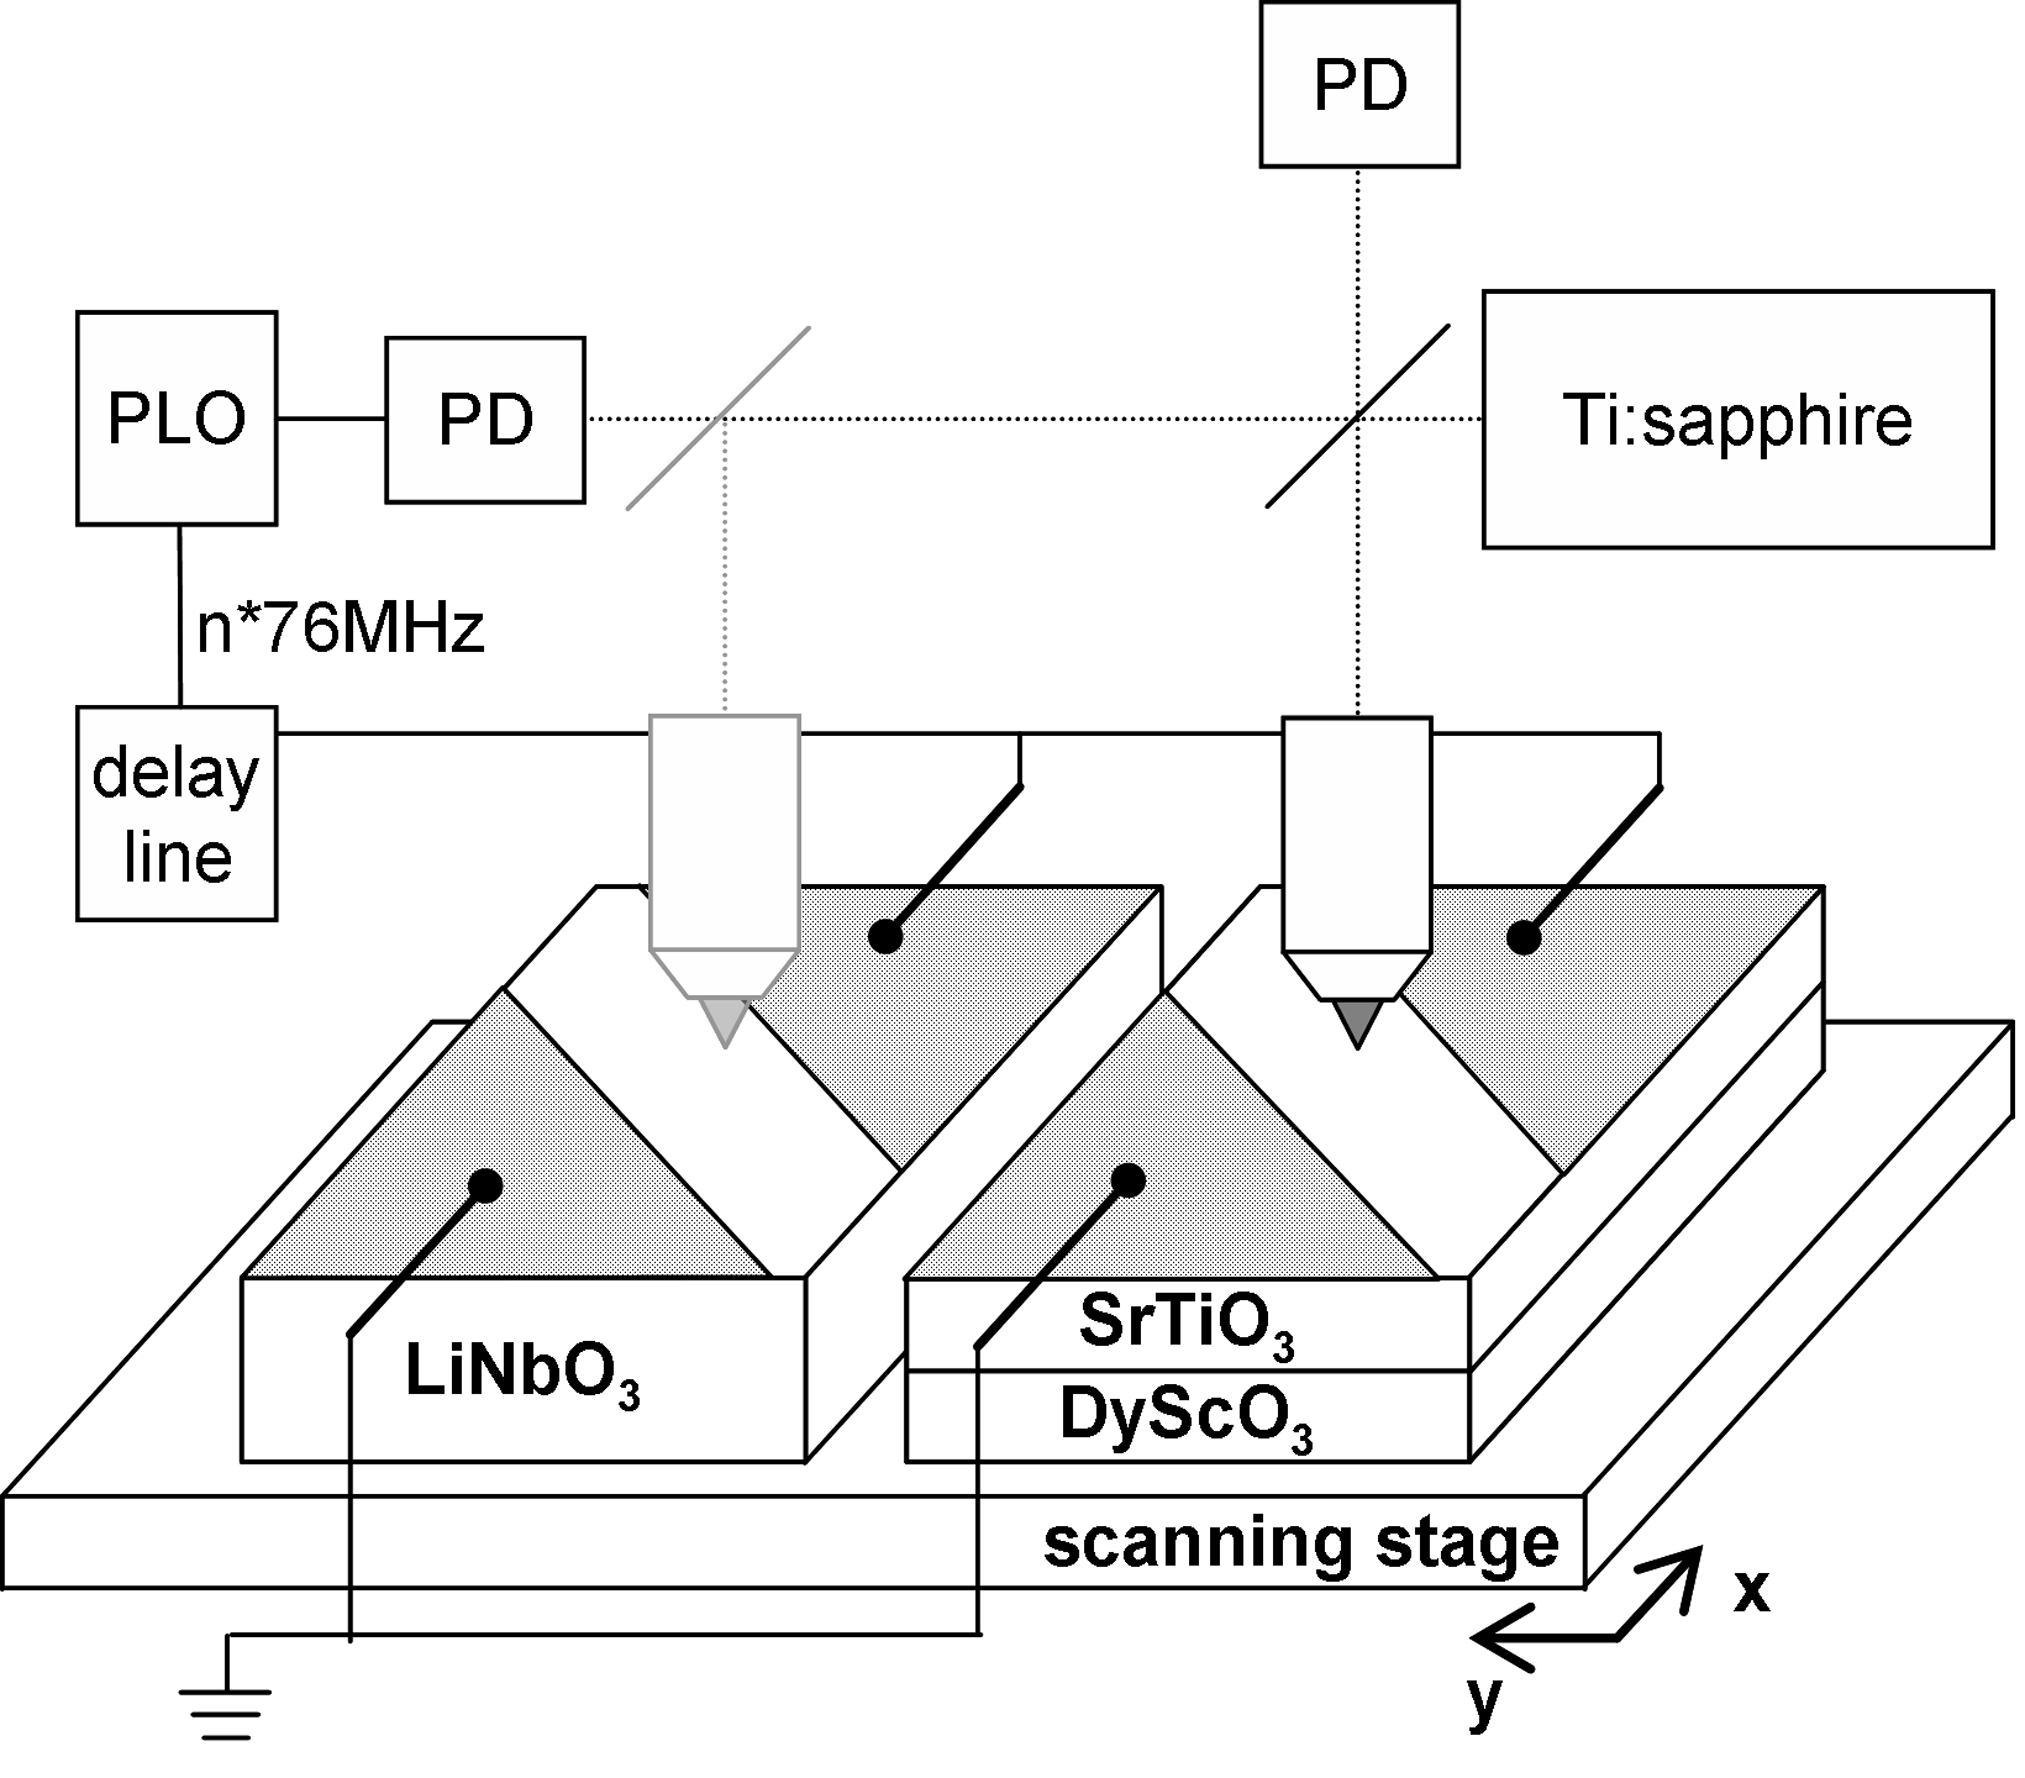
A schematic of the experiment is shown in Figure 1. An ultrafast ( fs) mode-locked Ti:sapphire laser is used to generate both the microwave electrical “pump” field and the optical probe pulse. The microwave pump signal is derived from a phase-locked oscillator (PLO) that is locked to a high harmonic of the repetition rate of the laser, 76 MHz. The electrical signal is applied to the SrTiO3 film using Ag interdigitated electrodes deposited on the film surface (gap width µm), and are oriented parallel to the <100> STO direction. Details about sample preparation can be found elsewhere (Haeni et al., 2000, 2004). The laser pulses, focused to a diffraction-limited spot using a microscope objective (), probe the electro-optic response at a fixed phase of the microwave signal. The relative phase between electrical and optical signals is controlled using an electrical delay line. The amplitude of the microwave field is modulated at a low frequency ( kHz) and the resulting electrooptic signal is detected using an optical bridge and lock-in amplifier (Hubert and Levy, 1999). The reflected polarization of the laser light probes the electrooptic response. The temporal response provides direct information about local polar contributions to the microwave permittivity of the film (Hubert et al., 1997).
TRCSOM images are acquired by raster scanning the sample relative to the laser spot. Images are taken at ten different time delays td (step size ps) for 27 different microwave frequencies , , spanning the range 2-4 GHz. An entire scan of frequencies, time delays, and spatial locations takes approximately 12 hours to complete; thermal control of the TRCSOM apparatus is maintained to within K in order to stabilize the images sufficiently. The experiment is preformed at room temperature (295 K), which is above in this sample. Post-processing of the images is also performed to account for residual drift over the acquisition period.
There is no intrinsic method for defining the absolute phase of the incident microwave field relative to the optical probe, and the measured phase changes in an uncontrolled way from one microwave frequency to another. To produce a stable reference phase, TRCSOM measurements were taken under identical conditions are taken on a single-crystal LiNbO3 reference sample, located several mm away from and connected in parallel with the SrTiO3 film. The phase of the linear electro-optic response of the LiNbO3, assumed to be constant over the frequency range explored, is used to define a reference phase for the frequency-dependent SrTiO3 measurements.
The polar response of the SrTiO3 film is well described by Fourier components at angular driving frequency and second harmonic (Hubert et al., 2000):
At each driving frequency, the sequence of images at various time delays is used to produce a fit to Eq. 1 at each spatial location. The result is an image of each of the four Fourier coefficients, {, , ,}. This analysis is performed for each of the 27 discrete frequencies investigated.
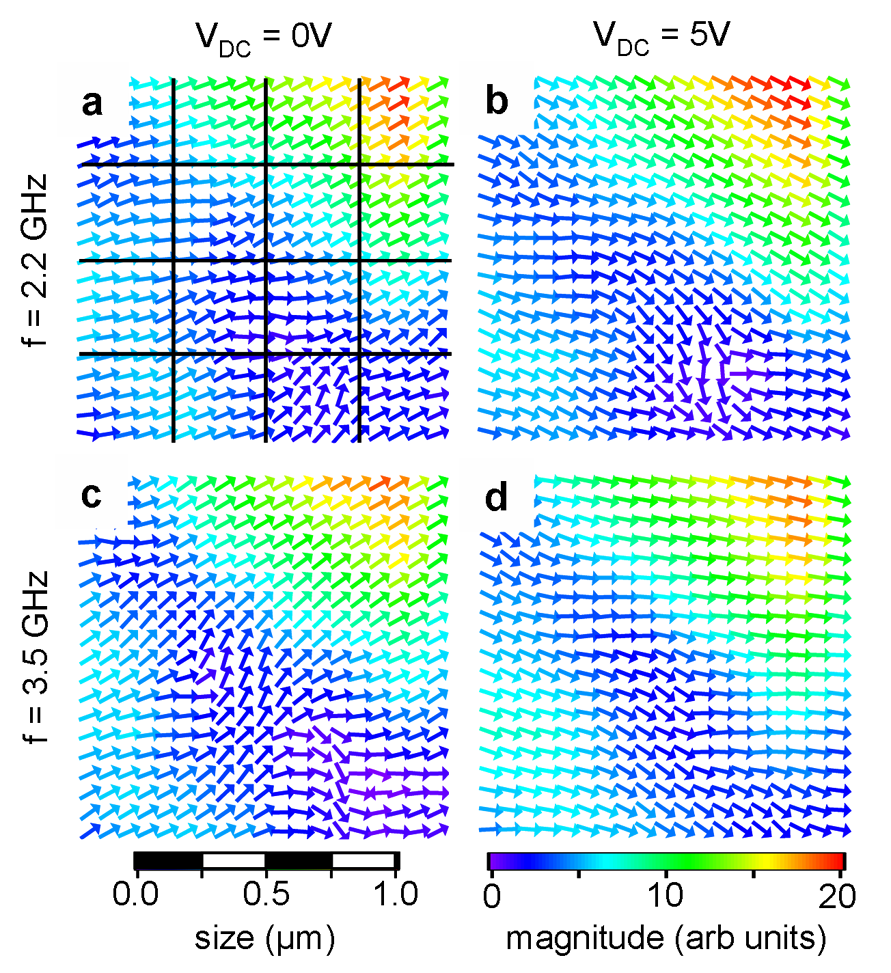
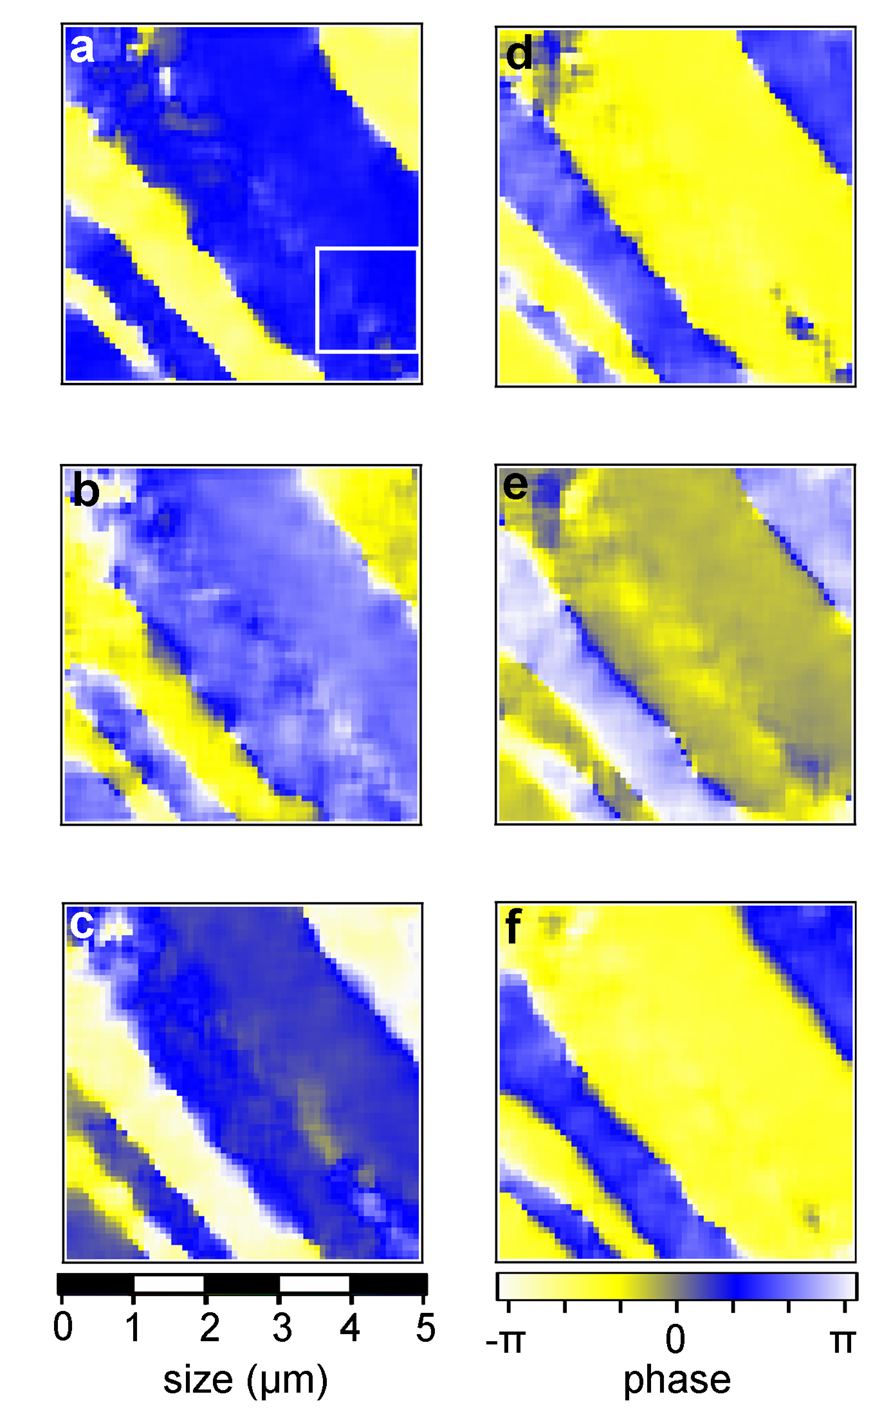
Figure 2 shows images of the phase at six representative driving frequencies. The large uniform regions visible in Figure 2 are characteristic of the high quality of the SrTiO3 film, and are observed only with uniformly strained samples grown on DyScO3 substrates (Haeni et al., 2004). The stripes correspond to regions that are responding uniformly over the entire frequency range investigated. Alternating stripes differ in phase by approximately , which is consistent with the existence of a domain wall boundary separating them. These domain boundary regions exhibit a microwave response that is much less uniform, and which exhibit dispersive behavior that is localized in space and in frequency.
To illustrate the ferroelectric response within domains and near the domain walls, we analyze subsections from the datasets shown in the boxed region in Figure 2(a). Figure 3 shows vector field plots of the linear electro-optic response at two microwave frequencies and two different dc bias voltages. Arrows are colored according to the magnitude of the response, while their direction indicates the local phase relative to the LiNbO3 single crystal. Regions of the sample that are far from the domain boundaries have a uniform response, irrespective of applied frequency or DC bias. However, select regions that are closer to the domain boundaries show significant local dispersion when a DC bias is applied.
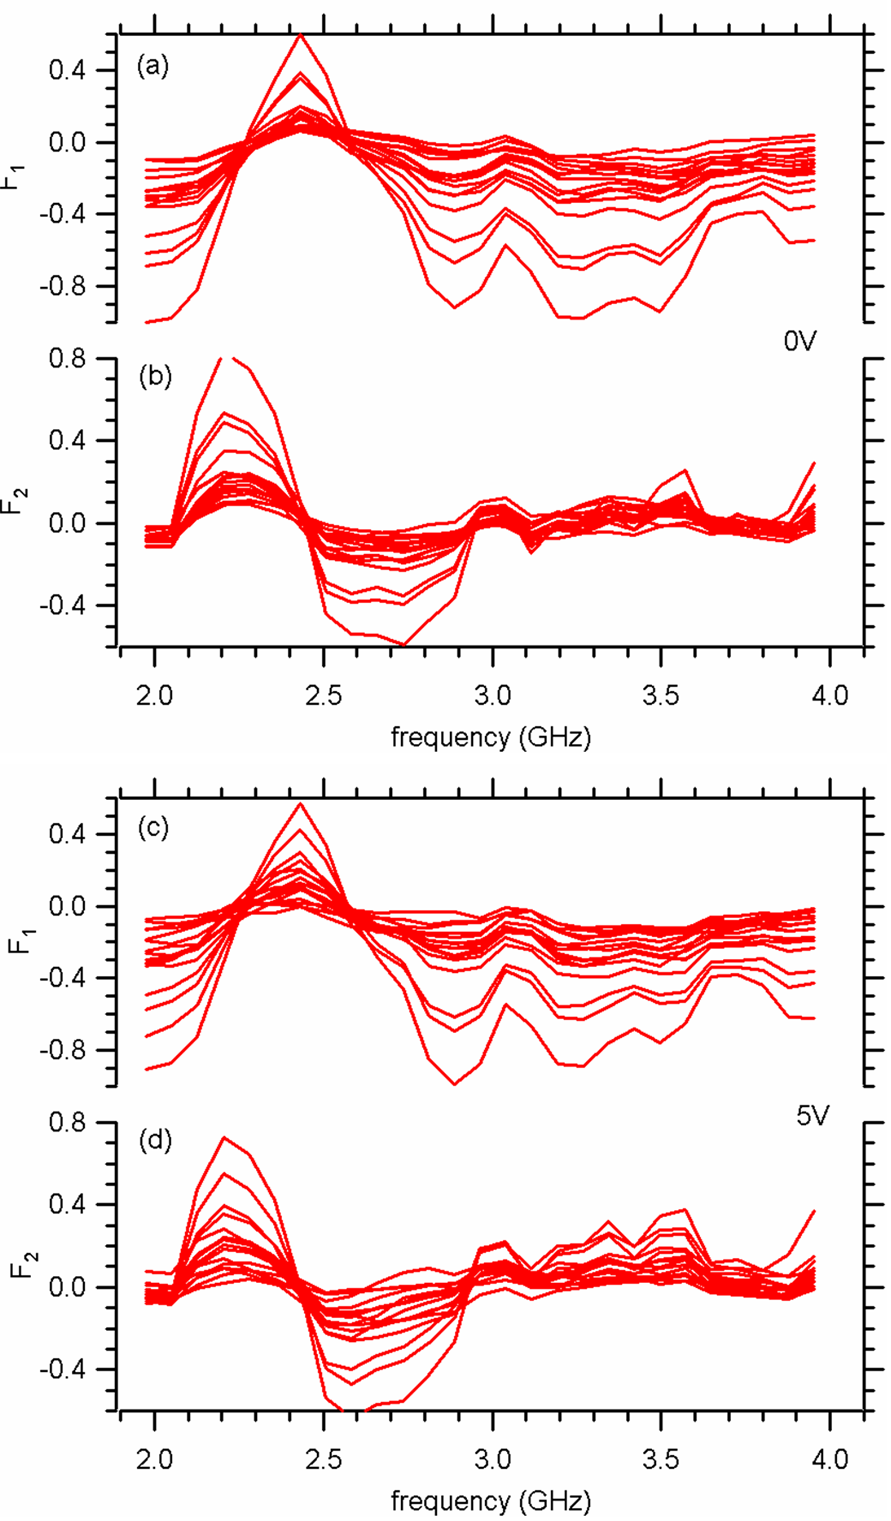
To further investigate the local dynamics, the complex electro-optic response is compared for several regions of the sample. In Figure 4, the linear electro-optic response for the 16 sub-regions identified in Figure 3 are averaged and plotted as a function of applied electric field frequency. Highly dispersive responses are observed at 2.4 GHz and 3.5 GHz. When a DC bias is applied, the dispersion increases at 2.4 GHz while decreasing somewhat at 3.5 GHz.
A typical characteristic of relaxor ferroelectrics is their dielectric dispersion characteristics, many of which can be understood by sound emission due to domain walls vibration (Arlt et al., 1993). Biegalski et al have shown that these SrTiO3/DyScO3 films show relaxor behavior in this frequency range (Biegalski et al., shed). Additionally, the periodic domain structures observed by TRCSOM may produce shear waves that interfere constructively or destructively, depending on the driving frequency (Arlt and Böttger, 1994). In addition to providing evidence of uniform ferroelectric response, the stripe domain pattern we observe could also be the source of the resonances we detect near the domain boundaries and within the domains themselves.
Acknowledgements.
We thank Stephen Kirchoefer for assistance in depositing the interdigitated electrodes. Support from the National Science Foundation (NSF-0333192 and DMR-0103354) and the US Department of Energy is gratefully acknowledged.References
- Arlt and Böttger (1994) G. Arlt and U. Böttger, Ann. Phys. 506, 578 (1994).
- Viehland et al. (1992) D. Viehland, S. J. Jang, L. E. Cross, and M. Wuttig, Phys. Rev. B 46, 8003 (1992).
- Wakimoto et al. (2002) S. Wakimoto, C. Stock, Z.-G. Ye, W. Chen, P. M. Gehring, and G. Shirane, Phys. Rev. B 66, 224102 (2002).
- McNeal et al. (1998) M. P. McNeal, S.-J. Jang, and R. E. Newnham, J. Appl. Phys. 83, 3288 (1998).
- Drezner and Berger (2003) Y. Drezner and S. Berger, J. Appl. Phys. 94, 6774 (2003).
- Pattnaik and Toulouse (1997) R. Pattnaik and J. Toulouse, Phys. Rev. Lett. 79, 4677 (1997).
- Dunn (2003) S. Dunn, J. Appl. Phys. 94, 5964 (2003).
- Vorobiev et al. (2004) A. Vorobiev, P. Rundqvist, K. Khamchane, and S. Gevorgian, J. Appl. Phys. 96, 4642 (2004).
- Carlson et al. (2000) C. M. Carlson, T. V. Rivkin, P. A. Parilla, J. D. Perkins, D. S. Ginley, A. B. Kozyrev, V. N. Oshadchy, and A. S. Pavlov, App. Phys. Lett. 76, 1920 (2000).
- Mueller et al. (2001) C. Mueller, R. Romanofsky, and F. Miranda, Potentials, IEEE 20, 36 (2001).
- Findikoglu et al. (1996) A. T. Findikoglu, Q. X. Jia, X. D. Wu, G. J. Chen, T. Venkatesan, and D. W. Reagor, App. Phys. Lett. 68, 1651 (1996).
- Lancaster et al. (1998) M. J. Lancaster, J. Powell, and A. Porch, Superconductor Science and Technology 11, 1323 (1998).
- Haeni et al. (2000) J. Haeni, C. Theis, and D. Schlom, J. Electroceram 4, 385 (2000).
- Haeni et al. (2004) J. H. Haeni, P. Irvin, W. Chang, R. Uecker, P. Reiche, Y. L. Li, S. Choudhury, W. Tian, M. E. Hawley, B. Craigo, A. K. Tagantsev, X. Q. Pan, S. K. Streiffer, L. Q. Chen, S. W. Kirchoefer, J. Levy, and D. G. Schlom, Nature 430, 758 (2004).
- Chang et al. (2004) W. Chang, S. W. Kirchoefer, J. M. Pond, J. A. Bellotti, S. B. Qadri, J. H. Haeni, and D. G. Schlom, J. Appl. Phys. 96, 6629 (2004).
- Hubert and Levy (1999) C. Hubert and J. Levy, Rev. Sci. Inst. 70, 3684 (1999).
- Hubert et al. (1997) C. Hubert, J. Levy, A. C. Carter, W. Chang, S. W. Kiechoefer, J. S. Horwitz, and D. B. Chrisey, App. Phys. Lett. 71, 3353 (1997).
- Hubert et al. (2000) C. Hubert, J. Levy, E. J. Cukauskas, and S. W. Kirchoefer, Phys. Rev. Lett. 85, 1998 (2000).
- Arlt et al. (1993) G. Arlt, U. Bottger, and S. Witte, App. Phys. Lett. 63, 602 (1993).
- Biegalski et al. (shed) M. Biegalski, D. Schlom, S. Trolier-MckInstry, S. K. Streiffer, W. Chang, S. W. Kirchoefer, R. Uecker, and P. Reiche, (unpublished).