Pressure dependence of the upper critical field of MgB2 and of YNi2B2C
Abstract
We present measurements of H under pressure in MgB2 and in YNi2B2C. The changes in the shape of H are interpreted within current models and show the evolution of the main Fermi surface velocities and electron-phonon coupling parameters with pressure. In MgB2 the electron-phonon coupling strength of the nearly two dimensional band, responsible for the high critical temperature, is more affected by pressure than the band coupling, and the hole doping of the band decreases. In YNi2B2C, the peculiar positive curvature of H is weakened by pressure.
pacs:
74.62.Fj, 74.70.Ad, 74.70.Dd, 74.25.OpI Introduction
Recent advances in the synthesis and study of new materials have shown that a highly non uniform electron-phonon coupling over the Fermi surface can lead to many new, and unexpected, superconducting propertiesBrandow03 . In MgB2, which superconducts at T Nagamatsu01 , the electron-phonon coupling is very different in the two sets of bands of the Fermi surface, the quasi two dimensional bands, which strongly couple to the in-plane high energy E2g B-B phonon mode, and the three dimensional bands, leading to the much discussed two band superconductivity Liu01 ; An01 ; Choi02 ; Rubio01 ; Yelland02 ; Cubitt03 . Several new effects are currently under discussion, as e.g. possible internal modes and soliton structures Gurevich03 ; Tanaka02 . In the non-magnetic nickel borocarbide superconductor YNi2B2C (with T Canfieldgeneral ) the superconducting gap is highly anisotropic and vanishes on points or lines of the Fermi surface Shulga ; Yuan03 ; Yokoya00 ; Boaknin01 ; Izawa01 ; Martinez03 . Superconducting electron tunnelling spectroscopy Martinez03 , together with photoemission and point contact experiments Yokoya00 ; Yanson97 demonstrated the importance for the pairing interaction of a low energy (4meV) phonon mode, softened by a nesting feature of the Fermi surface Dugdale99 , a phenomenon previously observed in neutron scattering experiments Zaretski99 .
The underlying physical properties of MgB2 and YNi2B2C are clearly different, and they represent interesting limiting behaviors of electron-phonon coupled superconductors. MgB2 is the most clear-cut example of two band superconductivity, and YNi2B2C has the highest reported anisotropy of the superconducting gap Boaknin01 . It has been found that in both compounds, the temperature dependence of the upper critical field H significantly deviates from the linear behavior expected at low fields within isotropic, single-band, BCS s-wave theory. Instead, the shape of H shows a positive curvature (PC), which is a direct consequence of the presence of two well differentiated subgroups of electrons on the Fermi surface. The Fermi velocities and electron-phonon coupling parameters of these subgroups of electrons are obtained by fitting the shape of H within the effective two band model described in Refs.Shulga ; Dahm03 and in Appendix A.
Studying the changes induced by variations in the volume of the unit cell on the different Fermi surface and electron-phonon coupling parameters is clearly of paramount importance to get a full understanding of this intriguing kind of superconductors, and H under pressure appears as a valuable tool to do so. As a matter of fact, the pressure dependence of H has been previously used to obtain microscopic information of the Fermi surface and coupling parameters of other kinds of superconducting materials Brison . However, although several studies address H at ambient pressure in MgB2 and in YNi2B2CShulga ; Dahm03 ; Kogan02 ; Lyard ; Welp , to the best of our knowledge, no previous measurements of the evolution of H under pressure are available. Note that several groups have systematically studied the effect of chemical pressure on the upper critical field of MgB2Kang04 ; Wilke04 . In that case scattering effects dominate the observed behavior, leading to an increase of the interband and/or intraband coupling, which smears out the differences in the electronic properties and in the coupling to the phonon modes between the subgroups of electrons found in the pure compoundsGolubov97 . The goal of this work is to obtain information about the changes induced by pressure on the different parts of the Fermi surface by measuring and analyzing the pressure dependence of H in MgB2 and in YNi2B2C.
II Experimental
The single crystals of MgB2 were grown as described in LeeXtal , and the ones of YNi2B2C in an image furnace Martinez03 . Small samples of size 0.12x0.12x0.03 mm3, cut from mother crystals, were loaded into a hole in NiMo-alloy gasket positioned between two diamond anvils with 0.7 mm culet diameter. The pressure in the cell was determined by the ruby fluorescence method.
A susceptometer was designed to obtain the largest signal to noise ratio, with a pick up coil wounded very close to the sample space. Anvils were glued to the sapphire backing plates in order to reduce the inductive coupling between coil systems used for ac susceptibility measurements and the body of a diamond anvil cell made of Cu-Be alloy. The secondary coils of two identical coil systems were connected in opposite, thus forming a bridge. The measuring coil system is mounted symmetrically around the anvils and the reference system is placed nearby. After additional compensation by means of an attenuator and a phase shifter the total signal is detected with a lock-in amplifier.
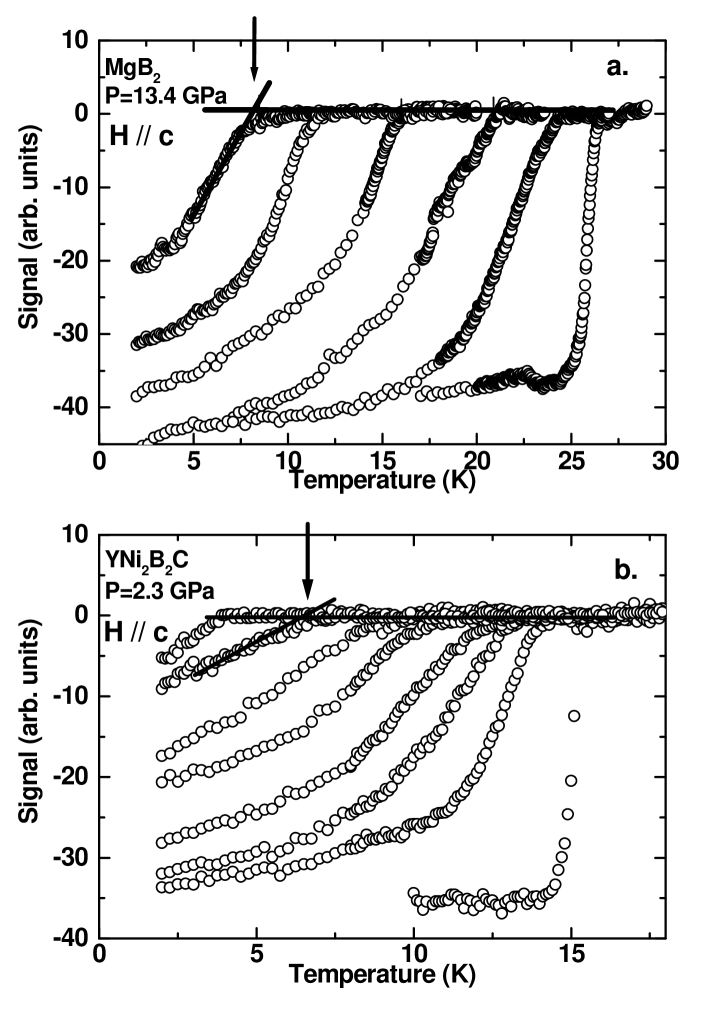
Using this susceptometer, we measured the ac susceptibility as a function of the temperature (down to 2 K) at different magnetic fields (up to 9 T) for several fixed pressures in each compound. The magnetic field was always applied perpendicular to the basal plane of the crystallographic structure. The critical temperature was determined the onset of the superconducting transition curves, which was defined as the intersection of two tangents. One to the flat portion of the curve above and the second to the steepest variation in the signal below superconducting transition, as shown by the lines in Fig.1a and b. In these figures we show a representative example of the temperature dependence of the susceptibility around several superconducting transitions, measured at different magnetic fields and at 13.4 GPa in MgB2, and 2.3 GPa in YNi2B2C. From the dependence of the critical temperature as a function of the magnetic field at each pressure, we obtain the data shown in figures 2 and 4 and discussed in the rest of the paper.
On the other hand, we use a methanol-ethanol mixture as a pressure-transmitting medium, which is thought to give quasi-hydrostatic pressure conditions. It is important to emphasize that previous measurements of T at zero magnetic field in hydrostatic conditions (with helium as a pressure transmitting medium, see e.g.Deemyad ; Goncharov02 and references therein), made in MgB2, agree well with the data presented here. Hence, we can exclude that the eventual deviations from hydrostatic conditions influence the results obtained here.
III Results and discussion
To interpret our data, we follow the microscopic model of Refs.Shulga ; Dahm03 , which numerically linearizes the equations for H obtained from Eliashberg theory Prohammer87 (see Appendix A). The main change of H under pressure occurs in the form of the PC and the value of H , which are uniquely determined by the values of coupling strengths, and Fermi velocities and of the different subgroups of electrons used to model the Fermi surfaceShulga . Here, we take for the interband coupling constants . In fact, the values found in literature and are indeed close to Shulga ; Dahm03 , and they show the same pressure dependencies, if left as free parameters, as . Other parameters of the model, the Coulomb pseudopotential and a mean phonon frequency do not affect the PC and form of , and we therefore leave them unchanged (see Table I).
III.1 Upper critical field under pressure of MgB2.
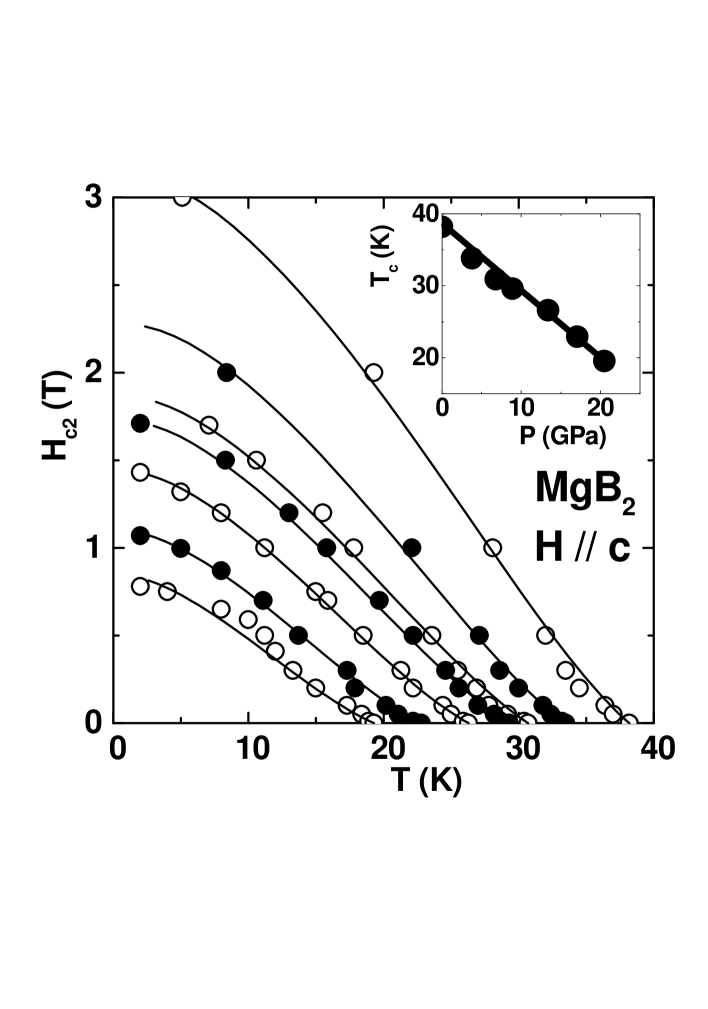
The temperature dependence of the upper critical field of MgB2 up to 20.5 GPa is shown in Fig. 2. We could not find any previous H data under pressure, although, as already noted, T and H have been thoroughly studied in Refs.Kogan02 ; Lyard ; Welp ; Deemyad ; Goncharov01 ; Goncharov02 ; Tomita01 , and agree well with our data. More recently, a broadening of the transition under magnetic fields has been discussed in terms of fluctuation in Ref.Masui . However, it appears to depend on the volume of the samples.
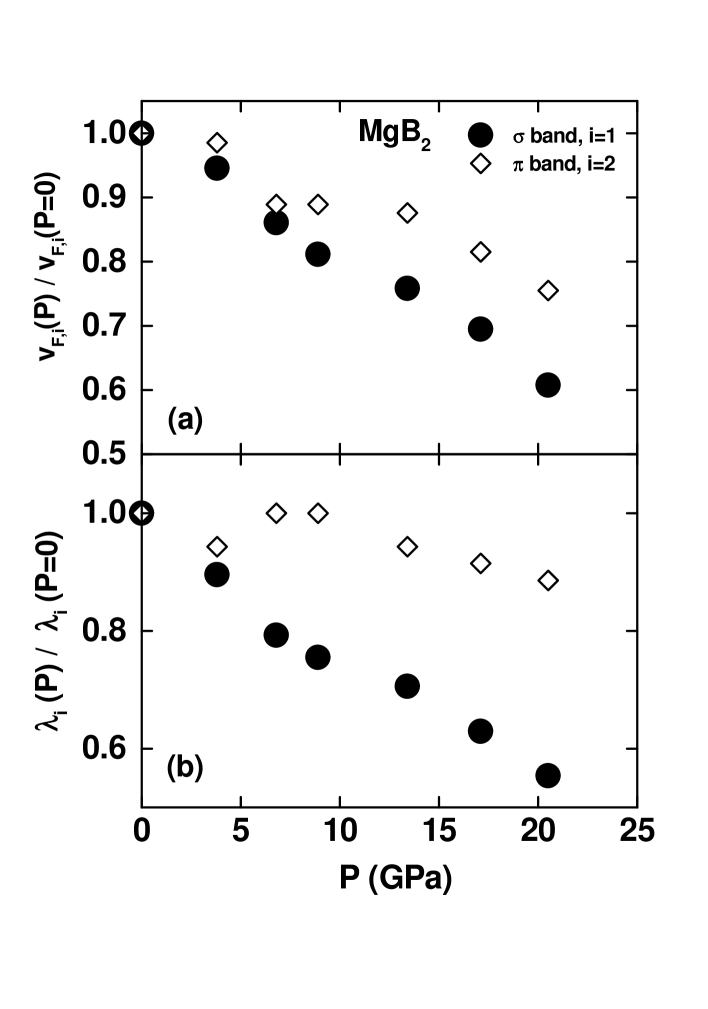
The critical temperature drops by a factor of 2 at 20.5 GPa, and H by a factor of 4. The shape of H changes by increasing pressure. The PC is always observed, although it appears to be slightly weakened by pressure. More detailed information is found by fitting the data (lines in Fig. 2) and following the evolution of the most important parameters, as shown in Fig. 3. The Fermi velocities (Fig. 3a) decrease for both sets of bands under pressure. The slightly stronger decrease of reflects the stronger pressure dependence of the band structure of this subgroup of electrons. The dispersion relation can be taken to be roughly quadratical in the basal plane, as the Fermi level cuts these bands near their top An01 ; Yelland02 , so that the Fermi velocity is approximately proportional to the radius of the sheets. Hence, the decrease observed here shows the continuous shrinking of the volume of the sheet under pressure. As emphasized in early band structure calculations on MgB2 and related isoelectronic systemsAn01 , the layer of Mg2+ ions causes charge transfer from the to the bands, doping with holes the bands, which strongly contribute to the density of states at the Fermi level due to their two-dimensionality. Our data show how pressure reduces the doping, and the band density of states. This reduction appears to affect mainly the electron-phonon coupling in the bands (Fig. 3b). As a matter of fact, previous estimations of the pressure effect on the overall coupling constant , based on the T measurementsDeemyad ; Goncharov01 ), agree with the pressure dependence of found here. Hence, the overall decrease in the electron-phonon coupling under pressure does not occur over the whole Fermi surface, but must be associated to a loss of electron-phonon coupling mainly in the bands, which is ultimately responsible for the decrease of Tc(P).
On the other hand, we should also emphasize that the high energy E2g phonon mode, to which the band electrons mainly couple, has been shown by Raman scattering measurements to stiffen under pressure, increasing its frequency by about 30% at 20 GPaGoncharov01 ; Goncharov02 . Correspondingly, decreases, as shown here in Fig. 3b, because the hole doping of the bands, achieved through the ionic layered character of MgB2, is gradually lost. Note also that previous experiments have identified a kink in T at 20 GPa, which has been attributed to an electronic topological transition, corresponding to one of the two sheets moving below the Fermi level at 20 GPa Meletov02 ; Deemyad ; Goncharov01 . The decrease of observed here shows the pressure induced filling of the bands, and agrees well with this scenario.
III.2 Upper critical field under pressure of YNi2B2C.
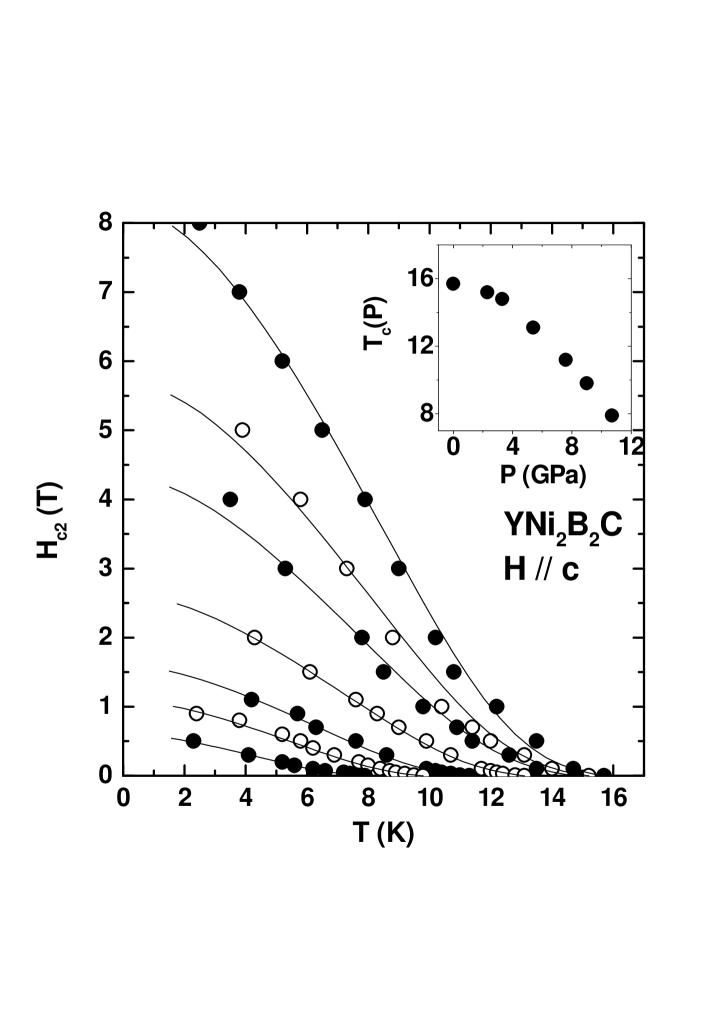
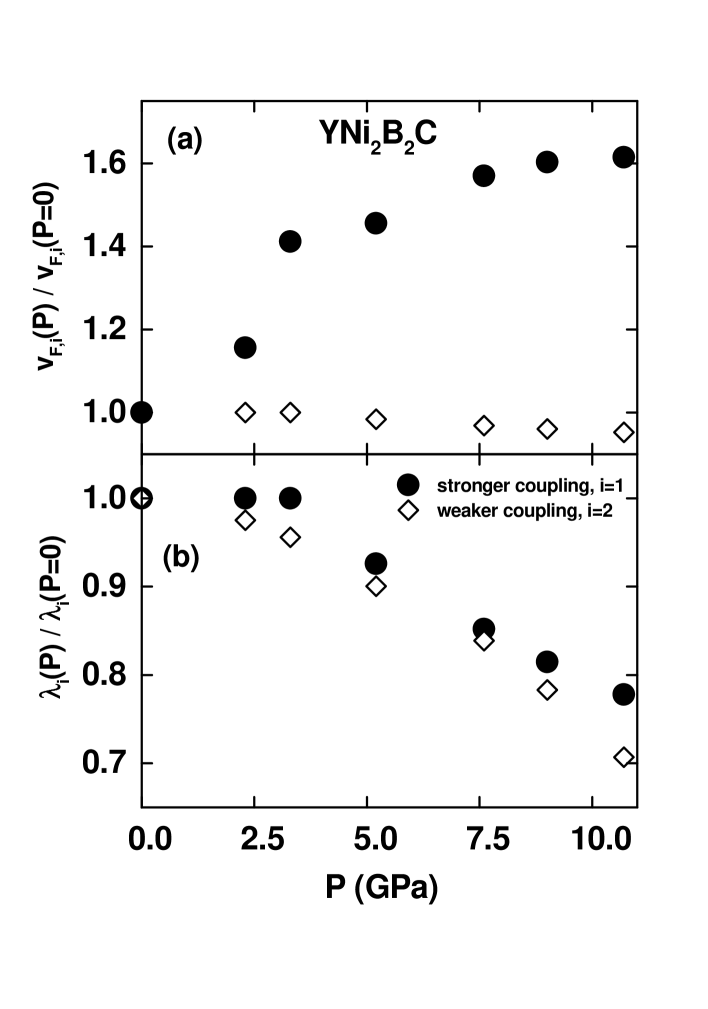
The pressure dependence of the critical temperature and upper critical field of YNi2B2C is shown in Fig. 4. Previous Tc(P) measurements were done at zero fieldAlleno95 , and stopped at a much lower pressure (3 GPa), so that the decrease measured here most clearly above 3 GPa (inset of Fig. 4) could not be observed. Hc2(T) at ambient pressure is in excellent agreement with previous work, and shows the extreme PC discussed in Ref.Shulga . Remarkably, while the critical temperature is suppressed by a factor of 2 at 10 GPa, the zero temperature extrapolation of the upper critical field drops by an order of magnitude. In addition, the PC in H is also suppressed by pressure. The best fit to the data is shown as lines in Fig. 4. At ambient pressure, we obtain the parameters summarized in Table I. Their evolution as a function of pressure is shown in Fig. 5. Note that the electron-phonon coupling parameters and drop both continuously with pressure (Fig. 5b) in approximately the same way. However, the changes in the Fermi velocity occur mainly in the subgroup of electrons with strongest coupling (, Fig. 5a), evidencing an increase of the volume of the corresponding part of the Fermi surface.
At zero pressure, the Fermi surface nesting feature found in Ref.Dugdale99 leads to a significant softening of an acoustic phonon mode down to about 4meV. The corresponding strong-coupling feature has been observed in tunnelling spectroscopy, and an electron-phonon coupling parameter between and , of the same order as the one used here for at ambient pressure (Table I), has been obtainedMartinez03 . The decrease in the electron-phonon coupling under pressure shown in Fig. 5b should be related to the hardening of this mode and the concomitant disappearance of the Fermi surface nesting feature. This must be accompanied by an increase of the volume of the corresponding part of the Fermi surface, explaining the increase of observed here (Fig. 5a). The importance of band structure effects in understanding the microscopic origin for the peculiar superconducting properties of YNi2B2C is evidenced by our data.
IV Summary and conclusion
In summary, we have found that the evolution of Hc2(T) under pressure in MgB2 and in YNi2B2C reflects the changes occurring in the bandstructure and electron-phonon coupling of the different subgroups of electrons on the Fermi surface. In the two band superconductor MgB2, the electron-phonon coupling in the band, responsible for its high critical temperature, is strongly affected by pressure through the reduction of the band hole doping. In YNi2B2C, the critical temperature decreases continuously with pressure, together with the electron-phonon coupling parameters in both subgroups of electrons. Hc2(T = 0 K) dramatically decreases under pressure, and, at the same time, the peculiar PC curvature of Hc2(T) is weakened, showing the pressure induced increase in the volume of the Fermi surface part corresponding to the strong coupling subgroup of electrons.
V Acknowledgments
We specially acknowledge discussions and help of P.C. Canfield. We are also grateful to F. Guinea and A. Levanyuk and for receiving support from the ESF programme VORTEX, from the MCyT (Spain; grants MAT-2001-1281-C02-0, MAT-2002-1329 and SAB2000-039), and from the Comunidad Autónoma de Madrid (07N/0053/2002, Spain). This work was partially supported by the New Energy and Industrial Technology Development Organization (NEDO) as the Collaborative Research and Development of Fundamental Technologies for Superconductivity Applications. The Laboratorio de Bajas Temperaturas is associated to the ICMM of the CSIC.
Appendix A
Equations for two band superconductors have been given by numerous authors Prohammer87 ; Shulga . For the sake of completeness, we give here the linearized gap equations under magnetic field, for a superconductor in the clean limit (negligible impurity scattering), as can be found in reference Shulga (with corrections of typewriting mistakes of factor 2 in the Matsubara frequency and definition of ). In the following, i and j are the band index, is the density of interactions from band i to j (involving diffusion from band i to j), is the Fermi velocity of band i, and is the upper critical field:
| (1) | |||||
The value of is given by the largest set of values of yielding a non trivial solution of equation 1.
We have used in addition an Einstein spectrum for the density of interactions:
| (2) |
introducing a characteristic energy scale . In the calculations, we find : let us note that this value of cannot be determined by the fit of only: it depends directly of the absolute value of the whereas the shape of is controlled only by the relative size of the (as long as they are not too large). The cut-off parameter in equation 1 is taken to , and the infinite system of equations 1 has been truncated at each temperature when reaches .
Note also that bare Fermi velocities enter the above equations, and that renormalized Fermi velocities should be used for comparison to specific heat or de Haas-van Alphen measurements Mazin2003 .
References
- (1) B.H. Brandow, Philosophical Magazine 83, p.2487 (2003).
- (2) J. Nagamatsu et al. Nature, 410, 63 (2001).
- (3) A. Y. Liu, I. I. Mazin and J. Kortus, Phys. Rev. Lett. 87, 87005 (2001).
- (4) J.M. An, W.E. Pickett, Phys. Rev. Lett 86, 4366 (2001).
- (5) H.J. Choi, D. Roundry, H. Sun, M. L. Cohen, S.G. Louie, Nature, 418, 758 (2002)
- (6) G. Rubio-Bollinger, H. Suderow, S. Vieira, Phys. Rev. Lett., 86, 5582 (2001).
- (7) E. A. Yelland, J. R. Cooper, A. Carrington, N. E. Hussey, P. J. Meeson, S. Lee, A. Yamamoto and S. Tajima, Phys. Rev. Lett. 88, 217002 (2002)
- (8) R. Cubitt, M. R. Eskildsen, C. D. Dewhurst, J. Jun, S. M. Kazakov, and J. Karpinski Phys. Rev. Lett.91, 047002 (2003)
- (9) A. Gurevich and V.M. Vinokur, Phys. Rev. Lett. 90, 047004 (2003)
- (10) Y. Tanaka Phys. Rev. Lett. 88, 017002 (2002)
- (11) P. C. Canfield, P. L. Gammel and D. J. Bishop, Phys. Today 51, 40 (1998).
- (12) S. V. Shulga, S.-L. Drechsler, G. Fuchs, K.-H. Müller, K. Winzer, M. Heinecke, and K. Krug, Phys. Rev. Lett. 80, 1730 (1998).
- (13) Q. Yuan and P. Thalmeier, Phys. Rev. B 68, 174501 (2003) and also for example K. Maki, P. Thalmeier and H. Won, ibid, 65, 140502 (2002).
- (14) T. Yokoya, T. Kiss, T. Watanabe, S. Shin, M. Nohara, H. Takagi, and T. Oguchi, Phys. Rev. Lett. 85, 4952 (2000).
- (15) E. Boaknin, R. W. Hill, C. Proust, C. Lupien, L. Taillefer, and P. C. Canfield, Phys. Rev. Lett. 87, 237001, (2001).
- (16) K. Izawa, A. Shibata, Y. Matsuda, Y. Kato, H. Takeya, K. Hirata, C. J. van der Beek, and M. Konczykowski, Phys. Rev. Lett. 86, 1327 (2001).
- (17) P. Martínez-Samper, H. Suderow, S. Vieira, J. P. Brison, N. Luchier, P. Lejay, and P. C. Canfield, Phys. Rev. B 67, 014526 (2003).
- (18) I.K. Yanson, V. V. Fisun, A. G. M. Jansen, P. Wyder, P. C. Canfield, B. K. Cho, C. V. Tomy, and D. McK. Paul, Phys. Rev. Lett. 78, 935 (1997).
- (19) S.B. Dugdale, M.A. Alam, I. Wilkinson, R.J. Hughes, I.R. Fisher, P.C. Canfield, T. Jarlborg, and G. Santi, Phys. Rev. Lett. 83, 4824 (1999).
- (20) J. Zarestky, C. Stassis, A. Goldman, P. Canfield, G. Shirane, and S. Shapiro, Phys. Rev. B 60, 11 932 (1999).
- (21) T. Dahm and N. Schopohl Phys. Rev. Lett. 91, 017001 (2003)
- (22) L. Glémot, J. P. Brison, J. Flouquet, A. I. Buzdin, I. Sheikin, D. Jaccard, C. Thessieu, and F. Thomas Phys. Rev. Lett. 82, 169-172 (1999).
- (23) V.G. Kogan Phys. Rev. B 66 (2002), p. 020509; S. L. Budko and P. C. Canfield, Phys. Rev. B 65, 212501 (2002)
- (24) U. Welp, A. Rydh, G. Karapetrov, W. K. Kwok, G. W. Crabtree, Ch. Marcenat, L. Paulius, T. Klein, J. Marcus, K. H. P. Kim, C. U. Jung, H.-S. Lee, B. Kang, and S.-I. Lee, Phys. Rev. B 67, 012505 (2003)
- (25) L.Lyard, P.Samuely, P.Szabo, T. Klein, C.Marcenat, L. Paulius, K.H.P.Kim, C.U.Jung, H.-S.Lee, B.Kang, S. Choi, S.-I.Lee, J.Marcus, S.Blanchard, A.G.M.Jansen, U.Welp, G. Karapetrov, W.K.Kwok, Phys. Rev. B 66 (2002), 180502 (R).
- (26) B. Kang, H.-J. Kim, H.-S. Lee, Sung-Ik Lee, cond-mat-0403455.
- (27) R. H. T. Wilke, S. L. Bud’ko, P. C. Canfield, D. K. Finnemore, R. J. Suplinskas, and S. T. Hannahs, Phys. Rev. Lett. 92, 217003 (2004).
- (28) A.A. Golubov and I.I. Mazin, Phys. Rev. B 55, 15 146 (1997), and A. A. Golubov and A. E. Koshelev, ibid 68, 104503 (2003).
- (29) S. Lee, H. Mori, T. Masui, Y. Eltsev, A. Yamamoto, and S. Tajima, J. Phys. Soc. Jpn. 70, 2255 (2001).
- (30) S. Deemyad, T. Tomita, J. J. Hamlin, B. R. Beckett, J. S. Schilling, D. G. Hinks, J. D. Jorgensen, S. Lee and S. Tajima Physica C, p.105, 385, 1-2 (2002).
- (31) A.F. Goncharov and V.V. Struzhkin, Physica C, 385, p. 117, 1-2 (2002).
- (32) M. Prohammer and E. Schachinger, Phys. Rev. B, 36, 8353 (1987).
- (33) A. F. Goncharov, V. V. Struzhkin, E. Gregoryanz, JingzhuHu, R. J. Hemley, H.K. Mao, G. Lapertot, S. L. Bud ko, and P. C. Canfield Phys. Rev. B 64, 100509 (2001)
- (34) T. Tomita, J.J. Hamlin, J.S. Schilling, D.G. Hinks, J.D. Jorgensen, Phys. Rev. B 64 (2001) 092505.
- (35) T. Masui, S. Lee, S. Tajima Physica C 383, 299 (2002) and to appear in Phys. Rev. B, cond-mat/0312458.
- (36) K. P. Meletov, M. P. Kulakov, N. N. Kolesnikov, J. Arvanitidis, and G. A. Kourouklis, JETP Letters, 75, pp. 406-409 (2001).
- (37) E. Alleno, J. J. Neumeier, J. D. Thompson, P. C. Canfield, and B.K. Cho, Physica C 242, 169 (1995)
- (38) I.I. Mazin and V.P. Antropov, Physica C 385, 49 (2003).
| vF1 | vF2 | |||
|---|---|---|---|---|
| MgB2 | 1.1 | 0.35 | 0.29 | 0.9 |
| YNi2B2C | 0.84 | 0.27 | 0.059 | 0.7 |