Magnetic phase separation in \chemEuB_6 detected by muon spin rotation
Abstract
We report results of the first muon-spin rotation measurements performed on the low carrier density ferromagnet \chemEuB_6. The ferromagnetic state is reached via two magnetic transitions at K and K. Two distinct components are resolved in the muon data, one oscillatory and one non-oscillatory, which arise from different types of magnetic environment, and we have followed the temperature dependence of these components in detail. These results provide evidence for magnetic phase separation and can be interpreted in terms of the gradual coalescing of magnetic polarons.
pacs:
76.75.+i, 75.47.Gk, 75.50.CcEuropium hexaboride has attracted recent interest because it exhibits colossal magnetoresistance (CMR) Fisk et al. (1979) and it has been suggested that its semiconductor-semimetal transition results from the overlap of magnetic polarons Süllow et al. (2000). \chemEuB_6 crystallises into a simple cubic structure (space-group Pm3m) with divalent Eu ions () at the corners of the unit cell and B6-octahedra at the body-centred positions, and is a ferromagnet at low temperatures Fisk et al. (1979). Specific heat and magnetization measurements reveal that this state is reached via two distinct transitions at and Süllow et al. (2000, 1998). Neutron diffraction measurements show that a small spontaneous magnetic moment begins to grow on cooling below , but does not become significant until is reached, below which point the moment shows a more usual mean-field like behaviour Henggeler et al. (1998). The magnetic ordering is accompanied by a sharp drop in the resistivity which is strongly field dependent Guy et al. (1980) and gives rise to a large negative magnetoresistance Süllow et al. (2000). This transition from a semiconductor at high temperatures to a semimetal Massidda et al. (1996); Aronson et al. (1999); Goodrich et al. (1998); Kuně and Pickett (2004) (or possibly a self-doped compensated semiconductor Wigger et al. (2004)) at low temperatures is reminiscent of the metal-insulator transition seen in manganites exhibiting CMR Imada et al. (1998). Detailed measurements of resistivity and magnetization Süllow et al. (2000) show that this transition is associated with . It is thought that magnetic polarons could be responsible for this behaviour, with the upper magnetic transition and drop in resistivity caused when the bound carriers overlap and percolate, and the lower transition caused by a true transition to a bulk ferromagnetic state Süllow et al. (2000). Further support for this explanation comes from the observation of polaronic features, possibly associated with itinerant holesCalderón et al. (2003), below in Raman-scattering spectra Nyhus et al. (1997). The trapping of carriers to form bound magnetic polarons provides an explanation for the upturn in resistivity observed on cooling through Süllow et al. (2000); Calderón et al. (2003) and the negative magnetoresistance Chatterjee et al. (2004); Calderón et al. (2003). However, a direct observation of overlapping polarons in \chemEuB_6 has so far been elusive.
In this paper we present the results of SR experiments on \chemEuB_6 which not only provide further evidence for the two distinct magnetic transitions but are also able to resolve two components arising from muons stopping in two different types of environment below . The first component is an oscillating signal and can be associated with muons that stop in a locally ferromagnetic environment. The second component is a Gaussian signal and arises from the muons that come to rest in a paramagnetic environment. This provides clear evidence for magnetic phase separation below .
Our SR experiments were carried out using the DOLLY instrument at the Paul Scherrer Institute (PSI) in Switzerland and the DEVA beamline at the ISIS pulsed muon facility in the UK. In our SR experiments, spin polarised positive muons (, mean lifetime , momentum 28 MeV) were implanted into polycrystalline EuB6. The muons stop quickly (in s), without significant loss of spin-polarisation. The time evolution of the muon spin polarisation can be detected by counting emitted decay positrons forward (f) and backward (b) of the initial muon spin direction due to the asymmetric nature of the muon decay Blundell (1999). In our experiments, positrons are detected using scintillation counters placed in front of and behind the sample. We record the number of positrons detected by forward () and backward () counters as a function of time and calculate the asymmetry function, , using
| (1) |
where is an experimental calibration constant and differs from unity due to non-uniform detector efficiency. The quantity is then proportional to the average spin polarisation, , of muons stopping within the sample. The muon spin precesses around a local magnetic field, (with a frequency , where ).

Examples of asymmetry spectra measured at PSI are shown in Fig. 1. There are three distinct temperature regions. In the lowest temperature data (), there are clear oscillations in the measured asymmetry, demonstrating that the sample does indeed make a transition to a locally magnetically ordered state. This oscillating signal is superposed on a slow exponential relaxation unobservable in Fig. 1, but visible at longer times. In the second region (), the amplitude of the oscillatory component decreases and a Gaussian component appears, with a decay rate that decreases as the temperature is increased. In the third region (), the amplitude associated with the Gaussian component decreases until, when above , only the slow exponential relaxation remains. The need for the fast relaxing Gaussian term in the fits is clearly motivated by the topmost panel of Fig. 1, where the purely exponential relaxation seen at is compared with the results for a temperature of , which is just inside the intermediate region.
In order to best follow these changes, the data over the whole studied temperature range were fitted to the function
| (2) | |||||
where represents a time-independent background due to muons stopping in the silver that surrounds the sample, and are the longitudinal and transverse relaxation times, and , and are the amplitudes of the exponential, oscillating and Gaussian terms respectively. Plots of the fitted parameters against temperature are shown in Fig. 2. Vertical lines drawn at and approximately divide the plots into the three temperature regions discussed above. In Fig. 2(e) the asymmetry amplitudes of the three different terms are shown, which provide the main motivation for this division. The exponentially relaxing fraction is seen to drop sharply from the maximum value at ; this is expected in a polycrystalline sample when a transition into an ordered state occurs. In the lowest temperature region the remaining amplitude is accounted for by the oscillating fraction, so that here the sample is uniformly magnetically ordered, but at intermediate temperatures there is also a contribution from the fast relaxing Gaussian fraction.
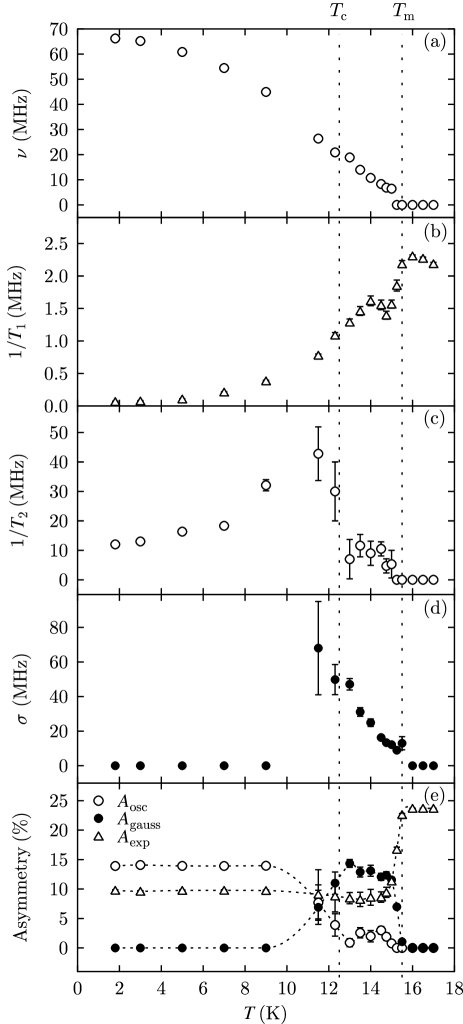
The fact that the asymmetry amplitude is shared between the two fast signals in the intermediate region is evidence that the muons are stopping in two different kinds of environment, that is, magnetic phase separation is occurring Kim et al. (2002); Korenblit (2001). The amplitudes of the two signals are expected to be proportional to the volume fraction of each phase. Phase separation is important between and , but we find it disappears below , in contrast to the predictions of Ref. Korenblit, 2001.
A Gaussian relaxation can result from a field at the muon site which is static but randomly distributed in magnitude. The parameter is related to the width of the field distribution as . Fig. 2(d) shows that increases as the temperature is lowered in the second region, indicating that the field distribution at the muon sites is becoming wider as the sample becomes more ordered at lower temperatures.
Fig. 2(a) shows that the oscillations develop below , and their frequency increases fairly smoothly as the sample is cooled through rising to a maximum of 67 MHz at low temperature (corresponding to a field at the muon site of T). The frequency is proportional to the magnetization and the data in Fig. 2(a) match well with the temperature dependence of the Eu magnetic moment measured with neutron scattering Süllow et al. (1998). Only one muon precession frequency is observed, strongly suggesting that there is a single set of equivalent muon sites in the structure. There are two candidate sites. The first is at the centre of a B octahedron, and the second is at the face-centres of the unit cell (in the centre of the shortest B–B bond which is between atoms in adjacent unit cells). Using the Eu moment measured previously Süllow et al. (1998) and assuming a low temperature magnetic structure with the moments pointing along the [111] direction, the dipole field () can be calculated at both these possible sites. At the centre of a boron octahedron, the dipole field cancels by symmetry. The face-centre positions are all magnetically equivalent and yield . Additional contributions to the field at the muon site arise from the Lorentz field (, corresponding to ), the demagnetization field and the hyperfine contact field, and preclude a definitive assignment of the site.
The longitudinal relaxation rate, , reflects the dynamics of the fields being probed. For rapid fluctuations, , where is the amplitude of the fluctuating local field and is the Eu-ion correlation time at wavevector . In the paramagnetic phase the spin fluctuations are so rapid that the measured relaxation rate is small. As the sample is cooled and the critical region is approached, the correlation time becomes longer and the relaxation rate rises and peaks close to (Fig. 2(b)). In contrast, (which is proportional to the width of the ordered field distribution corresponding to the oscillating fraction) rises dramatically on cooling through and subsequently falls on further cooling (Fig. 2(c)). This emphasises that the ordered and fluctuating fractions in the sample are distinct and follow different temperature dependences.
These observations fit in well with the polaron percolation picture for the intermediate temperature range; muons stopping in ferromagnetic regions of overlapping polarons give rise to the oscillating signal, while most muons stop in the intervening paramagnetic regions. In these paramagnetic regions the Eu-ion correlation time is short, so the muons are not depolarized by the local fluctuating Eu moments, but by the distribution of fields that result from the nearby ferromagnetic regions. As the sample becomes more ordered the paramagnetic regions shrink, with a corresponding effect on the field distribution.

In order to study the slower relaxation in the high temperature region in more detail, data were collected at the ISIS facility. An example is shown in Fig. 3(a) and clearly shows the presence of both a slow and a fast relaxation rate. Therefore the data were fitted to the function Heffner et al. (2000)
| (3) |
where and are the amplitudes and relaxation rates of the fast and slow exponential components (note that represents relaxation due to fast dynamics and hence slow spin relaxation). The non-relaxing background fraction was held fixed. and were found to be approximately constant with temperature, with about half the value of , and were fixed in the fits. The relaxation rates themselves appear temperature independent above the transition, and it was possible to keep fixed at (see Fig. 3). On cooling towards , begins to decrease, until only one relaxation rate can be resolved below . This is possibly because the two rates become very similar in magnitude, and the presence of may mask any further drop of .
The relaxation rate matches well with the temperature dependence of , as shown in Fig. 3(b), and the two can be identified with each other. At low temperatures, a contribution to can be fitted by (see Fig. 3(b)), appropriate for scattering by two-magnon processes in ferromagnets Yaouanc and de Réotier (1991). However, the component due to fast fluctuations produces too slow a relaxation to be convincingly included in the fits to the PSI data. Nevertheless, the observation of two relaxation rates above allows us to infer the presence of spatial inhomogeneity (a very similar effect has been found in \chemLa_0.67Ca_0.33MnO_3 with SR Heffner et al. (2000)), which persists even at . Above , the temperature dependence of and is weak and featureless. Any polaron dynamics are presumably too fast to be followed by the muon. The dramatic changes observed below can therefore be attributed to a large change in the time-scale of polaron dynamics, such as might be expected when polarons overlap. Although the polaron volume fraction changes little at a percolation transition, their arrangement could be changed so that the average size of a single polaron is larger and its dynamics are much slower.
In conclusion, SR measurements have allowed us to follow the very unusual development of ferromagnetism in \chemEuB_6 through the transitions at and from a local viewpoint. These results reveal two distinct and spatially separate regions of the material associated with different magnetic behaviour. Such magnetic phase separation is qualitatively consistent with a picture based on coalescing polarons.
Part of this work was performed at the Swiss Muon Source, Paul Scherrer Institute, Villigen, Switzerland and the ISIS pulsed muon source, RAL, UK. We are grateful to Robert Scheuermann and Steve Cottrell for experimental assistance and Maria Calderón and Amalia Coldea for useful discussions. This work was funded by the EPSRC (UK) and the NSF under grant DMR-0203214
References
- Fisk et al. (1979) Z. Fisk, D. C. Johnston, B. Cornut, S. von Molnar, S. Oseroff, and R. Calvo, J. Appl. Phys. 50, 1911 (1979).
- Süllow et al. (2000) S. Süllow, I. Prasad, M. C. Aronson, S. Bogdanovich, J. L. Sarrao, and Z. Fisk, Phys. Rev. B 62, 11626 (2000).
- Süllow et al. (1998) S. Süllow, I. Prasad, M. C. Aronson, J. L. Sarrao, Z. Fisk, D. Hristova, A. H. Lacerda, M. F. Hundley, A. Vigliante, and D. Gibbs, Phys. Rev. B 57, 5860 (1998).
- Henggeler et al. (1998) W. Henggeler, H.-R. Ott, D. P. Young, and Z. Fisk, Solid State Commun. 108, 929 (1998).
- Guy et al. (1980) C. N. Guy, S. v. Molnar, J. Etourneau, and Z. Fisk, Solid State Commun. 33, 1055 (1980).
- Massidda et al. (1996) S. Massidda, A. Continenza, T. M. de Pascale, and R. Monnier, Z. Phys. B: Condensed Matter 102, 83 (1996).
- Aronson et al. (1999) M. C. Aronson, J. L. Sarrao, Z. Fisk, M. Whitton, and B. L. Brandt, Phys. Rev. B 59, 4720 (1999).
- Goodrich et al. (1998) R. G. Goodrich, N. Harrison, J. J. Vuillemin, A. Teklu, D. W. Hall, Z. Fisk, D. Young, and J. Sarrao, Phys. Rev. B 58, 14896 (1998).
- Kuně and Pickett (2004) J. Kuně and W. E. Pickett, Phys. Rev. B 69, 165111 (2004).
- Wigger et al. (2004) G. A. Wigger, R. Monnier, H. R. Ott, D. P. Young, and Z. Fisk, Phys. Rev. B 69, 125118 (2004).
- Imada et al. (1998) M. Imada, A. Fujimori, and Y. Tokura, Rev. Mod. Phys. 70, 1039 (1998).
- Calderón et al. (2003) M. J. Calderón, L. G. L. Wegener, and P. B. Littlewood, cond-mat/0312437 (2003).
- Nyhus et al. (1997) P. Nyhus, S. Yoon, M. Kauffman, S. L. Cooper, Z. Fisk, and J. Sarrao, Phys. Rev. B 56, 2717 (1997).
- Chatterjee et al. (2004) J. Chatterjee, U. Yu, and B. I. Min, Phys. Rev. B 69, 134423 (2004).
- Blundell (1999) S. J. Blundell, Comtemp. Phys. 40, 175 (1999).
- Kim et al. (2002) K. H. Kim, M. Uehara, V. Kiryukhin, and S.-W. Cheong, cond-mat/0212113 (2002).
- Korenblit (2001) I. Y. Korenblit, Phys. Rev. B 64, 100405 (2001).
- Heffner et al. (2000) R. H. Heffner, J. E. Sonier, D. E. MacLaughlin, G. J. Nieuwenhuys, G. Ehlers, F. Mezei, S.-W. Cheong, J. S. Gardner, and H. Röder, Phys. Rev. Lett. 85, 3285 (2000).
- Yaouanc and de Réotier (1991) A. Yaouanc and P. D. de Réotier, J. Phys.: Condens. Matter 3, 6195 (1991).