Central mode and soft mode behavior in relaxor ferroelectric
Abstract
The relaxor ferroelectric was investigated by means of broad-band dielectric and Fourier Transform Infrared (FTIR) transmission spectroscopy in the frequency range from 1 MHz to 15 THz at temperatures between 20 and 900 K using PMN films on infrared transparent sapphire substrates. While thin film relaxors display reduced dielectric permittivity at low frequencies, their high frequency intrinsic or lattice response is shown to be the same as single crystal/ceramic specemins. It was observed that in contrast to the results of inelastic neutron scattering, the optic soft mode was underdamped at all temperatures. On heating, the TO1 soft phonon followed the Cochran law with an extrapolated critical temperature equal to the Burns temperature of 670 K and softened down to 50 cm-1. Above 450 K the soft mode frequency leveled off and slightly increased above the Burns temperature. A central mode, describing the dynamics of polar nanoclusters appeared below the Burns temperature at frequencies near the optic soft mode and dramatically slowed down below 1 MHz on cooling below room temperature. It broadened on cooling, giving rise to frequency independent losses in microwave and lower frequency range below the freezing temperature of 200 K. In addition, a new heavily damped mode appeared in the FTIR spectra below the soft mode frequency at room temperature and below. The origin of this mode as well as the discrepancy between the soft mode damping in neutron and infrared spectra is discussed.
pacs:
78.30.-j; 63.20.-e;77.22.-d; 77.84DyI Introduction
Lead magnesium niobate PbMg1/3Nb2/3O3 (PMN) was initially studied by Smolenskii Smolenskii58 ; Smolenskii60 in the end of 1950’s, and since that time it has been considered as a model system for relaxor ferroelectrics (RFE). The interest in this topics was recently enhanced after the paper of Park and Shrout Park97 who showed that PbMg1/3Nb2/3O3-PbTiO3 and PbZn1/3Nb2/3O3-PbTiO3 mixed crystals exhibit utrahigh strain and piezoelectric behavior. The model system, PMN shows high and broad maxima of real and imaginary parts of the complex permittivity (T) = (T) -i(T) which shift with increasing measuring frequency to higher temperatures. The dielectric anomaly is not accompanied by any phase transition to polar state, and the structure remains cubic down to liquid He temperatures.Mathan Nowadays it is generally accepted that the strong dielectric dispersion, which occurs in RFE in the broad spectral range from GHz to milliherz rangeBovtun04 ; Colla93 at temperatures around and below that of (T) maximum Tmax, is a consequence of the dynamics of polar nano-clusters, which appear several hundred degrees above Tmax, at so called Burns temperature Td.Burns83 Although many papers have been devoted to RFE (see e.g. reviews by CrossCross87 , YeYe98 , SamaraSamara01 and KambaKamba04 ), the quantitative description of the complex dielectric behavior of RFE is still not satisfactory.
The work presently available on thin film relaxors show that the permittivity is reduced by an order of magnitude as compared to single crystal or ceramic specimensZian ; Tyunina . The commonly reported mechanisms for this reduction in thin films are grain size Papet , clamping of the film by the substrate Catalan , and passive or surface layer effectsPark . However these arguments rely on the assumption that the intrinsic or lattice response of the material is the same in thin film and ”bulk” ceramic/single crystal form, and that somehow the extrinsic response from polar clusters/regions is impacted due to grain size, stress or pinning by processing induced defects. In fact, there has not been any reports on the model PMN relaxor system in thin films form which describe the lattice dynamics and how they compare to single crystal specimens. In the course of this paper we will show that indeed, the high frequency lattice response (in THz range) is the same for PMN in thin film and single crystal specimens, thus providing an important ”basis” on which to judge the origins of the reported reduced dielectric response in thin films. In addition, thin film specimens are more convenient for use in transmission FTIR measurements, so that along with studying the material in its thin films form, we may comment on the intrinsic nature of the material itself as compared to other measurement techniques.
Naberezhnov performed the first study of the lattice dynamics of PMN single crystal by means of inelastic neutron scattering (INS)Naberezhnov99 . They observed a transverse optic (TO1) phonon branch which softens on cooling to T 620 K. Below Td the softening ceased and a strong central peak appeared. Gehring discovered that below Td the TO1 branch appeared to dive into the transverse acoustic (TA) branch at a specific wavevector and no TO1 phonon could be resolved from the INS spectra at lower .Gehring00a ; Gehring00b ; Gehring01b Gehring named this effect the ”waterfall”, and explained it by the presence of polar clusters below Td. According to their arguments, when the wavelength of the TO1 mode becomes comparable to the size of the polar clusters, it cannot propagate and thus becomes overdamped. Simultaneously, it was observed that the damping of TA mode remarkably increased below Td.Naberezhnov99 ; Wakimoto02a The waterfall effect is not specific only for PMN, but has been observed in other relaxors or relaxor based crystals like , and .Gehring01a ; Tomeno01 ; Koo02 ; Gehring00a The line shape of TA and TO1 phonon peaks in INS experiment were successfully explained by the coupling of both modes with the assumption that the TO linewidth (damping) is wave-vector and temperature dependent.Shirane01 ; Wakimoto02b Hlinka et al. repeated the INS measurements of PZN-PT and discovered that the critical waterfall wave vector depends on the Brillouin zone, where the experiment is performed.Hlinka03 Therefore, they claimed that the waterfall effect is not connected with phonon scattering on polar nanoclusters but could be explained as apparent effect in the framework of a model of bilinearly coupled harmonic oscillators representing the acoustic and heavily damped optic phonon branches and the fact that there are different dynamical structure factors in different Brillouin zones.
Wakimoto et al. cooled down the PMN crystal and discovered that the soft TO1 mode recovers (i.e. underdamps) in the INS spectra below 220 K and its frequency hardens according to Cochran law with decreasing temperature.Wakimoto02a ; Wakimoto02b This result was rather surprising because such behavior is typical for displacive feroelectric transitions below Tc, but PMN remains paraelectric down to liquid He temperatures.Mathan It means, that the soft mode behavior provides evidence about the ferroelectric order in polar clusters. On the other hand, it is interesting to note that 220 K coincides with the ferroelectric phase transition temperature Tc in PMN cooled under an electrical bias field.Ye93 The question remains, how does the TO1 zone center soft mode (SM) behave between Tc and Td, where it is not resolved in the INS spectra? Direct experimental data are missing, but Stock et al. extrapolated the measured phonon dispersion curves of the soft TO1 branch from high q to the zone center and predicted that on heating the TO1 mode softens only to 400 K after which it again slightly hardens.Stock04 . In this report, we have used Fourier transform infrared (FTIR) transmission techniques to experimentally examine the response of the material in this temperature range where the SM was unobserved by neutron scattering methods.
Kamba at al. measured FTIR reflectivity of PMN-29%PT and PZN-8%PT single crystals, and in contrast to INS data, they have seen the lowest frequency TO1 phonon underdamped at all temperatures between 10 and 530 K.Kamba03 This discrepancy was explained by the different q vectors probed in infrared (IR) and neutron experiments. The IR probe couples with very long-wavelength phonons (10-5 Å-1) which see the homogeneous medium averaged over many nanoclusters, whereas the neutron probe couples with phonons whose wavelength is comparable to the nanocluster size (10-2Å-1).Kamba03 Recently Kamba at al. also investigated PMN single crystal by means of FTIR reflection spectroscopy and observed an underdamped TO1 SM at all temperatures below 300 K which obeyed the Cochran law.Bovtun04 ; Prosandeev04 Unfortunately they were not able to evaluate unambiguously FTIR data above room temperature, because the reflection band from the TO1 mode overlaps with that of the central mode (CM). Therefore we have decided to perform more sensitive FTIR transmission measurements on a thin PMN film.
II Experimental
PMN single crystals are opaque in the far IR range due to the strong polar mode absorption down to thicknesses of the order of 1 m. Therefore we prepared PMN thin films by chemical solution deposition on sapphire substrate, well transparent in the far-IR range. The PMN film had thickness of 500 nm, the plane-parallel sapphire substrate had the size of 6x8 mm, a thickness 490 m and both faces were optically polished. The film was polycrystalline with a predominately (111) out of plane orientation and a nominal grain size of 60 nm.
In-plane dielectric response of the film was measured using a planar capacitor with standard photolithographically defined gaps of 10 microns between Cu/Cr electrodes sputter deposited on the surface of the PMN film. the capacitance and loss tangent of the electrode/film/substrate stack was measured using a HP4284A impedance analyzer at frequencies from 10 kHz to 1MHz at temperatures from 375 to 175 K. The permittivity of the film was calculated from the electrode/film/substrate stack capacitance according to Vendik Vendik with an estimated error of +/- 10%.
The unpolarized FTIR transmission spectra were taken using a FTIR spectrometer Bruker IFS 113v at temperatures between 20 and 900 K with the resolution of 0.5 . A helium cooled Si bolometer operating at 1.5 K was used as a detector, while an Optistat CF cryostat with polyethylene windows was used for cooling, and a commercial high-temperature cell SPECAC P/N 5850 was used for the heating. The investigated spectral range was determined by the transparency of the sapphire substrate; at 20 K up to 450 (0.3-15 THz), at 900 K the sample was opaque above 190 .
High-frequency and MW dielectric spectra were obtained on PMN single crystal using Agilent HP 4291B impedance analyzer (1MHz-1.8 GHz; 100-520 K) and by waveguide resonance and non-resonance method using fixed-frequency generators (7-74 GHz, 100-800 K).Bovtun97
III Results and discussion
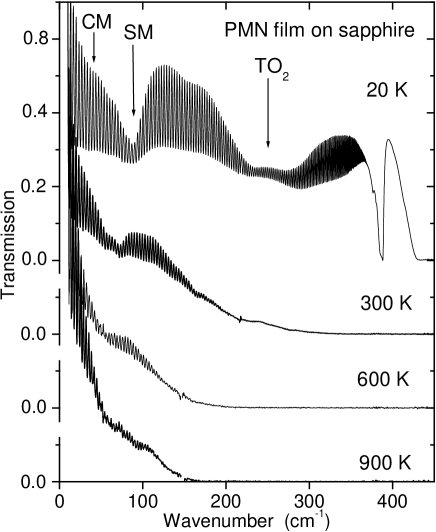
An example of the FTIR transmission spectra of the PMN thin film on a sapphire substrate at selected temperatures is shown in Fig. 1. The dense oscillations in the spectra are due to interferences in the substrate, while broad minima correspond to frequencies of polar phonons. The transmission decreases on heating, mainly due to the increase in multi-phonon absorption of the sapphire substrate. Unusual increase of transmission below 50 was observed on heating above 700 K, which will be explained below by disappearance of the CM above Td.
The spectra of a bare substrate and the PMN film on the substrate were determined for each temperature studied. For a given temperature, the transmission spectrum of the bare substrate was first fitted with a sum of harmonic oscillators using Fresnel formulae for coherent transmission of a plane-parallel sample (i.e. taking into account the interference effects).Born The resulting parameters of sapphire were then used for the fit of the PMN/sapphire two-layer system. The complex transmittance of the two-layer system was computed by the transfer matrix formalism method including interference effects.Heavens


The complex dielectric function expressed as the sum of damped quasi-harmonic oscillators has the formPetzelt
| (1) |
where , and denote the frequency, damping and contribution to the static permittivity of the j-th polar mode, respectively. describes the high-frequency permittivity originating from the electronic polarization and from polar phonons above the spectral range studied. The mode parameters at 20 K are listed in Table 1. TO2 mode near 230 is not seen at high temperatures due to opacity of the sapphire substrate, but at lower temperature it can be well resolved and finally even its splitting is seen into three components due to breaking of symmetry in polar clusters. We note that the factor group analysis and the mode activities in the spectra of various phases of complex perovskite ferroelectrics were published in Ref. Kamba03
| No | |||
|---|---|---|---|
| CM | 39.0 | 95.0 | 73.0 |
| 1 | 64.6 | 6.0 | 37.0 |
| 2 (SM) | 87.0 | 13.0 | 34.0 |
| 3 | 153.0 | 1.5 | 56.0 |
| 4 | 239.0 | 7.7 | 113.0 |
| 5 | 276.0 | 0.9 | 42.2 |
| 6 | 298.0 | 0.3 | 36.0 |
| 7 | 347.0 | 0.3 | 29.0 |
The spectra calculated from the fit of the transmission spectra of PMN/sapphire above and below 400 K are shown in Figs. 2 and 3, respectively. For our discussion it is instructive to look at the dielectric loss spectra, because the frequency of loss maxima characterize the frequencies of excitations, in our case the SM and CM frequencies even in the case of their overdamping. Their temperature dependences are shown in Fig. 4. The TO1 mode slightly softens from 60 (900 K) on cooling, but below 450 K it starts to harden and follows the Cochran law
| (2) |
with the extrapolated critical temperature Td=(671 10) K and A=(11.90.2) K-1. This temperature is close to the Burns temperature 620 K as reported for PMN single crystals.Ye98 The SM frequency in the thin PMN film shown in Fig. 4 is the same as in the bulk sample measured by means of FTIR reflectivity below 300 KBovtun04 ; Prosandeev04 and INS spectroscopy obtained below Tc and above Td.Wakimoto02a It shows that the lattice vibrations are not appreciably influenced by the size effect and by the possible strain in the film, and that the intrinsic or lattice response of relaxors is nominally the same in thin films as in single crystals.
Note the appearance of a new mode near 65 which is seen below 50 K. It occurs due to the local rhombohedral symmetry of polar clusters. The activation of this mode in the FTIR spectra is allowed in the whole temperature range below Td but it is only distinguished as the shoulder near SM frequency at the lowest observed temperatures. This is due to the strong absorption from the overdamped mode near 20 at high temperatures and low damping of both SM and 65 mode at 20 K.
It is important to note that the damping of the SM is only slightly temperature dependent. It increases from 37 cm (at 20 K) to 50 (at 300 K) and at higher temperature it remains temperature independent within the accuracy of our fits. These results show that the SM is underdamped in the whole investigated temperature range as predicted by Stock Stock04 for measurments in the Brillioun zone center, and in direct contradiction with the INS spectra where overdamped zone center TO1 SM is seen between Tc and Td.Wakimoto02a . It is noted that the definition overdamping of the phonon mode occurs when the ratio of the damping and frequency becomes higher than 2.Petzelt In this case the frequency of the maximum does not correspond to but rather to . The discrepancy between the SM damping in INS and FTIR spectra will be explained below.

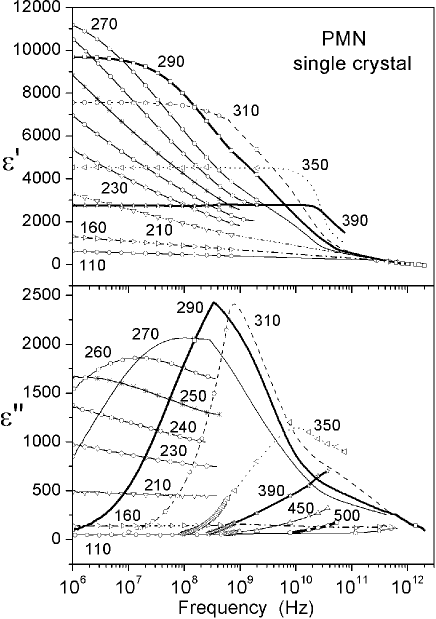
Below the Burns temperature T670 K the FTIR transmission remarkably decreases below 40 due to a new overdamped excitation appearing below the SM frequency. It is responsible for the the increase of the low-frequency (and ) on reducing the temperature to 400 K. We believe that this relaxational excitation originates from the dynamics of polar clusters in PMN and can be called CM in analogy with the INS scattering experiments. The CM frequency rapidly decreases on cooling, and the fit to the overdamped oscillator is only approximate, especially at low temperatures when the relaxation frequency lies below our frequency range. To get insight into this range, we have performed dielectric measurements between 1 MHz and 56 GHz down to 100 K on single crystal PMN specimens (see Fig. 5). One can see the CM near 10 GHz at 350 K while it slows down to 10 MHz at 260 K. Simultaneously the relaxation broadens. It follows from our previous dielectric measurements that the mean relaxation frequency obeys the Vogel-Fulcher law
| (3) |
with the freezing temperature TVF=200 K, activation energy E800 K and high temperature limit of the relaxation frequency 5.7 THz (=190 ).Bovtun04 At lower temperatures the loss maximum becomes so broad that only frequency independent dielectric losses can be seen. It can be fitted by a uniform distribution of relaxation frequencies, much broader than the experimental frequency window.Kamba00 We suggest that this is due to the influence of random fields on the distribution of activation energies for breathing of polar clusters.Bovtun04
We measured also the in-plane dielectric response of PMN thin film on sapphire between 10 kHz and 1 MHz. Comparison of dielectric data obtained on single crystal and thin film is shown in Fig. 6. Relaxor behavior was observed also in the thin film, only the dielectric maximum was approximately five times lower than in single crystalBovtun04 and Tmax was roughly by 50 K higher, similar to recent reports for PMN films measured in the ”out of plane” or parallel plate capacitor configuration Zian . As we previously mentioned, the phonon behavior seems to be the same in single crystal and thin film, with the phonon contribution to the static ’ being less than 100 in both cases. It seems that the CM behavior is also qualitatively the same, however the dielectric strength of the CM is smaller in the thin film. It is probably due to influence of size effect on the dynamics of polar clusters known also in ceramics with different grain size.Papet . However, measurements of epitaxial films and films with different stress conditions also showed reduced dielectric response Nagy as compared to single crystal materials so a detailed study of the impact of external factors leading to a reduced dielectric response in thin films is urgently needed in order to address these questions. Nevertheless, in both single crystal and thin film at Td the CM appears near the SM frequency and its mean relaxation frequency dramatically slows down on cooling to TVF. CM slows down faster in thin film, therefore Tmax is shifted to higher value than in the single crystal. The huge temperature dependence of the CM and its broadening is responsible for diffuse and frequency dependent maxima of (T) in both single crystal and thin film. EgamiEgami has shown that large displacements of Pb ions play the main role in creation of the local dipole moment in nano-clusters below Td. Therefore we can roughly assign our CM to strongly anharmonic hopping of Pb ions.

From our FTIR spectra the CM has the highest dielectric strength at 400 K. At lower temperatures its frequency lies below our frequency range (see dashed line in Fig. 4) therefore apparently decreases on cooling, although it should be highest at Tmax. Nevertheless, some broad excitation remains in the spectra down to 20 K where its loss maximum stabilizes near the frequency =20 . Its possible assignment is the activation of low-energy phonons from the whole Brillouin zone in FTIR spectra (in this case phonons from acoustic branch) as a consequence of breaking the translation symmetry due to chemical disorder at the perovskite B sites and/or a locally doubled unit cell in polar clusters.
Vakhrushev and ShapiroVakhrushev reported that not the TO1 SM but another quasi-optic mode near 3.5 meV exhibits softening on cooling to Td. Their results are not generally accepted because other authorsGehring01b ; Wakimoto02a including this report have seen softening of the TO1 mode. Nevertheless, it is true that the temperature behavior of the SM does not explain Curie-Weiss behavior of the static permittivity above TdWakimoto02b and another soft polar excitation is needed. If the CM exists and hardens above Td, it cannot be connected with dynamics of polar clusters and its intensity should be very low so that it lies below our detection limit. On the other hand, another SM could lie above the TO1 frequency. Unfortunately, we could not study in detail the temperature dependence of TO2 mode near and above Td due to opacity of the sapphire substrate. However we may comment on the behavior of the TO1 mode and its apparent contradiction with previous reports using neutron scattering techniques.
From the results discussed herein, we suggest a plausible explanation for the discrepancy between the SM mode observed by INS and FTIR techniques. INS spectroscopy has a lower energy and resolution than FTIR spectroscopy, therefore INS may not resolve the splitting of the SM below Td into SM and CM, as it is seen in Fig. 2. It sees only one excitation, which apparently becomes overdamped below Td. Only below Tc the CM slows down so much that the SM response is no longer overlapped by the CM and therefore the SM re-appears in INS spectra.

Our suggestions can be supported also by simulation of INS spectra from our spectra. INS spectra I() are proportional to , where is the Bose-Einstein factor. The convolution with instrumental resolution function of neutron spectrometer causes additional enhancement of experimental intensity at low ( 3 meV) frequencies, which is not taken into account. Nevertheless, the simulated spectra plotted at several temperatures in Fig. 7 support our idea. Clear phonon peak is seen near 7 meV at 900 K, but this peak is overlapped by the CM at lower temperatures. The TO1 phonon clearly appears again at 20 K near 11 meV. Fig. 7 can be compared with experimental data, e.g. Fig. 3 in Ref. Wakimoto02a , where it is clearly seen that the intensity of the SM in INS spectra is much lower than the total INS intensity at 500 K, where only the CM was distinguished.
We can also explain why the waterfall effect appears at different wavevectors in different Brillouin zonesHlinka03 . The central peak is the most intensive in the -point of the Brillouin zone and distinctly losses its intensity with increasing wavevector. Above the central peak could be so weak that the TO1 phonon branch appears in the INS spectra. The central peak is in INS spectra remarkably stronger in the 020 Brillouin zone than in the 030 zone, therefore also in the 020 zone is larger than in the 030 zone.
IV Conclusion
It was shown that the phonon behavior is the same in FTIR spectra of PMN single crystal and thin film. Only CM behavior is responsible for different low-frequency dielectric response in thin film and single crystal. In contrast to INS data, FTIR spectra of PMN revealed an underdamped SM at all temperatures between 20 and 900 K. The SM frequency, which softens only partially, obeys the Cochran law up to 450 K, then levels off near 50 and slightly hardens above 650 K. An overdamped CM appears in the FTIR spectra below the Burns temperature and slows down to MW and lower frequency range on cooling. Its temperature behavior was directly investigated by high-frequency and MW dielectric spectroscopy down to 100 K. It is suggested that the waterfall effect in INS spectra can be explained by overlapping of the SM response with the CM response. A new heavily damped excitation near 20 appears in the FTIR spectra below 200 K, probably due to activation of some short wavelength phonons as a consequence of breaking of translation symmetry in the disordered PMN.
Acknowledgements.
We are grateful to J. Hlinka for useful discussions, to M. Berta for the help with the fits of FTIR spectra and to I.P. Bykov for providing the single crystal. This work was supported by the Grant Agency of Academy of Sciences (projects Nos. A1010203 and AVOZ1-010-914), Grant Agency of the Czech Republic (projects No. 202/04/0993) and Ministry of Education of the Czech Republic (project COST OC 525.20/00).References
- (1) G. A. Smolenskii and A. I. Agranovskaya, Soviet. Phys.-Tech. Phys. 3, 1380 (1958).
- (2) G. A. Smolenskii V. A. Isupov and A. I. Agranovskaya, Physica Tverd. Tela (in Russian) 2, 2906 (1960).
- (3) S.-E. Park, T. S. Shrout, J. Appl. Phys.82, 1804 (1997).
- (4) N. de Mathan, E. Husson, G. Calvarin, J.R. Gavarri, A.W. Hewat, and A. Morell, J. Phys.: Condens. Matter 3, 8159 (1991).
- (5) V. Bovtun, S. Kamba, A. Pashkin, M. Savinov, P. Samoukhina, J. Petzelt, Ferroelectrics 298, 23 (2004).
- (6) E. V. Colla, E. Yu, Koroleva, N. M. Okuneva, S. B. Vakhrushev, J. Phys.: Condens. Matter 4, 3671 (1993).
- (7) G. Burns and F. H. Dacol, Solid State Commun. 48, 853 (1983), G. Burns and F. H. Dacol, Phys. Rev. B 28, 2527 (1983).
- (8) L. E. Cross, Ferroelectrics 76, 241 (1987); 151, 305 (1994)
- (9) Z.-G. Ye, Key Engineering Materials,155-156, 81-122 (1998).
- (10) G. A. Samara, Solid State Physics, Advances in Research and Applications, Vol. 56. San Diego: Academic Press; 240-458 (2001).
- (11) S. Kamba and J. Petzelt, Piezoelectric Single Crystals and Their Application, Ed. by S. Trolier-McKinstry, L.E. Cross and Y. Yamashita, Penn State University, 257, 2004.
- (12) Z. Kighelman, D. Damjanovic, N. Setter, Journal of Applied Physics 89, 1393 (2001).
- (13) M. Tyunina, J. Levoska, Physical Review B 65, 132101 (2002).
- (14) P. Papet, J.P. Dougherty, and T.R. Shrout, J. Mater. Res. 5, 2902 (1990).
- (15) G. Catalan, M. Corbett, R. Bowman, J. Gregg, J. Appl. Phys. 91, 2295 (2002).
- (16) J. H. Park, S. Trolier-McKinstry, J. Mater. Res. 16, 268 (2001).
- (17) A. Naberezhnov, S. Vakhrushev, B. Dorner, D. Strauch, and H. Moudden, Eur. Phys. J. B 11, 13 (1999).
- (18) P. M. Gehring, S. B. Vakhrushev, and G. Shirane, in Fundamental Physics of Ferroelectrics 2000, ed. by R. E. Cohen, (American Institute of Physics, Melville, NY, 2000)Vol. 535, p. 314.
- (19) P. M. Gehring, S. Wakimoto, Z.-G. Ye, and G. Shirane, Phys. Rev. Lett. 87 277601 (2001).
- (20) S. Wakimoto, C. Stock, R. J. Birgeneau, Z.-G. Ye, W. Chen, W. J. L. Buyers, P. M. Gehring, and G. Shirane, Phys. Rev. B 65, 172105 (2002).
- (21) P. M. Gehring, S.-E.Park, and G. Shirane, Phys. Rev. Lett. 84, 5216 (2000).
- (22) P. M. Gehring, S.-E. Park, and G. Shirane, Phys. Rev. B 63, 224109 (2001).
- (23) I. Tomeno, S. Shimanuk, Y. Tsunoda, and Y.Y. Ishii, J. Phys. Soc. Jpn. 70, 1444 (2001).
- (24) T. Y. Koo, P. M. Gehring, G. Shirane, V. Kiryukhin, S. G. Lee, and S.W. Cheong, Phys. Rev. B 65, 144113 (2002).
- (25) G. Shirane, P. M. Gehring, J. Phys. Soc. Jpn. 70 Suppl. A 227 (2001).
- (26) S. Wakimoto, C. Stock, Z.-G. Ye, W. Chen, P. M. Gehring, and G. Shirane, Phys. Rev. B 66, 224102(2002).
- (27) J. Hlinka, S. Kamba, J. Petzelt, J. Kulda, C. A. Randall and S. J. Zhang, Phys. Rev. Lett. 91 107602 (2003).
- (28) Z.-G. Ye and H. Schmid, Ferroelectrics, 145, 83 (1993).
- (29) C. Stock, H. Luo, D. Viehland, J. F. Li, I. Swainson, R. J. Birgeneau and G. Shirane, cond-mat/0404086
- (30) S.Kamba, E. Buixaderas, J. Petzelt, J. Fousek, J. Nosek, and P. Bridenbaugh, J. Appl. Phys. 93 933 (2003).
- (31) S. A. Prosandeev, E. Cockayne, B. P. Burton, S. Kamba, J. Petzelt, Yu. Yuzyuk, R. S. Katiyar, and S. B. Vakhrushev, cond-mat/0404349.
- (32) O. Vendik, S. Zubko, M Nikolski, Technical Physics 44, 349 (1999).
- (33) V.P. Bovtun and M.A. Leshchenko, Ferroelectrics 190, 185 (1997).
- (34) M. Born and E. Wolf, Principles of Optics, Oxford, Pergamon, 1960.
- (35) O. S. Heavens, Rep. Prog. Phys. 22, 1 (1960).
- (36) J. Petzelt, G. V. Kozlov and A. A. Volkov, Ferroelectrics 73, 101 (1987).
- (37) S. Kamba, V. Bovtun, J. Petzelt, I. Rychetsky, R. Mizaras, A. Brilingas, J. Banys, J. Grigas and M. Kosec, J. Phys.: Condens. Matter 12, 497 (2000).
- (38) S. B. Vakhrushev and S. M. Shapiro,Phys. Rev. B 66, 214101 (2002).
- (39) V. Nagarajan, S. Alpay, C. Ganpule, B. Nagaraj, S. Aggarwal, E. Williams, A. Roytburd, R. Ramesh, Appl. Phys. Lett. 77, 438 (2000).
- (40) T. Egami, Ferroelectrics 267, 101 (2002).