Universal scaling relations in molecular superconductors
Abstract
Scaling relations between the superconducting transition temperature , the superfluid stiffness and the normal state conductivity are identified within the class of molecular superconductors. These new scaling properties hold as varies over two orders of magnitude for materials with differing dimensionality and contrasting molecular structure, and are dramatically different from the equivalent scaling properties observed within the family of cuprate superconductors. These scaling relations place strong constraints on theories for molecular superconductivity.
pacs:
76.75.+i, 74.25.Nf, 74.25.Fy, 74.70.Kn, 74.20.DeUnderstanding the phenomenon of superconductivity, now observed in quite disparate systems, such as metallic elements, cuprates and molecular metals, involves searching for universal trends across different materials, which might provide pointers towards the underlying mechanisms. One such trend is the linear scaling between the superconducting transition temperature () and the superfluid stiffness (, where is the London penetration depth), first identified by Uemura et al for the underdoped cuprates uemura . Recently, scaling relations between and the normal state conductivity have also been suggested and a linear relation between and the product was demonstrated for cuprates and some elemental superconductors homes . Here we show that these specific linear scaling relations do not hold for molecular superconductors, but a different form of power-law scaling is found to link , and . These scaling properties hold as varies over several orders of magnitude for materials with differing dimensionality and contrasting molecular structure, and the scaling is dramatically different from that of the cuprates. Our findings have considerable implications for the theory of superconductivity in molecular systems.
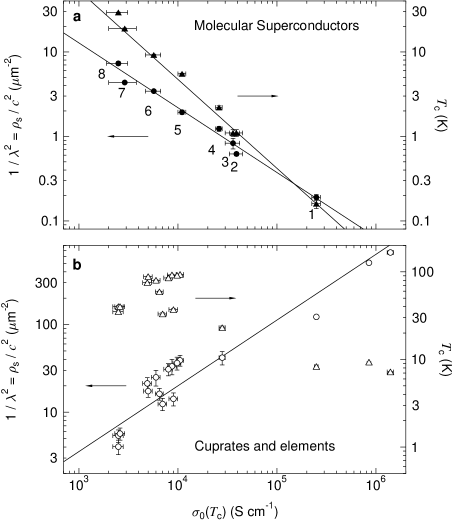
Molecular superconductors are generally regarded as members of the wider group of ‘exotic’ superconductors that have attracted much research effort in recent years. However, the number of different examples of molecular superconductors is now sufficiently large that systematic studies of their properties may be made independently of the other non-molecular exotic superconductors. A general feature of all these exotic superconductors is the large carrier scattering rate observed in the normal state zaanen leading to a picture of them as ‘bad metals’ emery . The scattering rate at temperatures near may have particular relevance for the superconductivity, since it is expected that similar carrier interaction mechanisms would be dominant in the normal state resistance and in the pairing of carriers that leads to the formation of the superconducting state. It is therefore useful to study the correlation between and superconducting parameters such as and . Fig. 1(a) shows () and derived from SR measurements in the vortex state sjb ; sonier , plotted against in the highest conductivity direction for a series of molecular superconductors. The materials range from a highly anisotropic quasi-one-dimensional (q1D) organic superconductor ((TMTSF)2ClO4), through systems of two-dimensional (2D) layered organic superconductors (BETS and ET salts) to examples of three-dimensional (3D) fulleride superconductors; full details are listed in Table 1 flp ; flp2 ; flp3 ; sll ; uemura2 ; kiefl ; kobayashi ; murata ; taniguchi ; bando ; tanaka ; urayama ; rogge ; rotter . Note that the parameter values vary over several orders of magnitude, which is important for successful determination of scaling properties. We find that and are related to by power laws of the form with for and for ; in both cases there is a decrease in the strength of the superconducting property with increasing conductivity. For comparison, Fig. 1(b) shows a similar plot using the data on cuprates and the elements Nb and Pb recently reported by Homes et al homes . Here the overall trend for is much less clear and the trend for shows a broad increase, opposite to that of the molecular superconductors, with the positive exponent . This difference in the – scaling between cuprates and molecular systems in the high conductivity direction contrasts with the reported similarity in scaling behaviour between cuprates and organics in the low conductivity interplane direction dordevic , corresponding to on a – plot. This value is similar to the seen for the cuprate high conductivity direction in Fig. 1(b). We thus have a situation in which the high and low conductivity directions in cuprates, along with the low conductivity direction in layered organics, all share a similar scaling property where increases with increasing , whereas for the high conductivity direction in the molecular superconductors behaves quite differently in decreasing with increasing .
| Label | Material | |||
|---|---|---|---|---|
| (K) | (m) | ( S cm-1) | ||
| 1 | -BETS2GaCl4 | 0.16(2) flp | 2.3(1) flp | 250(25) kobayashi |
| 2 | (TMTSF)2ClO4 | 1.1(1) flp2 | 1.27(3) flp2 | 39(6) (a-axis) murata |
| 3 | -ET2NH4Hg(SCN)4 | 1.1(1) flp3 | 1.1(1) flp3 | 36(6) taniguchi |
| 4 | -ET2IBr2 | 2.2(1) flp3 | 0.90(3) flp3 | 26(2) bando |
| 5 | -BETS2GaCl4 | 5.5(1) flp | 0.72(2) flp | 11(1) tanaka |
| 6 | -ET2Cu(NCS)2 | 9.2(2) flp3 ; sll | 0.54(2) flp3 ; sll | 6(1) urayama |
| 7 | K3C60 | 18.9(1) uemura2 | 0.48(2) uemura2 | 2.9(9) rogge |
| 8 | Rb3C60 | 29.3(1) kiefl | 0.42(2) kiefl | 2.5(6) rotter |
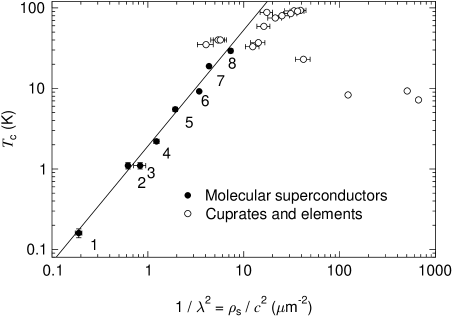
In the case of the molecular systems, the different power laws seen for and against in Fig. 1(a) imply that the scaling between them will not be of the linear Uemura formuemura but will follow another power law. Fig. 2 shows the Uemura plot of against in log–log form where it can be seen that follows with the fitted value . This approximate scaling of with , or equivalently , in 2D organic superconductors was noted previously and discussed in terms of the 2D physics of layered superconductors flp ; flp2 ; powell . However, it now appears that the scaling relations between , and are more universal, encompassing examples of q1D and 3D molecular superconductors alongside the 2D systems. The non-linear scaling between and in the molecular case is much harder to understand than the linear scaling seen in the cuprates. In the cuprates the carrier density is directly controlled by the doping level; in the underdoped regime is directly proportional to and has been suggested to be linked to either through Bose-Einstein condensation of preformed pairs uemura-bec or through a mechanism in which phase fluctuations of the superconducting order parameter determine emery2 . In contrast, for the molecular systems is fixed by the unit cell size and stoichiometry of the crystal structure and varies only little across the range of materials, whose superconducting parameters are nevertheless varying across several orders of magnitude. Differences in the superconducting properties must then arise entirely from differences in the details of the electronic many–body interactions.
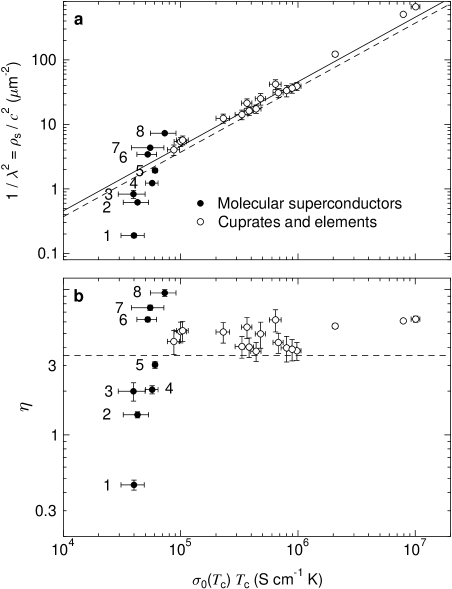
Further evidence for fundamentally different behaviour between molecular and non-molecular superconductors is seen when an attempt is made to search for linear scaling between and the product , of the form that was recently demonstrated by Homes et al homes . Fig. 3(a) shows that such a simple linear scaling does not occur for the molecular superconductors. The linear behaviour seen for the non-molecular systems can be understood from applying the Ferrell-Glover-Tinkham sum rule for the real part of the frequency dependent conductivity ferrell ,
| (1) |
where takes the Drude form , with and being the scattering rate. In the case where is significantly smaller than the frequency corresponding to the superconducting energy gap , the whole free carrier spectrum is redistributed to zero frequency to give the superfluid response peak, i.e. . If, on the other hand, is significantly smaller than , then the normal state conductivity is independent of frequency in the gap region, i.e. ; in this case, as the superconducting gap forms, an area of the conductivity spectrum with frequency width and height is redistributed to zero frequency to give the superfluid response peak. This leads to the following expression for :
| (2) |
where . In Fig. 3(a) the dashed line shows Eqn. 2 plotted taking the weak-coupling BCS limit as a reference; this is seen to describe the general behaviour of the non-molecular data quite well. The effective value of derived from the data using Eqn. 2 is shown in Fig. 3(b), which reveals the considerable variation among the molecular systems. Note that Eqn. 2 was derived assuming that the ratio of carrier density to effective mass is the same in the normal and superconducting states. If, however, this assumption is relaxed then the effective gap ratio observed in this plot becomes
| (3) |
where the subscripts and refer to the superconducting and normal states respectively. Strong coupling can increase over the BCS value via the first term of Eqn. 3, however if Eqn.2 is applicable to the molecular systems then the reduced values of seen for many cases would require a contribution from at least one of the other two terms, i.e. the superconducting carrier density would need to be less than normal state carrier density or the effective mass of superconducting carriers would have to be larger than that of the carriers in the normal state.
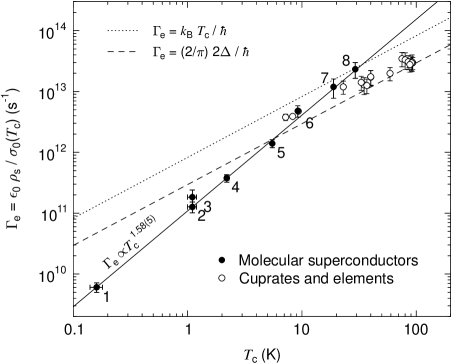
Another way to look at the data is to plot the ratio which gives a measure of the effective frequency width of the normal state conductivity spectrum that provides the superfluid response (Fig. 4). This will be determined either by itself or by , whichever is the smaller. For the non-molecular systems the effective width follows the linear dependence expected if it is proportional to either a BCS-type gap or a -linear scattering rate. In contrast, for the molecular systems follows a steeper power law with the fitted value . This behaviour suggests that the molecular systems are in the low-scattering-rate limit where and follows . We note that the fitted power law for is also broadly consistent with the temperature dependence of the scattering rate deduced from the temperature dependent resistance of individual examples of the molecular metals; measurements for molecular metals just above Tc generally show power-law exponents in the region 1.5 to 2 kobayashi ; murata ; taniguchi ; bando ; tanaka ; urayama ; rogge .
The scaling relations for the molecular superconductors highlighted here suggest that there are features of their electronic properties that are common, despite the various materials having quite different dimensionality and Fermi surface topology. The simplicity of the scaling also suggests that it is being controlled by a single dominant parameter, such as the ratio of the electron correlation energy on a molecule to the electronic bandwidth . also controls the proximity of the Mott insulator (MI) phase; being close to the MI phase supports higher (as seen in studies of the -phase ET salts under pressure Schirber ; Caulfield ) and the inverse relation between and follows naturally from this. However standard approaches to modelling the crossover between MI and superconducting phases predict that the enhanced near the MI phase is accompanied by a depressed benslatest , exactly the opposite of what is observed experimentally. Identification of new theoretical models that match the observed scaling behaviour is clearly necessary; finding such models should lead to significant progress in understanding superconductivity in molecular systems.
We acknowledge discussions and interaction with Ben Powell, Ross McKenzie, Nikitas Gidopoulos, Steve Lee, Naoki Toyota and Takahiko Sasaki. We are also grateful to Katherine Blundell for helpful comments on the manuscript and to the staff at the PSI and ISIS muon facilities for research support.
References
- (1) Y.J. Uemura et al., Phys. Rev. Lett. 62, 2317 (1989).
- (2) C.C. Homes et al., Nature 430, 539 (2004).
- (3) J. Zaanen, Nature 430, 512 (2004).
- (4) V.J. Emery and S.A. Kivelson, Phys. Rev. Lett. 74, 3253 (1995).
- (5) S.J. Blundell, Contemp. Phys. 40, 175 (1999).
- (6) J.E. Sonier, J.H. Brewer and R.F. Kiefl, Rev. Mod. Phys. 72, 769 (2000).
- (7) F.L. Pratt et al., Polyhedron 22, 2307 (2003).
- (8) F.L. Pratt et al., Synth. Met. (in press).
- (9) F.L. Pratt et al., Physica B 289–290, 396 (2000).
- (10) S.L. Lee et al., Phys. Rev. Lett. 79, 1563 (1997).
- (11) Y.J. Uemura et al., Nature 352, 605 (1991).
- (12) R.F. Kiefl et al., Phys. Rev. Lett. 70, 3987 (1993).
- (13) A. Kobayashi, T. Udagawa, H. Tomita, T. Naito and H. Kobayashi, Chem. Lett. 1993, 2179 (1993).
- (14) K. Murata, H. Anzai, G. Saito, K. Kajimura and T. Ishiguro, J. Phys. Soc. Jpn. 50, 3529 (1981).
- (15) H. Taniguchi, Y. Nakazawa and K. Kanoda, Phys. Rev. B 57, 3623 (1998).
- (16) H. Bando et al., J. Phys. Soc. Jpn. 54, 4265 (1985).
- (17) H. Tanaka, A. Kobayashi, A. Sato, H. Akutsu and H. Kobayashi, J. Am. Chem. Soc. 121, 760 (1999).
- (18) H. Urayama et al., Synth. Met. 27, A393 (1988).
- (19) S. Rogge, M. Durkut and T.M. Klapwijk, Phys. Rev. B 67, 033410 (2003).
- (20) L.D. Rotter et al., Nature 355, 532 (1992).
- (21) S.V. Dordevic et al., Phys. Rev. B 65, 134511 (2002).
- (22) F.L. Pratt, S.J. Blundell, T. Lancaster, S.L. Lee and N. Toyota, J. Phys. IV France 114, 367 (2004).
- (23) B.J. Powell and R.H. McKenzie, J. Phys.: Condens. Matter 16, L367 (2004).
- (24) Y.J. Uemura, Physica C282-287, 194 (1997).
- (25) V.J. Emery and S.A. Kivelson, Nature 374, 434 (1995).
- (26) R.A. Ferrell and R.E. Glover, Phys. Rev. 109, 1398 (1958).
- (27) J.E. Schirber et al, Phys. Rev. B 44, 4666 (1991).
- (28) J. Caulfield et al, J. Phys.:Condens. Matter 6, 2911 (1994).
- (29) B.J. Powell and R.H. McKenzie, cond-mat/0410125.