Time resolved fission in metal clusters
Abstract
We explore from a theoretical point of view pump and probe (P&P) analysis for fission of metal cluster where probe pulses are generalized to allow for scanning various frequencies. We show that it is possible to measure the time the system needs to develop to scission. This is achieved by a proper choice of both delay and frequency of the probe pulse. A more detailed analysis even allows to access the various intermediate stages of the fission process.
Pump and probe (P&P) experiments have become a widely used, versatile and powerful tool for time resolved studies of dynamical reactions in all sorts of electronic physics from molecules Zew94 ; Gar95 to bulk Hoe97 . Experimental and theoretical investigations of P&P analysis for clusters as intermediate size systems have started more recently and are mostly still on an exploratory level Har98b ; Lei99 ; Hei00 , see also Rei03a for an overview. Clusters are here a great challenge because they are much more complex than molecules and there is thus a much larger variety of possible scenarios. This calls for theoretical explorations and there exist already several of them, see Rei03a . In the spirit of the studies in And02 ; And03a , we propose to exploit the Mie plasmon resonance as a handle to track the time evolution of the cluster shape. A most dramatic evolution of shapes is experienced in cluster fission Bre94b ; Yan02 , see also Nae97 for a review. The various shapes along the fission path are related to characteristic resonance spectra Rei97b which provides a unique opportunity for P&P analysis of the associated time scales. As we shall see below a standard P&P scenario, augmented by a frequency scan, indeed allows to access a fully time resolved analysis of fission dynamics. This is an interesting task as such and it carries farther reaching information. The time the system needs to attain scission (namely to actually split into two pieces) provides an indirect but crucial clue to the viscosity of clusters Fro97a . Fission is also a well known property in another class of finite fermion systems, namely atomic nuclei. It is actually by studying fission dynamics in atomic nuclei that the first experimental estimate of nuclear viscosity could be attained Dur00 .
The dipole plasmon plays a key role in the dynamics of metal clusters, both in the linear and non-linear domains Kre93 ; Rei03a . It will again provide here the handle for the P&P analysis. The theoretical modeling needs to account properly for both, electronic and ionic degrees of freedom. This is achieved by the Time Dependent Local Density Approximation (TDLDA) for electrons, coupled to Molecular Dynamics (MD) for ions, the coupling being achieved by a local pseudo-potential Kue99 . Absorbing boundary conditions are used throughout, which allows a proper description of ionization. We use a cylindrically averaged description of the electrons to simplify the extensive calculations Cal00 . Details on the TDLDA-MD approach can be found in Cal00 ; Rei03a .
The laser field is described in the dipole approximation as a time-dependent external potential , with the dipole operator , the laser polarization and amplitude , and the temporal profile of the laser pulse, here chosen as a sin2 profile. Pulses are short (FWHM typically less than 50 fs) as required for a P&P scenario. Laser intensities are kept moderate and tuned to provide the proper pump excitation and the proper probe analysis in terms of ionization. Pump as well as probe pulses have the same polarization but different frequencies and FWHM (see below).
Both electronic and ionic observables are recorded as a function of time. The two key observables for the P&P scenario are ionization and the electronic dipole moment with respect to the ionic center of mass, which provides the plasmon response by Fourier transformation into the frequency domain, Cal00 ; Yab96 . The ionization is computed as a function of time, by recording the number of electrons lost through the absorbing boundaries (). Ions are treated as classical particles by standard MD propagation of positions and momenta. The P&P analysis will thus provide a way, with optical techniques, to access this ionic dynamics experimentally.
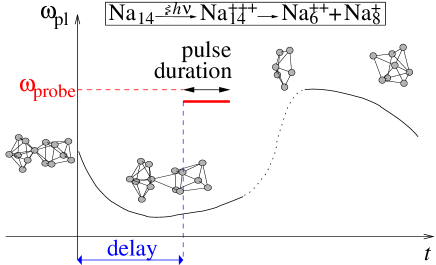
We consider the cluster Na14 initially excited by a pump laser to a 3+ charge state. The laser is linearly polarized along the symmetry axis of the cluster. The is unstable with respect to fission Nae97 and thus starts to elongate until it breaks up. With the pump laser pulse used here (intensity: W/cm2, frequency: 2.3 eV, FWHM: 36 fs), the average fission path leads to . A word of caution is in place here: TDLDA-MD provides an average description and does not give access to all the possible fission channels. Still, even with that limitation TDLDA-MD suffices for a first exploration of P&P analysis of cluster fission. The fission scenario which we have in mind allows a selective identification of either the fissioning system or the fission fragments in terms of optical response. It is indeed typical that the plasmon frequencies of the fragments lie safely above the plasmon frequency of the elongated fissioning cluster. The key mechanism which makes the analysis possible is the fact that the ionization yield is strongly correlated to the plasmon resonance: The closer the frequency of the probe laser to the plasmon frequency, the larger the ionization and vice versa Ull98a . The plasmon response, in turn, is usually concentrated in a well defined frequency domain and provides a direct fingerprint of the underlying ionic structure. Scanning the probe ionization thus provides a strong clue to the ionic structure and its time evolution. The position (and structure) of the plasmon resonance changes in a characteristic manner along a fission path Rei97b : the elongation leads to a progressive red shift of the plasmon resonance mode along the fission axis. However, as soon as the system has fissioned, the now more compact fission products both lead to a significantly blue shifted response. This is sketched in figure 1. Because of the expected strong changes of the resonance landscape, the probe pulses have to hit with the proper frequency as well as the proper delay time. We will thus consider a generalization of the standard P&P scenario to scanning probe frequencies.
First let us start with a standard P&P analysis by fixing the probe frequency and by varying its time delay. For the present test case, the Mie frequencies of the two fission fragments are about 0.7 to 1.5 eV above that of the elongated which lies around 1.9 eV. By choosing a probe frequency at about 3 eV, we should thus be able to track down the scission time by scanning the dynamics in terms of time delay. Before scission the fragmenting system should appear more ”red” while afterwards the system will appear more ”blue”. Indeed the observable here is the additional ionization due to the probe laser with respect to the mere pump ionization, defined as That quantity depends slightly on time for a given delay. We consider here an “asymptotic” value, recorded 500 fs after the probe pulse. The reflects the closeness of the probe frequency to that of the plasmon. For delays lower than the scission time, remains far away from the fragment plasmon and this off-resonance gives vanishing or low extra ionizations. However as we increase the probe delay steadily, a sudden increase of should occur, corresponding to the first resonance of with one or both fragment plasmons. Thus the first delay at which we observe a significant ionization after probe laser gives us an estimate of the scission time. This is indeed what we obtained for eV, see the full curve in figure 2: the obtained extra ionization, as a function of delay, is insignificant up to 1 ps and jumps around 1.25 ps.
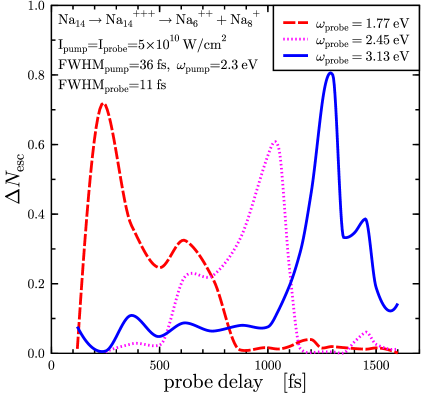
An alternative strategy is to use a low probe frequency, close to that of the compound system, and to check the disappearance of with increased delay time. The picture can be complemented by tracking also an intermediate frequency. These two scenarios are shown together with the high frequency calculations in figure 2. The low frequency of 1.77 eV (long dashes) attaches to the elongated and still connected cluster while the intermediate frequency (dotted curve) attaches the final stages of pre-scission. As expected the three signals are nicely complementing each other and allow to conclude on a scission time of order 1.2 ps for the given test case.
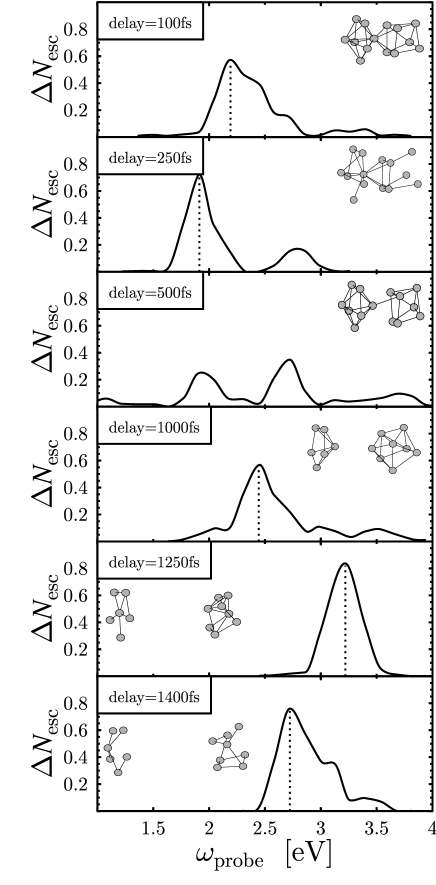
The full richness of resonance spectra at a given stage of fission can be studied in even more detail by fixing the time delay and scanning a dense variety of probe laser frequencies. This way of analysis is illustrated in figure 3, which demonstrates that the plasmon peak position (see vertical lines at the maximum of each spectrum for guidance) and its fragmentation pattern change dramatically on the way to scission. In turn, a probe pulse with fixed frequency will come into resonance only during a rather well defined delay window, as was seen in figure 2. A world of interesting detailed information is thus contained in figure 3 when scanning the probe frequency. Such multi-color P&P setups are, however, an enormous experimental challenge. The trend of the plasmon peak sketched in figure 1 complies with figure 3. For 500 fs delay, the spectrum is too fragmented to define unambigously a plasmon peak. This holds for the transitional interval 300–800 fs, as hinted by a dotted regime in figure 1.
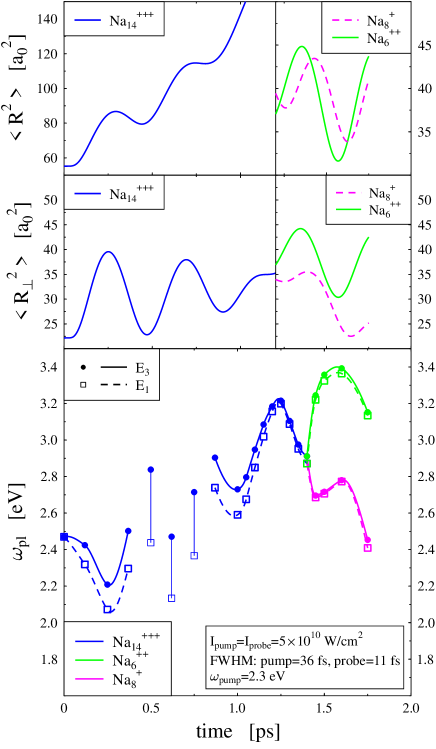
Thus tuning probe delay time and frequency complement each other to analyze the fission process in great detail. A summary analysis can be performed in terms of moments of the resonance spectra Boh79 . To that end, we compute weighted averages over the ionization spectra Good reference averages are and which put moderate emphasis on the lower () and the upper () side of the spectrum. A well peaked resonance response is signaled by . The difference between the two values indicates the width of the spectrum. The results for and are shown in the bottom panel of figure 4. As can also be seen from figure 3, the spectrum is spread up to 1 ps, which corresponds to a large difference between and . Above that delay time, both averages coincide. At short times, an initial red shift is observed, whereas above 1 ps, a sudden blue shift occurs up to 1.3 ps, followed by a final red shift: this panel, compared with figure 1, shows that the results are once again consistent with the expected time evolution of the plasmon. Even if well defined values of and are hard to assign in the 300–800 fs delay range, one can see that the average values oscillate with a period of a few hundred fs which shrinks somewhat with time going on. We expect that the mean plasmon frequency depends on the ionic structure. Thus we check the time evolution of the transverse and the total mean square radii, respectively and , see middle and top panels of figure 4. Note that after 1.2 ps, the radii are calculated for the two separate fission fragments relative to each separate center of mass. Before scission time, shows a breathing although partially masked by the global extension of the cluster along its symmetry axis. The transversal radius also oscillates but is not exactly in phase with . Both radii present periods that shrink with increasing time. We note a relatively good correspondence between the minima of and the maxima of the radii, and vice versa for the maxima of and the minima of the radii. The oscillations of the plasmon frequency are not dominated by either the transverse ionic motion or the longitudinal one, but seem to be a mixture of both. After scission, the plasmon evolution is clearly related to the radial oscillations since the extrema of and perfectly coincide. Thus this “measurement” of the plasmon frequency through the resonant ionization of the cluster gives access to the time evolution of the ionic structure, and to some extent to the potential energy surface along the fission path.
In this paper we have presented a scenario for pump and probe (P&P) analysis of fission of metal clusters. The scheme exploits the marked response of the Mie surface plasmon to laser fields and the fact that the plasmon resonance spectrum changes dramatically along the fission path. The response is quantified in a measurable way in terms of ionization induced by the laser pulse. With a single-frequency P&P setup, one can measure the scission time (that is, the final break up into fragments) when properly tuning the frequency. Scanning the frequency of the probe pulses would allow to resolve more details of the ionic geometries along the fission path. Finally, we ought to mention that a proper orientation of the cluster is required during the time span of the measurement time, i.e. for a few ps. This can be achieved by preparing preliminary a sample of clusters of same orientation, for instance, with the laser burning technique Wen99 ; Sei00 ; and by cooling the beam to a temperature of about 10 K, so that the orientation is conserved for at least 2 ps.
Acknowledgments. The authors thank the French-German exchange program PROCOPE, the Alexander von Humboldt foundation, the French ministry of education, the CNRS program ”Matériaux” and the Institut Universitaire de France for financial support during the realization of this work.
References
- [1] B.M. Garraway and K.-A. Suominen. Rep. Prog. Phys., 58:365, 1995.
- [2] A.H. Zewail. Femtochemistry, Vol. I & II. World Scientific, Singapore, 1994.
- [3] U. Höfer, et al. Science, 277:1480, 1997.
- [4] M. Hartmann, et al. J. Chem. Phys., 108:3096, 1998.
- [5] R. Heinicke and J. Grotemeyer. Appl. Phys. B, 71:419, 2000.
- [6] T. Leisner, S. Vajda, S. Wolf, and L. Wöste. J. Chem. Phys., 111:1017, 1999.
- [7] P.-G. Reinhard and E. Suraud. Introduction to Cluster Dynamics. Wiley, New York, 2003.
- [8] K. Andrae, P.-G. Reinhard, and E. Suraud. J. Phys. B, 35:4203, 2002.
- [9] K. Andrae, P.-G. Reinhard, and E. Suraud. Phys. Rev. Lett., 92:173402, 2004.
- [10] C. Bréchignac, et al. Phys. Rev. Lett., 72:1636, 1994.
- [11] C. Yannouleas, et al. Phys. Rev. Lett., 89:173403, 2002.
- [12] U. Näher, et al. Phys. Rep., 285:245, 1997.
- [13] P.-G. Reinhard, F. Calvayrac, and E. Suraud. Z. f. Physik D, 41:151, 1997.
- [14] P. Froebrich. Phys. Rev. B, 56:6450, 1997.
- [15] D. Durand, E. Suraud, and B. Tamain. Nuclear Dynamics in the Nucleonic Regime. Institute of Physics, London, 2000.
- [16] U. Kreibig and M. Vollmer. Optical Properties of Metal Clusters, volume 25. Springer Series in Materials Science, 1993.
- [17] S. Kümmel, M. Brack, and P.-G. Reinhard. Euro. Phys. J. D, 9:149, 1999.
- [18] F. Calvayrac, P.-G. Reinhard, E. Suraud, and C.A. Ullrich. Phys. Rep., 337:493, 2000.
- [19] K. Yabana and G.F. Bertsch. Phys. Rev. B, 54:4484, 1996.
- [20] C.A. Ullrich, P.-G. Reinhard, and E. Suraud. Phys. Rev. A, 57:1938, 1998.
- [21] O. Bohigas, A.M. Lane, and J. Martorell. Phys. Rep., 51:267, 1979.
- [22] T. Wenzel, J. Bosbach, A. Goldmann, and F. Träger. Appl. Phys. B, 69:513, 1999.
- [23] G. Seifert, M. Kaempfe, K.-J. Berg, and H. Graener. Appl. Phys. B, 71:795, 2000.