Star polymers: A study of the structural arrest in presence of attractive interactions
Abstract
Simulations and Mode-Coupling Theory calculations, for a large range of the arm number and packing fraction have shown that the structural arrest and the dynamics of star polymers in a good solvent are extremely rich: the systems show a reentrant melting of the disordered glass nested between two stable fluid phases that strongly resemble the equilibrium phase diagram. Starting from a simple model potential we investigate the effect of the interplay between attractive interactions of different range and ultrasoft core repulsion, on the dynamics and on the occurrence of the ideal glass transition line. In the two cases considered so far, we observed some significant differences with respect to the purely repulsive pair interaction. We also discuss the interplay between equilibrium and non equilibrium phase behavior. The accuracy of the theoretical tools we utilized in our investigation has been checked by comparing the results with molecular dynamics simulations.
E-mail: federica.loverso@mi.infn.it
pacs:
82.70.D, 64.70.Pf, 61.20.Ja, 61.25.Hq, 71.15.PI Introduction
When a substance dissolves into another to form a true solution and the units dispersed through the solvent are much larger in size than the solvent molecules, we name it a colloidal dispersion. There are different classes of colloidal suspensions: molecules individually larger than footnote e.g. proteins, polysaccharides, polymers, as well as dispersions that arise when a number of small molecules associate together to form an aggregate, it is known, for example, that amphiphilic molecules in a suitable solvent, above a critical concentration, can aggregate in micelles librorosa . Varying the interactions between the mesoscopic constituent particles in colloidal dispersions results in a broad range of equilibrium and non-equilibrium fluid behavior.
One strategy to study such systems involves summing over the solvent degrees of freedom, leaving an effective interaction between the center of mass of the macroparticles Pusey . The resulting effective potential depends, in a complicated fashion, on the interparticle separation and it is in general state dependent dendrimeri2 , Jpierre . A special example in this context is given by the pair potential describing a star polymer solution.
Star polymers (SP) can be considered as a generalization of polymer-coated colloidal particles in the limit where the number of monomers (N) per chain is large and the size of the central core is small with respect to the whole star extension. The repulsive interaction between star polymers at short distances increases very slowly as the interparticle separation decreases, namely in a logarithmic way. The number of chains chemically linked to a core influences the ‘softness’ of : stars with small arm number may interpenetrate widely; in the limit case the star polymer reduces to a simple polymer chain. Stars with very large emphasize their colloidal nature, although only in the limit the potential resembles the hard-sphere one.
Recently solutions of star polymers have received attention in relation to several medical and industrial applications industrial . Moreover, in the last ten years, advances in macromolecular chemistry, leading to the synthesis of regular star polymers, have made it possible to explore the physics of very different model systems monodisperse in N and f td65 , harreis10 . Finally these systems are very interesting from a theoretical point of view in relation to their polymer-colloid hybrid character. Indeed the efficient design of new mesoscopic materials with properties intermediate between different classes of colloidal systems is a very important challenge in soft condensed matter physics.
In the last decades the equilibrium and non-equilibrium phase behavior of SP solutions have been widely investigated, both theoretically td47 ; anom ; Phtd ; SCH2 and experimentally td67 ; td53 ; industrial ; td49 . These system are an interesting example of a complex fluid for which the phase diagram has special features arising from the ultrasoft nature of the repulsive interaction: e.g. there exists a cutoff value of the functionality below which the system is fluid for all densities and for the phase diagram exhibits several unusual solid lattices as well as reentrant melting Phtd ; SANS and SAXS experiments on solutions of many-armed stars above , e.g. td118 , have revealed different macrocrystal structures as we increase the density. The functionality-dependent bcc- and fcc-solids gastprl93 ; gastpre96 , as well as the reentrant melting transition gastmacrom97 , have been experimentally observed in solutions of star-like block copolymer micelles. A second freezing transition observed in the same experiments can be interpreted as the freezing in a bco crystal ref1 .
The dynamical properties of star polymers have been extensively investigated. Several studies, focused on star-polymers or star-like systems in athermal solvent with different arm numbers, have shown that it is quite difficult to nucleate a crystal: in many cases, mainly at high functionalities, the solutions display a gelation transition 15 ; vlassopoulos:jpcm:01 ; kapnistos:prl:00 ; loppinet:macrom:01 ; stiakakis:prl:02 ; stiakakis:pre:02 . Molecular Dynamic (MD) and Brownian Dynamic (BD) simulation data for a large range of and packing fraction show that the dynamics of star polymer solutions is extremely rich. In particular the ideal glass transition line, obtained by means of the Mode-Coupling Theory (MCT) mct , displays a non-monotonic behavior as a function of and . This behavior has been connected to the and -dependence of the effective hard core diameter of an equivalent HS system. The detailed comparison between theoretical predictions and simulations confirms the validity of the MCT approach to study the disordered arrested states in soft matter like colloids fsnat ; ken and in ultrasoft systems like star polymer solutions artvetri . In particular it has been confirmed that the modified hypernetted chain integral equation (MHNC) is a very good approximation to study static correlations in systems described by ultrasoft interactions not only in equilibrium artmio but also in metastable states artvetri .
Recently a model potential has been suggested to describe solutions where, in addition to the excluded volume effects, attraction emerges due to dispersion or depletion forces. For this model the fluid-fluid phase diagram has been determined artmio using mean field theory and two fluid-state-theories, MHNC and the hierarchical reference theory (HRT) H3 ; H4 ; softHRT for different . This analysis shows that when the strength of the interaction is strong enough a fluid-fluid phase transition appears but the density-temperature coexistence curve bifurcates at a triple point into two lines of coexistence terminating at two critical points. This peculiar phase behavior is related to the unusual form of the repulsive contribution.
Moreover it has been shown that self-organized structures, resulting from telechelic linear homopolymers and copolymers, similar to star polymers, can bridge by producing an effective attractive interaction leading to reversible aggregation of macromolecules semenov . These micelles are constituted by telechelic associative polymers which have the associating groups at the chain ends. Above a critical concentration the end groups associate in multiplets, forming flower-like polymeric micelles. At higher concentrations the process of bridging can lead to the formation of a transient gel or also induce macroscopic phase separation taco0 ; taco .
The aim of this paper is to investigate the effect of attractive interactions on the dynamics and on the occurrence of the ideal glass transition line, trying to emphasize the special features of the phase behavior arising from the ultrasoft nature of this repulsive effective interaction. We also qualitatively discuss the interplay between equilibrium and non equilibrium phase behavior. In this work different theoretical and numerical methods have been utilized (mean field theory, fluid state theories, mode-coupling theory, molecular dynamic simulations).
We recall that in the last years a great number of studies focused on the dynamical behavior of short ranged attractive systems, which are characterized by a strong repulsive core besides the attraction. In particular when the range of the attraction becomes much shorter than the typical diameter of the colloids, phenomena like a reentrant glass transition or the existence of two different glassy phases emerge Fabbian1999 ; Bergenholtz1999 ; Dawson2001 . This peculiar behavior has been confirmed by a large number of simulations Puertas2002 ; Zaccarelli2002b ; Puertas2003 ; foffi and experiments Mallamace2000 ; Pham2002 ; Eckert2002 . Notice that, historically, these new findings have been predicted for the first time within MCT calculation and only on a second stage confirmed by experiments. Consequently it is clear that this kind of approach can be extremely useful also for different interaction models. It is interesting now to focus the attention on ultrasoft repulsion (typical for example of a SP solution) and an attraction with different range (which could be typical, for example, of depletion interactions) and to investigate the possibility of new features.
This paper is organized as follows: in section II we present the general framework for our research. In particular, in subsection II.1 we introduce the interaction model we chose to study star polymers in presence of attraction. Then in subsections II.2, II.3 and II.4 we describe the theoretical and numerical tools we used to study the structural properties, the structural arrest and the diffusivity in dense star polymer solutions: MHNC, MCT and MD, respectively. In particular we discuss the application of the modified hypernetted chain integral equation to study the structural properties of star polymer solutions and some test of its accuracy when attractive interactions are taken into account in addition to the entropic contribution.
In section III we consider the effect of attraction on the slow dynamics and structural arrest of star polymer solutions. We carried out a mode-coupling theory analysis which allows us to locate the nonergodicity transition curve of the system, using as input the information on the structure obtained by MHNC. Our aim is to complete the picture of the phase diagram of a star polymer solution in the presence of attractive forces, investigating the dynamics, for the values of the parameters which govern the intensity of the attraction extensively discussed in Ref. artmio . Then we modify these parameters in such a way to consider attractive forces of shorter range, and we focus on the effect of these modifications on the properties of the glass state. In order to test this difference, molecular dynamics simulations have been performed and the diffusivity of SP fluid as been evaluated up to crystallization. In this section we again discuss the structure of the system very close to the glass phase.
Finally in section IV we discuss and summarize our results and we draw our conclusions.
II Introduction to the model and methods of study
II.1 Effective pair interaction
The effective pair interaction between star polymers with arms in a good solvent is purely repulsive and for it reads as follows:
| (1) |
is the corona diameter of the star and depends on the number of monomers of a single arm Da . Witten and Pincus determined by scaling theory the explicit form of such interaction at short distances td47 ; it has been also shown that the good agreement between theory and experiments significantly improves if the model interaction has, in addition to a logarithmic repulsive core, a long range interaction of Yukawa form anom , td49 , td50 , td126 . This model interaction gives a good description of small angle neutron scattering (SANS) results on concentrated star polymer samples td49 for an wide range of values. For a logarithmic-Gaussian potential more accurately describes the effective interaction low2001 but we do not study this regime.
In a previous paper artmio the phase diagram of star polymer solutions has been investigated when the effective interaction between two star polymers contains an additional attractive contribution to be added to the repulsive part of equations (1):
| (2) |
This attraction could stem, for example, from a van der Waals interaction arising from a non perfect matching between the refraction index of the solvent and of the polymer in a way that does not alter the basic configuration of the single star polymer; in this case is independent from the temperature. Alternatively attraction could be induced by depletion interaction when a third component, which is large compared with the solvent molecules but small compared with the star polymers, is present in the solution. In this case has an entropic origin and consequently it depends on . In this situation the size and concentration of the depletant are, respectively, closely tied to the range and strength of the attraction. In what follows we shall use temperature as control parameter.
To study the structural arrest and the dynamics in presence of attractive forces we can use the simplified model potential utilized in ref.artmio where has the functional form of a Fermi distribution, i.e.
| (3) |
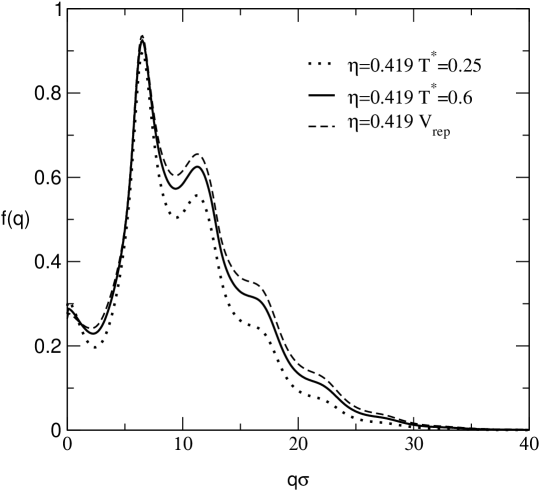
The parameters and control the position and the width of the well potential, is the amplitude of the attractive contribution. For convenience we use reduced units for temperature in terms of : . By a suitable choice of these parameters one can guarantee, for the temperatures of interest, that does not have a significant subsidiary maximum at large and avoid possible complications due to the competition over different length scales. We have studied three sets of parameters and in order to see the dependence of the glass transition on the range and the width of the attractive well. The first case corresponds to the potential discussed in Ref. artmio , i.e. , and we refer to this case as . For these values of the parameters, the attractive contribution is rather long ranged and we found that does not modify the ideal glass transition with respect to the purely repulsive case. For the other two choices of the parameter, corresponding to and and corresponding to and the attractive well is displaced to smaller distance and we observed significant differences for the glass transition with respect to the only repulsive pair interaction. In Fig. 1 we show the shape of the potential in the three cases for . It should be noticed that due to the ultrasoft character of the value of and modifies not only the range of the interaction and the position of the minimum but also the depth of the well potential. In addition, the position and width of the attractive well depends on temperature because scales with . In Fig. 1 we plot also : at short distances we can observe that is softer than .
II.2 Modified hypernetted chain integral equation
In the present work we carry out a Mode-Coupling Theory (MCT) analysis mct of the long-time limit of the correlation functions to locate the ideal glass transition line of the system. MCT provides a set of closed equations to calculate the non-ergodicity parameter which acts as an order parameter for the glass (see II.4). All the information needed to solve these equations is contained in the static structure factor, defined as and in the number density, , being the density fluctuation variable of wave vector . To calculate , we utilized the MHNC integral equation. This equation is in general accurate also when an attractive contribution to the interaction is present MHNC . In the case of star polymers in a good solvent it has been verified the remarkable accuracy of this theory, to describe fluid states as well as metastable states artvetri ; artmio for a large range of and density values.
The starting point for the MHNC equation is an an exact relation Hans , obtained from a cluster expansion, which connects the radial distribution function (rdf) to the interparticle potential :
| (4) |
where and are the pair and the direct correlation function, respectively. is related to by the Ornstein-Zernike equation.
The term , called bridge function, represents a sum of an infinite number of terms, the so called elementary graphs in the diagrammatic analysis of the two-point function and, in general, it is not known. In the MHNC scheme the is replaced by the bridge function of a fluid of hard spheres, , of suitable diameter . To optimize this choice, which depends on the parameter , the free energy is minimized lado1 . This is equivalent to satisfy the relation:
| (5) |
where
In order to implement MHNC one needs the rdf of hard spheres from which one can obtain . Verlet and Weis (VW) A26 provided an accurate parametrization of based on the PY equation with a correction which incorporates thermodynamical consistency through the Carnahan-Starling state equation Hans . This together with equation (4-5) gives a closed set of equations which are solved by a standard iterative method.
In a previous paper some of the authors showed that the dependence of on the density as determined by Eq. (5) is unusual and reflects the features of the interparticles interaction artmio . Moreover in ref.artvetri we found evidence that the characteristic sequence of maxima and minima of versus is directly related to the non-monotonic behavior of the diffusion coefficient as a function of the packing fraction. Indeed the slow dynamics in star polymer systems at low and intermediate densities can be qualitatively described as the slow dynamics of the hard sphere system via a density and functionality dependent effective diameter determined with MHNC closure.
II.3 Molecular Dynamic simulation: comparison between MHNC and MD results on the correlations.
To check the results of the MHNC and MCT calculations, we performed extensive MD simulations for the model described by the potential defined by Eq. (1-3). We simulate particles for different values of the density, temperature and functionality. For each state point the configurations have been equilibrated at constant temperature for a time long enough to ensure both the equilibration and decorrelation from the initial configuration. The acquisition run started after this preliminary preparation, then the system was simulated at constant energy. We carefully checked whether crystallization occurred or not during the run by inspection of the static structure factor, with the same modulus, not averaged over different directions of -vectors. In fact to improve the averages in the calculations of at a given , we generally considered up to independent -vectors chosen with a random direction but with the same modulus . In correspondence of these values, we evaluated the density variables and consequently the static structure factor for a given direction. Finally we averaged on the different directions. For a liquid the structure is extremely disordered and all the terms for different directions give roughly the same contribution to the average. When the structure factor corresponding to a certain direction starts to grow over the others, the system begins to show a preferable direction, i.e. crystallization takes place. When a configuration crystallized we discarded it. As discussed for the purely repulsive case artvetri , the system has a strong tendency to crystallize, being monodisperse in diameter foffi . Consequently, we will test our predictions only when the system remains in the liquid phase, a future direction of our research may be directed toward the suppression of crystallization introducing, for example, a second component slightly different in diameter foffi . We chose as unit of length the corona diameter and as unit of mass the mass of the particles. Moreover we measure the temperature in reduced units, i.e. .
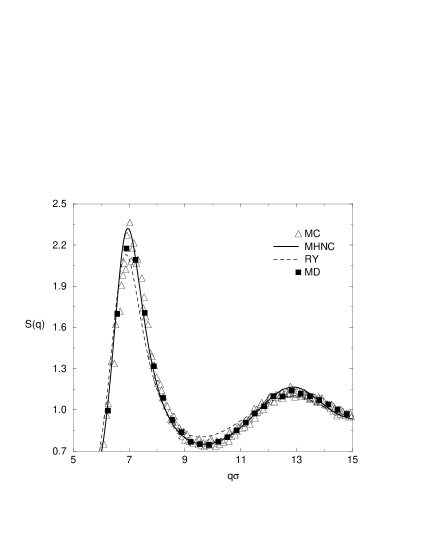
We begin our discussion on the numerical simulation by discussing the purely repulsive case, i.e. . As extensively described in ref. artmio , MHNC gives a very accurate description of correlations for star polymers in a good solvent for a wide range of densities. In Fig. 2 we present results for the repulsive case, for and obtained from MHNC and Rogers-Young (RY) theoretical calculations and from MC and MD simulations 57footnote The RY equation is another integral equation for which interpolates between PY and HNC equations RYY . The agreement between MD and MHNC, and between MD simulations and MC simulations, is extremely good. The small apparent MD underestimation of the main peak is due to the grid we used in the simulations. A more refine grid, however, would increase the noise in the data. On the other hand RY shows some significant discrepancies with respect to simulations results in the range of strong coupling which emerges for packing fractions of order of and artmio . By comparison with simulation results (both MC and MD) we definitively conclude that MHNC describe accurately the structure of star polymers in a good solvent.
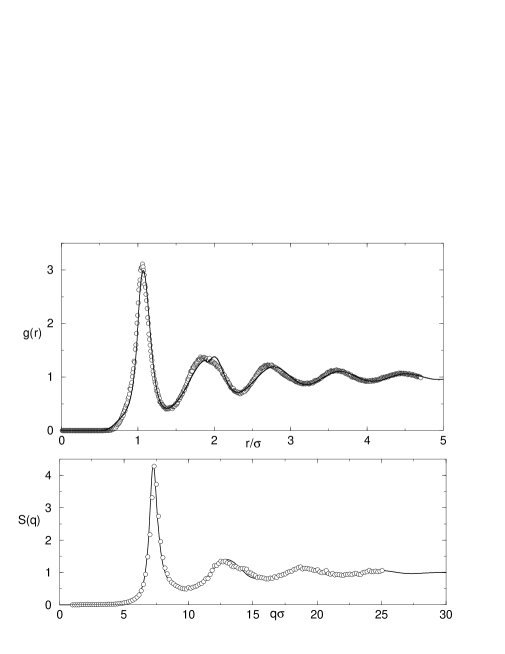
Hence, we focused on the attractive case and we compare the MD results and the prediction of the MHNC theory for the fluid case: in particular we compared the radial distribution function and the structure factor for the three different models of the attraction described in section II.2 in a regime of strong coupling when the main maximum of reaches large values. The temperatures and packing fractions we have chosen in our study, correspond to states of interest in the study of the ideal glass transition line, i.e. close to the fluid-glass and glass-fluid ideal transition line. We find in general a very good agreement between MD results and MHNC results for all the values of temperature, packing fraction and arm number investigated. In particular a good accuracy is achieved in the determination of the position of the main peak in the radial distribution functions and structure factors. Only for states at low temperature and at packing fraction corresponding to very large coupling (e.g. see Fig. 3) one notices some small discrepancies between MHNC and MD results.
This analysis confirms the accuracy of the MHNC integral equation in describing the structure of an ultrasoftcore potential also in presence of an attractive contribution at longer range.
One can notice that the MHNC has some structure in the region of the second maximum and this can even show up as a subsidiary maximum (Fig. 3). It is known MHNC that this spurious structure is a consequence of the VW parameterization of in terms of the PY solution but it is believed that this anomaly has no serious consequence in .
II.4 Mode Coupling Theory for the Ideal glass transition
In this section, we shall briefly review the nature of MCT, and discuss the type of information it yields. The MCT of super-cooled liquids describes the dynamical transition by a nonlinear integro-differential system of equations for the normalized time correlation functions of density fluctuations , where . As discussed above, the only input to the MCT equations are the equilibrium static structure factor, and the number density, . The glass transition can be identified by studying the long time limit of the MCT equations, which determine the non-ergodicity parameter of the system . An ergodic state is characterized by . This value is always a solution of the MCT long-time limit equations mct .
The quantity obeys the equation . Here, the mode-coupling functional is
given by
| (6) |
Equation 6 together with the equation for can be derived by taking the long time limit, , of the MCT equations mct . The mode-coupling vertices are determined by the structure factor , the direct correlation function , and the density :
| (7) |
The direct correlation function is directly related to the static
structure factor by the relation
. The glass
transition appears as an ergodic to non-ergodic transition for the
system, where solutions arise. These transition points
correspond to bifurcation singularities of the MCT
Eq. (6-7).
In the present
work, we numerically solved
Eq. (6-7) with an iterative
procedure over a grid of equi-spaced q-vectors up to
. For the static structure factor we used the static MHNC
structure factor calculated as described above.
III Results
III.1 : MCT and MD results
First of all we considered the model potential we labeled . At low temperature the system has fluid-fluid phase transition with two critical points: the first critical point is around and , the second one around and . Far from the critical point, we observed that the structure factor , relative to the potential , is not very different from the structure factor relative to the simply repulsive interaction . In particular the position of the main peak does not change appreciably and its height change for less than (). Consequently one might expect that the location of the ideal glass transition will not be different from the repulsive case artvetri . Indeed this is the case. We studied several arm numbers (from low value, to higher one ) for several values of the packing fraction with MCT. Similarly to the case of purely repulsive interaction we deduce that below there is no glass phase. For the system is fluid for low densities and glass for intermediate (), but it is still fluid at high densities (). When the system is in a glass state for intermediate and very high densities (, ). Finally above the system is fluid for low densities () and in a glass state for intermediate and high densities ().
Hence, the effect of the attraction does not change the location of the ideal glass transition. Consequently, in the temperature-packing fraction plane, the ideal glass transition line would be trivially represented by a vertical line.
We also performed molecular dynamic simulations to calculate the dependence of the diffusion coefficient, from the long time limit of the mean squared displacement, varying the temperature, for different values of and the packing fraction. This analysis supported the MCT predictions, i.e. the diffusion coefficient does not change appreciably with the temperature.
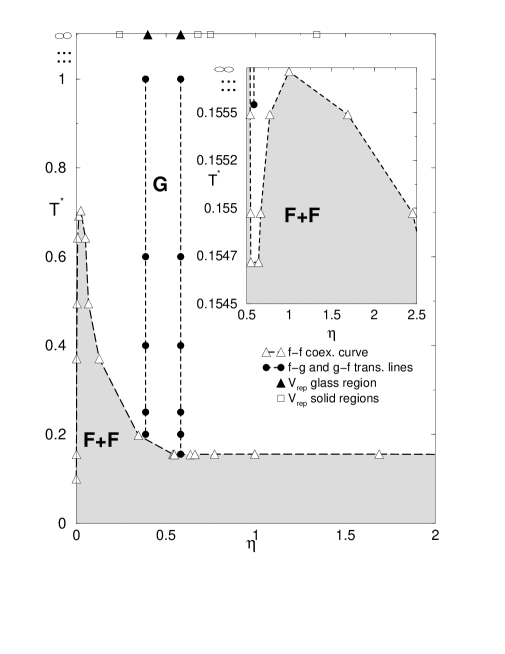
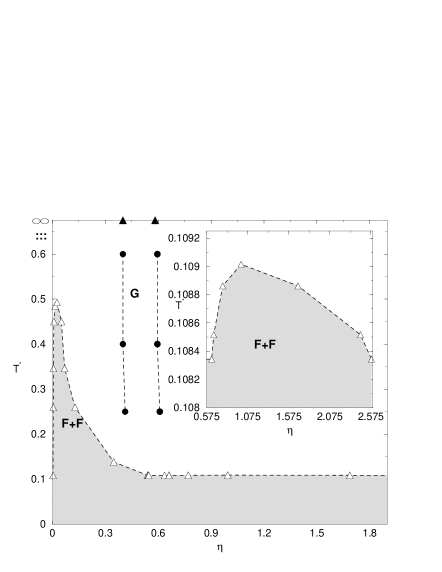
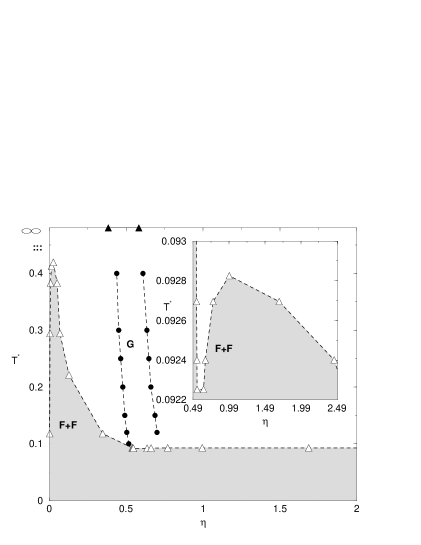
Starting from the behavior of the structure factor changing the temperature and from the analysis of the structural arrest we performed, we can complete the picture of the phase diagram. For there is no freezing transition: the two fluid-fluid phase transitions represent stable states; for all the density region above the density corresponding to the triple point is occupied by crystalline phases; for bot the fluid-fluid phase transitions and their critical points persist as stable states. In Fig. 4 we describe the whole phase diagram for : the fluid-fluid phase diagram is calculated by means of mean field theory and the ideal glass transition lines determined with MCT. At the equilibrium the region around the second critical point becomes metastable with respect to the freezing, the regions between two successive squares (from low to high densities), in the upper part of the figure, indicate the densities where the system is solid (data are MC results reproduced by Watzlawek et al. Phtd ). If the crystallization can be avoided we can observe that the second critical point lies outside the glassy region (see also the inset). The limit of very high temperatures, i.e. the purely repulsive interaction are also shown in Fig. 4: the densities which delimit the glass region are effectively the same with and without attractive interaction.
We conclude that, varying , the first critical point will always lie outside the glass region. The second critical point, however, will enter the glassy phase for .
III.2 : MCT and MD results
As anticipated above we tried to tune the parameters A and B in order to enhance the effect of the attraction on the shape of the glass-transition line. Our aim was to shrink the well and move the minimum of the pair interaction close to sigma.
First of all we consider the parameters an (). As we see in Fig. 1 the well potential in this case is shrunken approximately by with respect to and the position of the minimum is changed approximatively by (). If compared to the depth of the well potential changed from with respect to at lower temperature till approximatively around .
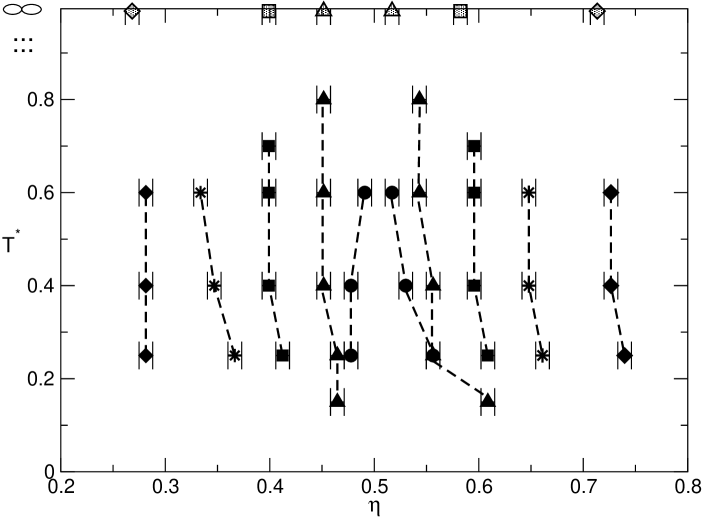
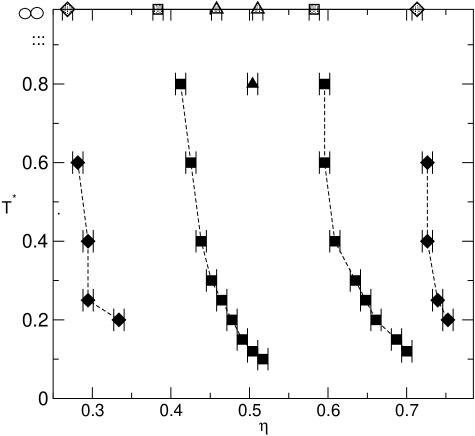
In Fig. 5 we present the occurrence of the glassy phase for different numbers of arm and as a function of temperature. For we can summarize our results as follows: for high temperatures the two ideal-glass lines (fluid-glass on the left and glass-fluid on the right) tend to the repulsive case artvetri . On lowering the temperature, however, a fluid-stabilizing effect sets in, so that the fluid-glass line tend to move to larger values of the density. So in the low density region, roughly below , there is the possibility of the glass melting when lowering the temperature. In this case increasing the temperature, the width of the nonergodicity parameter , which is a measure of the inverse of the cage localization length, gets larger (see Fig. 6). Moreover we observe an increase of lowering the temperature, corresponding to densities closer the coexistence curve. The effect of the attraction for large value of is very small and in particular for we can see that the fluid-glass line is again very similar to the repulsive case. On the right side of the glass region we can observe that the glass-fluid line move to higher densities when the temperature decreases and consequently when the intensity of the attraction increases. In contrast to the low density case, the attraction now favors the formation of the glass to higher density with respect to the repulsive case. On lowering the temperature the nonergodicity parameter presents a larger width in . This clearly indicates that the particles are localized on a shorter length scale. This phenomenon could be related either to the effect of a stronger attraction or to a larger value of the effective repulsive length. It is interesting to stress that in all the cases taken into account the non-ergodicity parameter, presents the typical shape of a repulsive glass, i.e. a glass that possesses a structure dominated by the caging effect. This typical repulsive behavior is characterized by oscillations in correspondence to the peaks of the static structure factor with a maximum at the first peak. It has been shown, both by MCT calculations Dawson2001 and computer simulations Zaccarelli2002b , that for sufficiently short-ranged attraction a new glass, that has been named attractive glass, emerges. Indeed the shape of the for an attractive glass is completely different: the oscillations are very weak and the maximum is not so pronounced. In our investigation we encountered fingerprints only of the repulsive glass. The effect of the attraction and the interplay between attraction and repulsion, seem to act more on the size of the cages and on their formation rather than on the nature of the arrest itself. However we have not investigated the case of very narrow attractive wells on the length scale of .
The behavior of star polymers with is different: we can observe that the attractive contribution of the interaction favors the occurrence of glass states at low temperature. Indeed for this value of the functionality, a stable glass phase emerges at a temperature from the solution of MCT equations and the density range of the glass phase gets larger on further decrease of the temperature. In this case the q-width of increases lowering the temperature, both for and . It is interesting to note that no glass transition is found in the corresponding repulsive case, i.e. in the limit of high temperature.
In the so called “repulsive glasses” the occurrence of the ideal glass transition in the framework of the MCT depends strongly on the behavior of the main peak of the structure factor, i.e. on the first neighbor interactions.
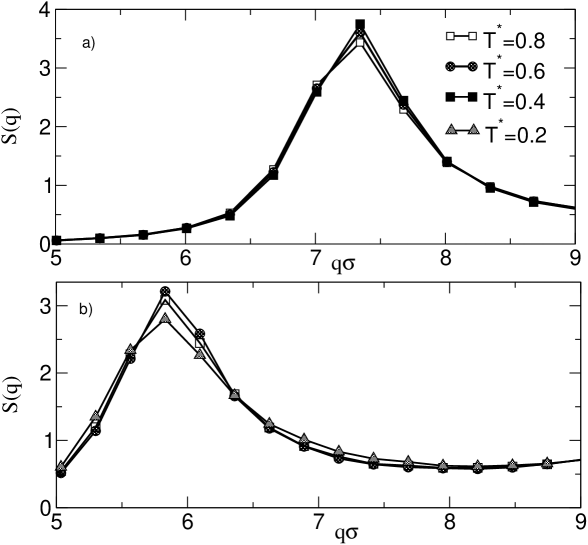
In Fig. 7, we can observe a magnification of the main peak of the structure factor for and two different packing fractions on the left and on the right side of the ideal glass region (MD simulations). For the different temperature investigated we observe the same trend: for (Fig. 7-) decreasing the temperature the main peak of the structure factor decreases, showing a loss of the correlation between particles. The opposite trend is observed on the right side, (Fig. 7-). We also studied the behavior of the first peak in the structure factor for , in this case the trend in the glass region is represented by an increase of the main peak lowering the temperature, indeed this effect is responsible for the anomalous formation of the glass at this value of the functionality.
This preliminary and qualitative study, has been supplemented by a more thorough analysis: we performed molecular dynamic simulation for several values of , and .
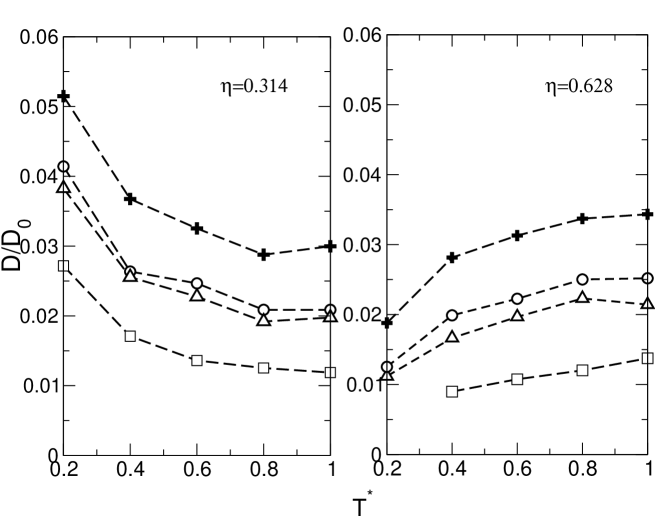
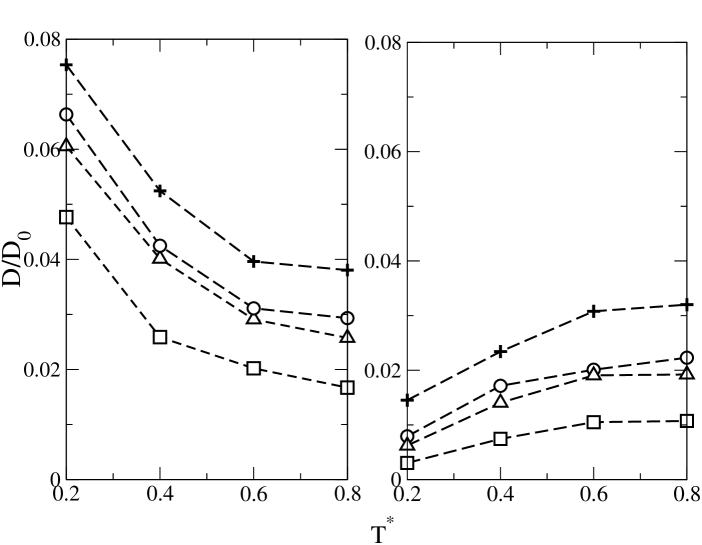
In Fig. 8 we show the diffusion coefficient as a function of the temperature calculated for packing fraction not far from the glass region and for different values of (). In the present context data for are normalized by , in order to take into account the temperature dependence of the microscopic time foffi . The MD-diffusion coefficients as a function of confirm the MCT trend. On the low density side of the glass region the diffusion coefficient decreases increasing the temperature while on the high density side the diffusion coefficient increases increasing the temperature. The values of , for fixed temperature, decrease increasing ; we remark that for the system does not show glass transition.
In general it has been observed that the effect of the presence of a glass transition can be noticed as a decrease in the diffusivity also far from that part of the phase diagram where the structural relaxation time starts to grow. Indeed this has been encountered, for example, in a monodisperse square well system foffi and in a purely repulsive soft potential artvetri . In MD simulations both these systems presented a strong tendency to crystallize. However, studying the behavior of the diffusivity, it is possible to pin down the shape of the glass transition line. Also in the present work we managed to check that the diffusion follows the MCT predictions. The fact that the trend could not be checked, i.e. an increase of the diffusivity on rising the temperature for both high and low density region, could be related to the fact that the simulations should be run closer to the glass transition and, unfortunately, this is not feasible due to the occurrence of the crystallization. One way around this problem would be to extend the results to a system that presents a smaller crystal nucleation rate. For the square well system, for example, this has been accomplished considering a binary mixture Zaccarelli2002b .
Summarizing we remark, for the different arm numbers investigated, that for the attraction seems to determine a destabilization of the cages while for the attraction facilitate the formation of the glass for higher density with respect to . The most peculiar behavior has been found for a value of () for which the glass lines are very near to the value of . For this packing fraction star polymers start to interpenetrate widely. We emphasize that, considering stars in a good solvent at the equilibrium, this value is just in the middle of the bcc () or fcc () crystal phase. Related to the behavior of the structure factor corresponding to , we expect that also the densities where the system is solid, at the equilibrium, could change weakly with respect to the repulsive case. We will return more in detail on this point in the section relative to conclusions and discussion.
Finally we show in Fig. 9 the position of the ideal-glass lines with respect to the fluid-fluid coexistence curves for . It turns out that the temperature should be decreased a lot to notice possible effects of the density fluctuations around the second critical point on the ideal glass transition line.
III.3 : MCT and MD results
The third case we considered is characterized by and , and we indicated it . In this case the width of the well potential decreased, with respect to , from approximatively at till at . The position of the minimum is changed by less than . If compared to the depth of the well potential changed from with respect to at lower temperature till approximatively around .
In Fig. 10 the occurrence of the glass phase is shown for for a wide range of temperatures. We analyzed in more detail the case as here we expect very different behaviors from the three cases in exam.
For the qualitative behavior is very similar to that of . For densities below the glass region the influence of the attractive term, when lowering the temperature, is a liquid-stabilizing effect. In the opposite regime (densities above the glass region), increasing the intensity of the attractive contribution results in moving the glass-fluid line to higher densities with respect to . We point out that here the curvature of the lines is more pronounced than in the case. Anyway comparing all the cases investigated is not trivial: this is in part due to the fact that a correct rescaling of the temperature should be done considering the change in the depth and the position of the well potential changing , and , rather than the amplitude of the attractive term. We will return on this point in section IV.
For the behavior of the star polymer solution is completely different from the previous cases. Indeed for it exists a value of the temperature, , below which the system does not present a glass transition. For we do not observe any glass phase for all the temperature values investigated ().
As for the previous case, we performed MD simulations for different arm numbers and temperatures, confirming the MCT result: the trend of is qualitatively the same as for (see Fig. 11). For we do not capture the increasing of the diffusivity when decreasing the temperature, as we expect on the basis of the MCT results on the right side of the glass region. As in the previous case this might be due to the fact that we did not consider packing fraction close enough to the ideal glass lines.
Finally we studied the behavior of the structure factor, changing the temperature, for . As for , we calculated on the left and on the right side of the ideal glass region (MD simulations).
For the trend is the same observed for , i.e. on decreasing the temperature for the main peak of the structure factor decreases, showing a loss of the correlation between particles. The opposite trend is observed on the right side ().
For the behavior of the structure factor is different. In Fig. 12-, we present a magnification of the main peak in the structure factor for and (right side of the glass region). The picture shows a decrease of the main peak of lowering the temperature. Moreover in Fig. 12- we present a magnification of the main peak in the structure factor for the same arm number and , (left side of the glass region). The trend is exactly the same as for : we stress that, introducing attractive forces, star polymer solutions of arms, show a loss of correlations among particles which are responsible for the peculiar MCT predictions (Fig. 10). This effect is enhanced as the interaction is increased.
Moreover we also studied the behavior of the structure factor for and , in this case the trend is represented by a decrease of the main peak lowering the temperature. We observed that the height of the main peak introducing the attractive contribution and increasing the intensity of the attraction is in any case smaller than the peak height relative to . We recall that for , MCT does not give a glass phase neither for nor for .
Summarizing we can argue from Fig. 10 that for the model interaction when the attraction seems always to determine a destabilization of the cages, while for packing fractions larger than the attraction facilitates the formation of the glass for higher density with respect to . For (corresponding to the region of interest for ) the effect of the attraction seems to determine a destabilization of the cages only.
In Fig. 13 we present the fluid-fluid phase diagram and the glass transition lines for .
We conclude this section remarking that, so far, we discuss about the behavior of the first peak in only, while the second peak in the structure factor does not change appreciably in all the cases investigated.
IV Conclusions and Discussion
In this work, we studied the structural arrest and the dynamics in star polymer solutions when attractive forces between macroparticles are present. The model potential we used to describe the interactions presents an ultrasoft repulsive term of entropic origin at short range plus an attractive interaction at longer range. Due to the addition of the attractive contribution between star polymers the repulsive core becomes softer on lowering the temperature and consequently increasing the intensity of the attraction. We analyzed three different forms of the pair interaction between stars, considering attractive forces of shorter and shorter range. In this paper we focused on stars with several arm numbers (from low value, to higher one ) at several values of density and temperature.
We examined the structure of the solution solving MHNC closure and performing extensive MD simulations, in this way we tested the accuracy of the MHNC to describe the properties which arise from such choice of the interaction model. Over the full range of densities and temperatures of interest MHNC and MD simulations are in a good agreement. Hence we have been able to conclude that MHNC is a good approximation to study systems described by ultrasoft-core repulsive interactions, with and without attractive forces between macroparticles. Having tested the accuracy of the MHNC approach, we focused our attention on the location of the ideal glass transition, studied within MCT.
In particular for the case characterized by the longer range of the attraction, named , the ideal-glass transition line we obtained is not significantly modified in comparison with the one obtained for the purely repulsive potential. Indeed both the structure and the dynamics of the solution are not significantly modified by introducing the attractive contribution. On the other hand the two other systems characterized by a shorter attractive range show some significant differences with respect to the purely repulsive pair interaction.
For and , show the same qualitative behavior. In particular we can distinguish two regions in density, a low density regime () and a high density regime () where the system, in both cases, behaves differently. For low densities, on lowering the temperature, a liquid-stabilizing effect due to the attractive forces sets in, so that the liquid-glass transition line moves to larger values of the density. Indeed, this is an interesting effect since it presents the possibility to pass from a glass phase to a liquid phase decreasing the temperature. It is perhaps worth making a few remarks about this issue. It is now well established that systems characterized by a step repulsion and a short range attraction, possess a reentrance in the the dynamical arrest. In these systems it is possible to melt the glass by lowering the temperature. This is a phenomenon now well established in theory, simulations and experiments P1 ; P2 ; P3 ; P4 ; ken . Clearly, one would be tempted to relate our findings to this phenomenology of colloidal solutions; however we showed that the origin of such effect in our case is different. For short range attractive colloidal systems at low temperature there is a glass phase originated solely by attraction and the reentrant melting arises from the competition between the high temperature and low temperature regime. For our system, however, there is no indication of an attraction dominated glass at low temperature and the destabilization of the glass is due to the destabilization of the cages that, in the high temperature regime, are responsible of the arrest. For , we found that the glass-fluid line moves to higher densities when the temperature decreases. As consequence increasing the intensity of the attraction, for a fixed density and arm number, the system moves from a liquid to a glass. This behavior is closely connected to the ultrasoft nature of the pair interaction. We recall that stars in a good solvent shows a remelting of the glass phases (or solid phases at the equilibrium) for very high densities. The addiction of attractive forces moves the glass-fluid line to higher densities. We could explain this effect as a contribution of the attraction to stabilize the cages and then to inhibit the remelting of the solution.
For the behaviors of and are very different. In the case for we observed the qualitative behavior found for , while for there exists a value of the temperature, , below which the system does not present any sign of a glass transition. For considering we observed the presence of a glass transition, while for the simply repulsive interaction this transition is not present for such value of , i.e. the attraction seems to facilitate the formation of the glass. In the case we did not observe glass phases for all the temperature values investigated. So in this case the effect of the addition of the attraction is a destabilization of the cages only.
To verify the MCT results we performed the analysis of the dynamics by means of MD simulations. As introduced in section III.1, the range of density which we examined is not sufficiently close to the ideal glass lines. For density closer to the transition lines (mainly for ) the system show a strong tendency to the crystallization. So we verify our MCT predictions for .
From the whole analysis performed, we evidenced a value of the packing fraction, i.e. , which marks a change in the behavior of the solution. This value could be traced back to the cross-over between the two different functional forms of the repulsion: the logarithmic form and the Yukawa one. For star polymers in a good solvent , the so called overlap packing fraction, corresponds to the packing fraction above which the radial distribution function show a coordination shell inside the logarithmic core. In other words for stars start to interpenetrate widely. Also in this case the cross-over designates approximatively the transition of the system through two different regimes. For the response of the system to the introduction of attractive forces is a destabilization of the cage. This is mainly due to the change in the repulsive contribution at short distances which become softer and softer considering respectively , and . For stars interpenetrate more and more. The effect of the attraction seems to inhibit the remelting of the solution and the glass-fluid line move to higher densities. The shift of the transition line could be understood considering the effect of the attraction on the second shell of neighbors. Indeed if we look the radial distribution function very close to the glass-fluid transition line, at low temperature, we observe that the second shell of particles is around . In this region, see Fig. 1 we can observe that the system feels stronger attractive forces passing from to and then to . We conjecture that this attraction on the second neighbor shell is at the origin of the extended stabilized region of the glass phase for higher densities.
We have to remark some details relative to our analysis: first of all does not present considerable repulsive maxima for large when the temperature is lower than for and for . Obviously the repulsive contribution at longer range is more pronounced for higher temperature (when the intensity of the attraction diminishes) and low arm numbers (when the Yukawa pair interaction decay to zero very slowly). Anyway, also below these temperatures, where the pair interaction shows small repulsive contribution at large (around ), we verify that our MCT predictions do not depend on the existence of the repulsive shoulder. Indeed we performed the same MCT calculation with a truncated potential in which the repulsive shoulder is suppressed. We conclude that for the temperature and densities of interest in our study the presence of this small repulsive contribution at large distance does not alter the picture of the glass regions. We emphasize that the presence of the shoulder is not an effect of our particular choice of the attractive contribution: due to the ultrasoft-core repulsion and to the Yukawa repulsive contribution at long range the introduction of attractive forces of shorter range (i.e. depletion forces) could determine an additional repulsion outside the core.
Since the potential presents an ultrasoft-core interaction, it is difficult to determine a natural scale of energy (and length scale). We decided to rescale the temperature with respect to the integrated intensity of the attractive contribution () in such a way to compare our results in a more significant way.
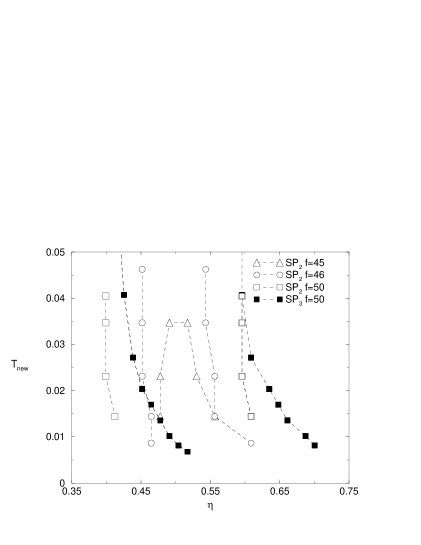
In Fig. 14 we present the comparison between the MCT data obtained for considering the and models. As we can observe for the effect of destabilization of the cages as well as the inhibition of the melt is more accentuated for .
Finally and show an apparent conflicting behavior concerning . Due to the very small range of it is very difficult to understand this peculiar behavior starting from the pair interaction. As we remind above, is a value for which star polymers in athermal solvent, at the equilibrium, are in a solid phase and in particular is just in the middle of the solid region (). Around this region we find, that the system has a very strong tendency to crystallize. Indeed, despite the change observed in the structure factor, and considering the connection between equilibrium phase diagram and glass transition line (artvetri ), we expect for and a small shift of the solid region with respect to the purely repulsive case. Notice that this region corresponds to the glass region we determined for stars with . It is not surprising that our data in the case of show an ambiguous trend between and . For the above mentioned reasons we do not believe it is very interesting to analyze further on .
We conclude from this analysis that the details of the phase diagram, concerning glass transition, is very sensitive to the particular, specific form of the attractive contribution. This could be mainly connected to the change of the short range repulsive contribution when attractive forces between stars are introduced and not dependent on the choice of the specific model. We expect the same behavior also considering depletion forces. Moreover in the case of a general mixtures of micelles with hydrophobic group at the ends of the polymer chains, as discussed in section II, the attractive contribution will be at very short range and close to interparticle separation equal to . This determines a change in a repulsive interaction in the region where in star polymer solution there is a cross over between the logarithmic form and the Yukawa one. We decide to complete our analysis considering a specific system described by specific attractive forces. Starting from this analysis a future perspective of our work on star polymer solutions is a more direct comparison between theory and experiments about the origin and the description of the attractive interaction. In this sense we decided to turn our attention, more in general, on systems of micelles which can be described by soft-core potential plus attraction at shorter range, similar to star polymer macromolecules. There exist many reasons to further study star polymer solutions: a precise understanding of their properties will give the possibility to make progress in the exploration of ‘hybrid’ polymeric-colloidal materials such as irregular multiarm stars, self-organized structures resulting from telechelic linear homopolymers and copolymers, polyelectrolyte brushes, micelles with chemically fixed cores.
Acknowledgments
Funded in part by a grant of the Marie Curie program of the European Union, Contract Number : MRTN-CT2003-504712. F. Lo Verso acknowledges financial support from INFM. G. Foffi and P. Tartaglia acknowledge financial support from MIUR-COFIN and MIUR-FIRB and thank Francesco Sciortino for useful discussions.
References
- (1) The upper size limit of a colloidal particle is normally set at a radius of -.
- (2) R. J. Hunter, Foundations of Colloid Science 1 Oxford University Press, (1987).
- (3) P. N. Pusey (1948), Colloidal Suspension in: Les Houches J. P. Hansen, D. Levesque, J. Zinn Justin (Eds.), Elsevier, Amsterdam.
- (4) C. N. Likos, S. Rosenfeldt, N. Dingenouts, M. Ballauff, P. Lindner, N. Werner, F. Vögtle, J. Chem. Phys. 117 1869 (2002).
- (5) P. G. Bolhuis, A. A. Louis, J. P. Hansen, E. J. Meijer, J. Chem. Phys. 4 4296 (2001).
- (6) Grest G. S., Fetters L. J., Huang J. S., Richter D., Adv. Chem. Phys. XCIV 67 (1996).
- (7) L.-L. Zhou, J. Roovers, Macromolecules 26 963 (1993).
- (8) J. Roovers, L.-L.Zhou, P.M. Toporowski, M. van der Zwan, H. Iatrou, N. Hadjichristidis, Macromolecules 26 4324 (1993).
- (9) T. A. Witten, P. A. Pincus, Macromolecules 19 2509 (1986).
- (10) M. Watzlawek, H. Löwen, C. N. Likos, J. Phys.: Condens. Matter) 10 8189 (1998).
- (11) M. Watzlawek, C. N. Likos, H. Löwen, Phys. Rev. Lett. 82 5289 (1999).
- (12) B. Groh, M. Schmidt, J. Chem. Phys. 114 5450 (2000).
- (13) W. D. Dozier, J. S. Huang, L. J. Fetters, Macromolecules 24 2810 (1991).
- (14) L. Willner, O. Jucknischke, D. Richter, J. Roovers, L.-L. Zhou, P. M.oporowski,L. J. Fetters, J. S. Huang, M. Lin, N. Hadjichristidis, Macromolecules 27 3821 (1994).
- (15) C. N. Likos,H. Löwen,M. Watzlawek, Abbas,O. Jucknischke, J. Allgaier, D. Richter, Phys.Rev.Lett. 80 4450 (1998).
- (16) K. Ishizu, Progr. Polym. Sci. 23 1383 (1998).
- (17) G. A. McConnell, P. A. Gast, J. S. Huang, S. D. Smith, Phys. Rev. Lett. 71 2102 (1993).
- (18) G. A. McConnell, A. P. Gast, Phys. Rev. E 54 5447 (1996).
- (19) G. A. McConnell, A. P. Gast, Macromolecules 30 435 (1997).
- (20) C. N. Likos, H. M. Harreis, Cond. Matt. Phys. 5 173 (2002).
- (21) J. Stellbrink, J. Allgaier, M. Monkenbush, D. Richter, A. Lang, C.N. Likos, M. Watzlawek, H. Löwen, G. Ehlers, P. Schleger, Progr. Colloid Polym. Sci. 115 88 (2000).
- (22) D. Vlassopoulos, G. Fytas, T. Pakula, J. Roovers,J. Phys.: Condens. Matter 13, R855 (2001).
- (23) M. Kapnistos, D. Vlassopoulos, G. Fytas, K. Mortensen, G. Fleischer, J. Roovers, Phys. Rev. Lett. 85 4072 (2000).
- (24) B. Loppinet, E. Stiakakis, D. Vlassopoulos, G. Fytas, J. Roovers, Macromolecules 34 8216 (2001).
- (25) E. Stiakakis, D. Vlassopoulos, C. N. Likos, J. Roovers, G. Meier, Phys. Rev. Lett. 89, 208302 (2002).
- (26) E. Stiakakis, D. Vlassopoulos, B. Loppinet, J. Roovers, G. Meier, Phys. Rev. E 66, 051804 (2002).
- (27) W. Götze, in Liquids, freezing and glass transition, edited by J. P. Hansen, D. Levesque, J. Zinn-Justin (North Holland, Amsterdam, 1991), p. 287.
- (28) F. Sciortino, Nature Materials, 1, 145 (2002) News and Views.
- (29) K. A. Dawson, Curr. Opin. Colloid Interface, 7, 218 (2002).
- (30) G. Foffi, F. Sciortino, P. Tartaglia, E. Zaccarelli, F. Lo Verso, L. Reatto, K. A. Dawson, C. N. Likos, Phys. Rev. Lett., 90, 238301/1 (2003).
- (31) F. Lo Verso, M. Tau, L. Reatto, J. Phys.: Condens. Matter 15 1505 (2003).
- (32) A. Parola, L. Reatto, Phys. Rev. A 31 3309 (1985).
- (33) An ample review of HRT is contained in: A. Parola, L. Reatto, Adv. Phys. 44 211 (1995).
- (34) F. Barocchi, P. Chieux, R. Fontana, R. Magli, A. Meroni, A. Parola, L. Reatto, M. Tau, J. Phys.: Condens. Matter 9 8849 (1997).
- (35) A. N. Semenov, J.-F. Joanny, A. R. Khokhlov, Macromolecules 28 1066 (1995).
- (36) F. Laflécle,T. Nicolai, D. Durand, Gnanou Y., Taton D. Macromolecules 36 1341 (2003).
- (37) F. Laflécle, D. Durand, T. Nicolai Macromolecules 36 1331 (2002).
- (38) L. Fabbian, W. Götze, F. Sciortino, P. Tartaglia, and F. Thiery, Phys. Rev. E 59 R1347 (1999).
- (39) J. Bergenholtz, M. Fuchs, Phys. Rev. E 59 5706 (1999).
- (40) K. A. Dawson, G. Foffi, M. Fuchs, W. Götze, F. Sciortino, M. Sperl, P. Tartaglia, T. Voigtmann, E.Zaccarelli, Phys. Rev. E 63, 011401 (2001).
- (41) A. Puertas, M. Fuchs, and M. Cates, Phys. Rev. Lett. 88 098301 (2002).
- (42) E. Zaccarelli, G. Foffi, K. A. Dawson, S. V. Buldyrev, F. Sciortino, and P. Tartaglia, Phys. Rev. E 66 041402 (2002).
- (43) Antonio M. Puertas, Matthias Fuchs, and Michael E. Cates , Phys. Rev. E 67 031406 (2003).
- (44) G. Foffi, K. A. Dawson, S.V. Buldyrev, F. Sciortino, E.Zaccarelli, P. Tartaglia, Phys. Rev. E 65, 050802 (2002).
- (45) F. Mallamace, P. Gambadauro, N. Micali, P. Tartaglia, C. Liao, and S.-H. Chen, Phys. Rev. Lett. 84 5431 (2000).
- (46) K. N. Pham, A. M. Puertas, J. Bergenholtz, S. U. Egelhaaf, A. Moussa d, P. N. Pusey, A. B. Schofield, M. E. Cates, M. Fuchs, and W. C. K. Poon, Science 296 104 (2002).
- (47) T. Eckert and E. Bartsch, Phys. Rev. Lett. 89 125701 (2002).
- (48) M. Daoud, J. P.Cotton, J. Physique 43 531 (1982).
- (49) D. Richter, O.Jucknischke, L. Willner, L. J. Fetters, M. Lin, J. S. Huang, J.Allgaier, J. Roovers, C. Toporovski, L.-L.Zhou, J.Physique IV 3, 3 (1993).
- (50) J. Buitenhuis, S. Förster, J. Chem. Phys. 107 262 (1997).
- (51) A. Jusufi, J. Dzubiella, C. N. Likos, C. von Ferber, H. Löwen, J. Phys.: Condens. Matter 13 6177 (2001).
- (52) F. Lado, S. M. Foiles, N. W. Ashcroft, Phys. Rev. A 28 2374 (1983).
- (53) J. P Hansen, I.R. McDonald, Theory of Simple Liquids, (Academic, London, 1986)
- (54) F. Lado, S. M. Foiles, N. W. Ashcroft Phys.Rev A 28 2374 (1983).
- (55) L. Verlet, J-J Weis Phys.Rev A 5 939 (1972).
- (56) The RY and MC results are obtained by Watzlawek et al., see Ref. anom .
- (57) F. J. Rogers, D. A. Young, Phys. Rev. A 30 999 (1984).
- (58) K. N. Pham, A. M. Puertas, J. Bergenholtz, S. U. Egelhaaf, A. Moussa d, P. N. Pusey, A. B. Schofield, M. E. Cates, M. Fuchs, W. C. K. Poon Science 296 104 (2002).
- (59) A. M. Puertas, M. Fuchs, M. E. Cates Phys. Rev. Lett. 88 098301 (2002).
- (60) F. Mallamace, P. Gambadauro, N. Micali, P. Tartaglia, C. Liao, S.-H. Chen Phys. Rev. Lett. 84, 5431 (2000).
- (61) T. Eckert and E. Bartsch Phys. Rev. Lett. 89 125701 (2002).
FIGURE CAPTIONS
-
FIG. 1.
versus the interparticle separation for two different temperature and ; . We call the interaction studied in ref.artmio i.e. , , the interaction corresponding to and , finally corresponds to and . In figure we also show corresponding to .
-
FIG. 2.
Athermal solvent: comparison between the main peak of the structure factors we obtained with MHNC closure and MD simulation, with the results obtained by Watzlawek et al. by means of MC simulation and RY closure; , . ( versus )
-
FIG. 3.
Comparison between the radial distribution function (top) and the structure factor (bottom) we obtained with the MHNC closure (solid line) and MD simulation (opaque circles); , , , .
-
FIG. 4.
fluid-fluid phase diagram (opaque triangles up) for a star polymer solution calculated by means of mean field theory and the ideal glass transition lines (filled circles) determined with MCT, which delimit the region where the system is a glass. The inset shows a magnification of the coexistence curve at higher density artmio . On the top of the main figure we present some results about the purely repulsive interaction, which corresponds to the limit of very high temperature: two successive squares (from low to higher densities) delimit the regions where the system is solid at the equilibrium (by Watzlawek et al., MC simulation Phtd ); the filled triangles up represent the densities which delimit the glass region. Notice that the second critical point survives with respect to the glass transition while the region around the second critical point becomes metastable with respect to the freezing. Moreover we can observe that the densities which delimit the glass region are effectively the same with and without attractive interaction.
Lines are simply a guides to the eye.
-
FIG. 5.
MCT fluid-glass and glass-fluid lines (computed with MHNC) for different values and , (): reduced temperature versus reduced packing fraction . Opaque symbols, circles, triangles, squares, stars and diamonds, correspond respectively to . In the region between two line, fixed , the system is in a glass phase. The equivalent symbols on the top of the figure delimit the glass regions for . We recall that in the limit of T very large we return to the simply repulsive system.
Lines are simply a guides to the eye.
-
FIG. 6.
: nonergodicity parameter versus for stars with , . Notice the smaller width of this parameter for high temperatures.
-
FIG. 7.
, : magnification of the structure factor (main peak) we obtained with MD simulations at different temperatures. , ; .
-
FIG. 8.
Reduced diffusion coefficient (MD) for different values and , (). The symbols, plus, circles, triangles, squares, correspond respectively to (left panel , right panel ).
Lines are simply a guides to the eye.
-
FIG. 9.
: fluid-fluid phase diagram for a star polymer solution calculated by means of mean field theory and the ideal glass transition lines determined with MCT. The legend is the same that in Fig. 4. Notice that the second critical point survives with respect to the glass transition while the region around the second critical point becomes metastable with respect to the freezing. Moreover we can observe that decreasing the temperature the densities which delimit the glass region move to higher values. (in these cases the effect is small).
Lines are simply a guides to the eye.
-
FIG. 10.
MCT fluid-glass lines (computed with MHNC) for different values and , (): reduced temperature versus reduced packing fraction . Filled triangles, squares and diamonds correspond respectively to . The equivalent symbols on the top of the figure delimit the glass region corresponding to . We recall that in the limit of T very large we return to the simply repulsive system.
-
FIG. 11.
Reduced diffusion coefficient (MD) for different values and . The symbols, plus, circles, triangles, squares, correspond respectively to (left panel , right panel ).
Lines are simply a guides to the eye.
-
FIG. 12.
, : magnification of the structure factor (main peak) we obtained with MD simulations at different temperatures. , .
-
FIG. 13.
: fluid-fluid phase diagram for a star polymer solution calculated by means of mean field theory and the ideal glass transition lines determined with MCT. The legend is the same which in Fig. 4.
Notice that the second critical point survives with respect to the glass transition while the region around the second critical point becomes metastable with respect to the freezing. Moreover we can observe that decreasing the temperature the densities which delimit the glass region move progressively to higher values.
Lines are simply a guides to the eye.
-
FIG. 14.
Magnification of the low temperature MCT fluid-glass lines (computed with MHNC) for different values, . The temperatures are rescaled with respect to the integrated intensity of the attractive contribution.
Lines are simply a guides to the eye.