Current Flow in Random Resistor Networks:
The Role of Percolation in Weak and Strong Disorder
Abstract
We study the current flow paths between two edges in a random resistor network on a square lattice. Each resistor has resistance , where is a uniformly-distributed random variable and controls the broadness of the distribution. We find (a) the scaled variable , where is the percolation connectedness exponent, fully determines the distribution of the current path length for all values of . For , the behavior corresponds to the weak disorder limit and scales as , while for , the behavior corresponds to the strong disorder limit with , where is the optimal path exponent. (b) In the weak disorder regime, there is a length scale , below which strong disorder and critical percolation characterize the current path.
pacs:
64.60.-i, 05.50.+q, 71.30.+h, 73.23.-b, 05.45.DfTransport in disordered media is a classic problem in statistical physics which attracts much attention due to its broad range of applications. Examples include flow through porous material, oil production, and conductivity of semiconducting materials or metal-insulator mixtures Ambegaokar ; Strelniker ; Cohen:Ni ; Kirkpatrick ; Bernasconi ; Park ; Berman ; Ball ; Tyc ; Meir . These problems have been studied using a random resistor network model with bonds that have a resistance chosen from a probability distribution mimicking the nature of the physical problem under consideration. Among the different classes of disorder distributions used, the most common is percolation disorder, in which the resistance of a bond is either 1 or Bunde . Gaussian distributions and power law distributions have also been studied extensively Halpin ; Hansen .
Here, we study a random resistor network with exponential disorder Stauffer . We consider the two opposite edges of a square lattice as source and sink . Each bond connecting adjacent nodes and corresponds to one resistor, whose resistance is given by Ambegaokar ; Strelniker ; Bernasconi ; Meir ; fn_exponential_disorder
| (1) |
where controls the disorder strength and is a random number taken from a uniform distribution . Recent experiments show that for quenched condensed granular Ni thin films, the conductivity is well described by exponential disorder with large Strelniker . Exponential disorder enables us to understand the magnetoresistance phenomenon that out of grains, only a few govern the electric conductivity Cohen:Ni . Optimal paths in networks have also been studied with exponential disorder, where the optimal path is the path between two sites that minimizes the total weight Lidia ; Dobrin ; Porto ; Barabasi ; Cieplak , where the sum is over the bonds () along the path. The length of the optimal path has been shown to scale with the system size as for the strong disorder limit () fn_opt_exponent , where a single bond dominates the optimal path (and conductance as we see below). The strong disorder limit only has been related to critical percolation Ambegaokar ; Strelniker ; Bernasconi ; Dobrin .
Here we show that for exponential disorder, the flow paths for all values of are controlled by critical percolation and by the scaling properties of the optimal path in the strong disorder limit. Indeed, the resistance of each path is equal to the sum of its resistances. When the resistance of each path is dominated by the largest resistance on this path . Almost all currents must go along the path which minimizes . We denote this min-max value of disorder as . Among all the paths which go through the bond with , the maximum-current goes along the path which minimizes the second largest value of disorder , and so on. Thus the algorithm of selecting the path with the maximum-current is equivalent to selecting the optimal path in the strong disorder limit (ultrametric algorithm Cieplak ). As the maximum-current path coincides with the optimal path in the strong disorder limit. On the other hand, since all values on the maximum-current path are below , this path must belong to the percolation backbone with concentration equal to the fraction of bonds whose fn_stauffer . The value of at which percolation between two edges of the system does occur has a narrow distribution with a mean of and a standard deviation that scales as Coniglio , where is the critical percolation threshold, is the linear system size, and is the connectedness length exponent. Thus the value of also must have a narrow distribution of width .
Next we estimate the value at which the maximum-current path starts to bifurcate. Consider the paths which do not pass through bond as if this bond has been cut Strelniker . The maximum-current will then pass through bond , which is characterized by the same narrow distribution. Hence is of the order of . These paths become competitive with the true optimal path if its resistance becomes of the same order as or if . This condition determines the crossover from weak to strong disorder. If , the disorder is strong and the maximum-current path does not bifurcate. If the disorder is weak and the maximum-current path can bifurcate. Moreover, the value determines the connectedness length below which the disorder is strong and the maximum-current path is determined by the unique optimal path and above which the maximum-current path bifurcates.
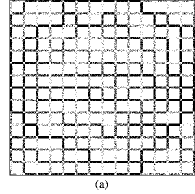
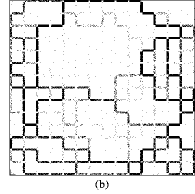
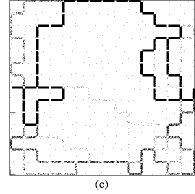
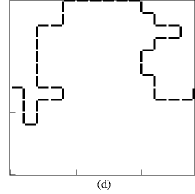
To confirm these analytical predictions, we study the problem numerically. Define the electric potential at node of the lattice as , and set the potentials at source and sink as and , we numerically solve the set of Kirchhoff equations for all Kirchhoff_equation . We begin by building an intuitive understanding of the effect of changing the strength of disorder on current flow. Figures 1(a), (b), and (c) show, for different values of , the magnitudes of the bond currents represented by the density of dots on each bond. We see that the set of bonds carrying most of the current decreases as increases, so that only a few current paths dominate. This confirms earlier findings that for large , one or very few paths dominate the current flow Ambegaokar ; Strelniker ; Bernasconi ; Berman . In Fig. 1(d), we plot the optimal path for the same disorder realization. The similarity between the path of the current carrying bonds in Fig. 1(c) and the optimal path in Fig. 1(d) exhibits how these two quantities are related in the strong disorder limit and supports the argument above that the maximum-current path coincides with the optimal path.


Figure 1 illustrates that the paths used by the current are intimately related to the disorder of the system. Therefore, we study the ensemble of current paths on the lattice by performing tracer dynamics with the particle launching algorithm Eduardo . For a given realization, all bond currents are determined by Kirchhoff equations and then tracers are injected into node and extracted at node . At a given node, the tracer follows the bond from node to with probability
| (2) |
where runs over all the neighbor bonds of node , if , and if , so that only “out” currents are taken into account.
To understand the behavior of the current flow in the presence of disorder in all ranges of disorder, we calculate the length distribution of all tracer paths, , from to for a system of linear size and disorder strength . We first fix and calculate the distribution for different system sizes and the corresponding values of . We obtain weak disorder when and strong disorder when , as found for the optimal path in networks Sameet and as shown below for current flow. Moreover, we find that is the only parameter that characterizes the disorder and thus determines .
In Fig. 2(a) we show three normalized distributions with (weak disorder), which collapses to a single curve as shown in Fig. 2(b). Figure 2(b) also shows two other peaked curves with (close to the crossover) and (strong disorder). Each curve shows the collapse of three distributions with different system sizes but the same value of . This collapse implies that is controlled by a single parameter
| (3) |
We confirmed this scaling numerically for values of between (weak disorder) and (strong disorder) for and fn_weak_deviation .
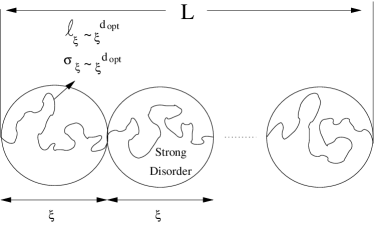
To understand why and play an important role in determining the length of the current flow path in weak disorder as well as in strong disorder, we suggest the following theoretical argument. In the weak disorder regime, there is a characteristic length below which strong disorder exists and critical percolation plays a crucial role fn_case_strong . We thus expect that for length scales up to the tracers travel on strong disorder path segments with a typical length of , and a tracer length deviation of (illustrated in Fig. 3). For a system of linear size in weak disorder, the ratio of the system size to the connectedness length roughly indicates the number of independent strong disorder tracer path segments within a complete tracer path from source to sink. The total length is obtained by multiplying by the length of a segment, . Defining as the maximum of , we thus predict that in the weak disorder is
| (4) |
where is the mean average path length of the tracers lstar_explain ; central_limit . Thus for all values of , can be written in a unified form
| (5) |
where is a scaling function that satisfies (from Eq. (4))
| (6) |
The arguments leading to Eq. (4) for weak disorder, also imply that the standard deviation of scales as
| (7) |
and for all values of
| (8) |
with
| (9) |

To test Eq. (5) we plot as a function of in Fig. 4(a). We find that the best scaling is obtained for , the predicted value. When , is asymptotically a power law function with an exponent , which is within the error of the predicted value (from Eq. (6)). Similarly, in Fig. 4(b), we plot as a function of and find that is asymptotically a power law with an exponent as predicted in Eq. (9). All these results strongly support our picture of critical percolation regimes of size .
Equations (5) and (6) state that tracer path length scales with system size in the same way as the optimal path length for all values of . For , and the path is a fractal with the same exponent as for the optimal path length . In weak disorder (), we obtain as we do for self-affine structures Bunde . This is consistent with the interesting possibility that they belong to the same universality class. As , current flows only along the optimal path, which explains the existence of the bottleneck at the percolation threshold Ambegaokar ; Strelniker ; Berman ; Bernasconi .
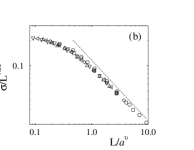
Our results also explain the simulation results of Ref. Strelniker for the scaled plot as a function of , where is the equivalent resistance of the 2D random resistor lattice and is the equivalent resistance of the system after cutting the bond with the maximal local current. Before cutting this bond, the equivalent resistance in the strong disorder limit is dominated by the maximal resistance along the optimal path Ambegaokar ; Bernasconi ; Berman . After cutting this bond, the current will reorganize to follow a new optimal path on which the dominant resistance is , making the ratio . Using the relation Coniglio , we find that
| (10) |
This result also analytically supports our assumption that the ratio characterizes the disorder and determines the properties of current flow.
In summary, we find that the tracer path length in flow in the presence of exponential disorder behaves similarly to the optimal path length , and even has the same scaling exponents ( for and one for ). Moreover, we also find that when the disorder is weak and , there is a connectedness length , where strong disorder and critical percolation exist for regimes smaller than . As a result, the probability distribution of is determined by the ratio , which is the number of units of size in a linear size .
We thank S. Sreenivasan and G. Paul for useful discussions, ONR, ONR-Global, and the Israel Science Foundation for financial support.
References
- (1) V. Ambegaokar et al, Phys. Rev. B 4, 2612 (1971).
- (2) Y. M. Strelniker et al, Phys. Rev. E 69, 065105(R) (2004).
- (3) J. Bernasconi, Phys. Rev. B 7, 2252 (1973).
- (4) Y. Meir, Phys. Rev. Lett. 83, 3506 (1999).
- (5) A. Cohen et al, Solid State Comm. 129, 291 (2004).
- (6) S. Park et al, Phys. Rev. Lett. 92, 167206 (2004).
- (7) S. Kirkpatrick, Phys. Rev. Lett. 27, 1722 (1971); Rev. Mod. Phys. 45, 574 (1973).
- (8) D. Berman et al, Phys. Rev. B 33, 4301 (1986).
- (9) Stéphane Tyč et al, Phys. Rev. B 39, R877 (1989).
- (10) Z. Ball et al, Phys. Rev. Lett. 73, 2099 (1994).
- (11) A. Bunde and S. Havlin, Fractals and Disordered Systems (Springer-Verlag, Heidelberg, 1995).
- (12) T. Halpin-Healy and Y.-C. Zhang, Phys. Rep. 254, 215 (1995).
- (13) A. Hansen and J. Kertész, Phys. Rev. Lett. 93, 040601 (2004).
- (14) D. Stauffer and A. Aharony, Introduction to Percolation Theory (Taylor and Francis, 1994).
- (15) This class corresponds to a distribution of resistances, which behaves as below a cutoff value , and zero for .
- (16) M. Cieplak et al, Phys. Rev. Lett. 72, 2320 (1994); 76, 3754 (1996).
- (17) A.-L. Barabási, Phys. Rev. Lett. 76, 3750 (1996).
- (18) M. Porto et al, Phys. Rev. E 60, R2448 (1999).
- (19) R. Dobrin and P. M. Duxbury, Phys. Rev. Lett. 86, 5076 (2001).
- (20) L. A. Braunstein et al, Phys. Rev. Lett. 91, 168701 (2003).
- (21) The values of the exponent are: and see ref Cieplak . References Porto and Sameet show that when these results hold (strong disorder) while for , which is the weak disorder regime.
- (22) In Ref. Stauffer similar considerations are used to calculate the average conductance of this model, but not the properties of flow paths. The latter have been mostly ignored in the literature. However, recent studies regarding the optimal path in strong disorder and our own new insight allow us to explain the properties of the flow paths.
- (23) A. Coniglio, J. Phys. A 15, 3829 (1982).
- (24) The current between nodes and is . The Kirchhoff equations become , where is the Kronecker delta and is the total current from to .
- (25) E. López et al, Phys. Rev. E, 67, 056314 (2003).
- (26) S. Sreenivasan et al, Phys. Rev. E 70, 046133 (2004).
- (27) For lower values of and , the discreteness of the lattice becomes relevant yielding deviations from scaling.
- (28) In the strong disorder and therefore the whole system is in strong disorder.
- (29) Because the whole distribution scales the same way according to Eq. (3), the mean value and the most probable value have the same scaling.
- (30) According to the central limit theorem, for the distribution of converges to a Gaussian with mean value in Eq. (4) and standard deviation in Eq. (7).