Fragmentation of a circular disc by Impact on a Frictionless plate
Abstract
The break-up of a two-dimensional circular disc by normal and oblique impact on a hard frictionless plate is investigated by molecular dynamics simulations. The disc is composed of numerous unbreakable randomly shaped convex polygons connected together by simple elastic beams that break when bent or stretched beyond a certain limit. It is found that for both normal and oblique impacts the crack patterns are the same and depend solely on the normal component of the impact velocity. Analysing the pattern of breakage, amount of damage, fragment masses and velocities, we show the existence of a critical velocity which separates two regimes of the impact process: below the critical point only a damage cone is formed at the impact site (damage), cleaving of the particle occurs at the critical point, while above the critical velocity the disc breaks into several pieces (fragmentation). In the limit of very high impact velocities the disc suffers complete disintegration (shattering) into many small fragments. In agreement with experimental results, fragment masses are found to follow the Gates-Gaudin-Schuhmann distribution (power law) with an exponent independent of the velocity and angle of impact. The velocity distribution of fragments exhibit an interesting anomalous scaling behavior when changing the impact velocity and the size of the disc.
pacs:
64.60.-i, 64.60.Ak, 46.30.NzI Introduction
The strength and break-up of agglomerates composed of smaller sized primary particles is of particular importance for the storage and handling of materials in process industries such as pharmaceuticals, chemicals, fertilizers, detergent, and food industries. In industrial processes agglomerates often collide with each other and with the hard walls of the equipment resulting in a size reduction, which is desired or not depending on the type of the process. The strength of agglomerates has to be characterized for the design of operating conditions in industrial processes such as milling, tabletting, mixing, and transport in pneumatic conveying. Another important class of agglomerates are the so-called particle compounds, which are the combination of various sized particles embedded in a cementous matrix. The different types of engineering agglomerates and building materials like concretes are some examples of particle compounds. It is of high industrial importance to recycle these particle compounds in order to use the valuable aggregates. The design and optimization of the liberation process of aggregates from the matrix material requires a detailed knowledge of the strength and break-up of compounds.
For the understanding of the strength and break-up process, the study of simple systems like spherical particles is essential. During the last decades several experimental and theoretical studies have been performed to understand the break-up of spherical bodies arising due to impact. The crack pattern of sand-cement spheres by a free fall impact was studied in Ref. fra_pattern , which reports observations of meridian cracks, that divide the sphere into two nearly equal parts, and oblique cracks, which are straight like median cracks, but cut the sphere into two unequal pieces. The fracture of glass and plaster spheres by free fall impact and double impact (dynamic loading between two hard plates) have been carried out recently powder ; chau . It was found that at the lowest impact velocities hertzian cone cracks (formed from a surface ring crack) are developed, whereas, at high velocities, oblique cracks propagate before meridian cracks form fra_glass . This finding differs from the experimental results of Ref. fra_pattern , where it was found that with increasing impact energy, the number of meridian planes increases and oblique cracks start to develop.
Due to the high speed and violent nature of the break-up process, observations are usually restricted to the final state of impact experiments, where information has to be extracted from the remaining pieces of the body. Hence, computer simulation of models of agglomerate break-up is an indispensable tool in this field. Simulations of realistic models provide a deeper inside into the break-up process and can even complement the experimental findings directly supporting the design of industrial processing of these materials. Analytic approaches have limited capabilities in this field since they cannot capture the disordered microstructure of the material.
The finite element approach and the discrete element modeling have been successfully applied to describe the stress field, crack propagation, and fragment formation in impacting spherical particles agglomerate ; bk ; imp_agglo ; poto ; simu ; tsoungui ; imp_ang ; poschel1 ; poschel2 . Recent simulations of ball impact revealed two types of crack patterns: oblique cracks radiating from impact point, and secondary cracks perpendicular to the oblique ones. In the framework of the discrete element method it was clarified that depending on the impact velocity the result of the break-up process can be localized damage around the contact zone, fragmentation, or shattering. The evolution of several characteristic quantities of the break-up process when increasing the impact velocity were monitored and analyzed in normal and oblique impact agglomerate ; bk ; imp_agglo ; poto ; imp_ang .
From a more general point of view, the break-up of agglomerates presents an important class of fragmentation phenomena which is ubiquitous in everyday life and concerns a wide range of phenomena in science and technology. In general, when an object is subjected to shock or stress it will break up into smaller pieces. The length scales involved in this process range from the collisional evolution of asteroids asteroids to the degradation of materials comprised of small agglomerates agglomerate ; bk employed in the process industries as summarized above. There are also many geological examples associated with the use of explosives for mining and oil shale industry, coal heaps, etc. A wide variety of experiments self ; composite ; instable ; ice ; lab ; glassplate and simulations agglomerate ; bk ; discrete ; transition ; twodisc ; granulate ; diehl ; univer ; branching ; aspect ; droplet ; britt ; poto ; simu revealed that the fragment mass distribution is a power law except for very large fragment sizes. The exponents in the power law region were found experimentally to be between 1.35 and 2.6 depending on the effective dimensionality of the system asteroids ; fra_pattern ; lab ; breakup . Recent studies revealed that power law distributions arise in fragmentation phenomena due to an underlying phase transition instable ; transition ; univer . However, most of the data reported in the literature is concerned with the general behavior of fragmentation processes. There is much less literature where the propagation and orientation of cracks are discussed.
In the present paper we study the normal and oblique impact of a circular brittle particle on a hard frictionless plate, varying the impact velocity and impact angle in a broad range. The particle is composed of numerous unbreakable, undeformable, randomly shaped polygons which are bonded together by elastic beams. The bonds between the polygons can be broken according to a physical breaking rule, which takes into account the stretching and bending of the connections. Based on simulations of the model, we performed a detailed study of the failure evolution at different impact velocities and of the nature of the crack propagation during the fragmentation process, and compared the results with experiments fra_pattern ; powder ; lab ; ice ; fra_glass . In the analysis of the simulation data, we profit from recent theoretical results of general studies of fragmentation processes. We observed that for both normal and oblique impacts, the crack patterns are the same and depend solely on the normal component of the impact velocity. Studying the crack patterns, amount of damage, fragment masses, and velocities, we provide a quantitative foundation of the concept of damage, fragmentation, and shattering in ball impact, which was introduced recently on a more qualitative basis agglomerate . We show the existence of a critical impact velocity which distinguishes two regimes of the impact process, i.e. below the critical velocity damage mainly occurs in a conical region around the impact site with a large residue, however, above an ensemble of oblique cracks develop and the disc breaks up into pieces. In agreement with experimental results, fragment masses are found to follow the Gates-Gaudin-Schuhmann distribution (power law) kelly with an exponent independent of the velocity and angle of impact. The velocity distribution of fragments exhibit an interesting anomalous scaling behavior when changing the impact velocity and the size of the disc.
An important application of our results, besides the ones mentioned at the beginning, is to the optimization and control of tumbling mill performance. These questions are of utmost practical importance as they have a tremendous influence on power draft, wear of the balls and liners and breakage characteristics of the grinding materials. During the cataracting motion where the charge material inside a mill follows a parabolic path data , most of the materials are ground as hard balls fall back onto them. There is particular interest in the net energy required to achieve a certain size reduction and the the energy distribution of the fragments during the grinding process. The efficiency of the mills could be controlled if the breakage characteristics of the grinding materials were better understood. Our current work can provide some valuable information for the modernization of the mill design.
II Model
In order to study fragmentation of granular solids, we performed molecular dynamic (MD) simulations in two dimensions. To better capture the complex structure of a real solid, we used randomly generated convex polygons that interact with each other elastically. The model consists of three major parts, namely, the construction of a Voronoi cellular structure, the introduction of the elastic behavior, and finally the breaking of the solid. This section gives a detailed overview of these three steps.
In order to take into account the complex structure of the granular solid, we use randomly generated convex polygons, i.e. we divide the solid into grains by a Voronoi cellular structure. The Voronoi construction is a random tessellation of the plane into convex polygons. This is obtained by putting a random set of points onto the plane and then assigning to each point that part of the plane which is nearer to it than to any other point. One advantage of the Voronoi tessellation is that the number of neighbors of each polygon is limited which makes the computer code faster and allows us to simulate larger systems. In our case, the initial configuration of the polygons was constructed using a vectorizable random lattice, which is Voronoi construction with slightly reduced disorder rand_lattic . First, the Voronoi tessellation of a square is performed, and then a circular disc with smooth surface is cut out.
In the model the polygons are rigid bodies. They are neither breakable nor deformable, but they can overlap when pressed against each other. This overlap represents local deformations of the grains. Usually the overlapping polygons have two intersection points which define the contact line. In order to simulate the elastic contact force, we introduce a repulsive force between touching polygons. This force is proportional to the overlapping area divided by a characteristic length , where , are the radii of circles of the same area as the polygons). The direction of the elastic or normal force is perpendicular to the contact line of the polygons. The complete form of the normal force contains an elastic and damping contribution, whereas the tangential component is responsible for the friction.
Again, to bond the particles together it is necessary to introduce a cohesive force between neighboring polygons. For this purpose we introduce beams. The centers of mass of neighboring polygons are joined together with elastic beams that exert an attractive, restoring force but can break in order to model the fragmentation of the solid. Because of the randomness contained in the Voronoi tessellation, the lattice of beams is also random. The length, the cross-section and the moment of inertia of each beam are determined by the initial configuration of the polygons. The Young’s modulus of the beams and of the particles are considered to be independent of each other. The beams break according to a physical breaking rule, which takes into account the stretching and bending of the connection. The surface of the grains where beams are broken represent cracks. The energy stored in the broken beams represents the energy needed to create these new crack surfaces inside the solid.
In order to simulate the break-up of the disc due to impact with a hard plate, a repulsive force is introduced between the plate and those polygons of the disc which have overlap with the plate. This repulsive force is proportional to the overlap area, similarly to the polygon-polygon contacts but with a higher stiffness value. The contact force of the disc and the plate has vertical direction, tangential component like friction is excluded in the present study.
The time evolution of the system is obtained by numerically solving Newton’s equations of motion of the individual polygons (Molecular Dynamics). For the solution of the equations we use a Gear Predictor-Corrector scheme of fifth order, which means that we have to keep track of the coordinates and all their derivatives up to fifth order. The breaking criterion of beams is evaluated in each iteration time step and those beams which fulfill the condition are removed from the calculations. The simulation stops after no beams break during a certain number of time steps. Previously this model has been applied to study fragmentation of solids in various experimental situations discrete ; transition ; twodisc ; granulate ; proj . For more details of the simulation technique see Ref. discrete .
III Crack pattern
 |
 |
 |
| (a) | (b) | (c) |
 |
 |
| (d) | (e) |
In the present work we apply our model to explore the properties of the fragmentation process of a circular disc when dropped on a frictionless hard plate at different angles. The particle moves with a constant speed without the influence of gravity, which is obtained by supplying a constant velocity to all the polygons constituting the circular particle just before it touches the hard surface. The impact angle defined as the angle of the vector of the impact velocity to the horizontal, was varied between (normal impact) and (oblique impact).
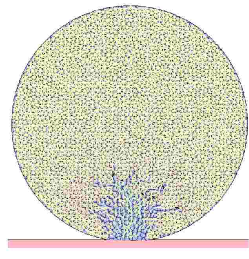
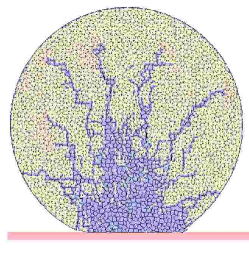
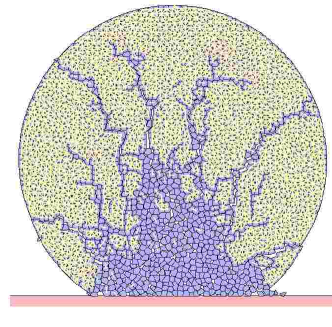
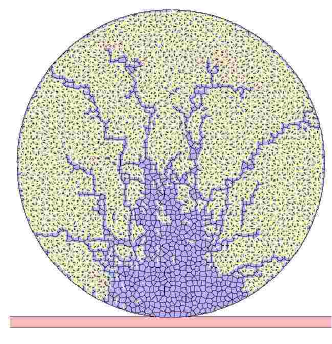
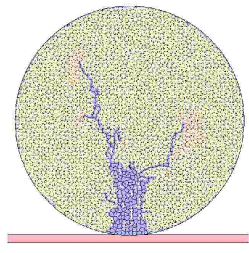
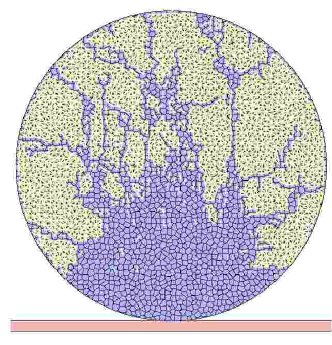
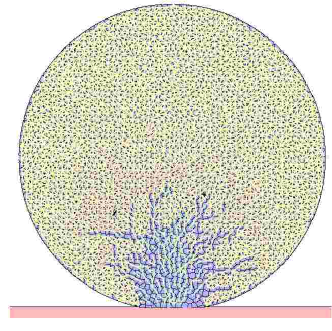
In order to understand the break-up process of discs, we investigated the crack pattern arising both in normal and oblique impacts. Fig. 1 presents the time evolution of the crack pattern of normal impact obtained by the simulation of a circular disc of radius cm at cm/sec. When the disc strikes against the hard plate, a high compressive wave is generated at the impact point. Fracture starts from the region of contact point and propagates through the disc. As the time passes, more and more bonds break at the impact region and the area of contact increases progressively. As a result of this primary breakage a cone shaped (triangle shaped in two dimensions) damage area is created whose base corresponds approximately to the area of contact of the specimen and the target (see Fig. 1b) and it is more distinct at the end of the fragmentation process (see Fig. 1d). When the cone is driven into the specimen a large number of cracks are generated starting from the region around the cone (see Fig. 1b). This indicates that a high stress concentration has developed around the conical damage region. Later on these cracks run together to form few oblique cracks (see Fig. 1c) directing radially outward. As crack propagation is very energy dissipative, when these oblique cracks move outwards, the intensity of the compressive wave gradually decreases and hence larger fragments appear opposite the impact point.
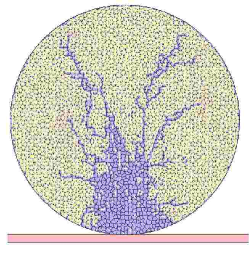
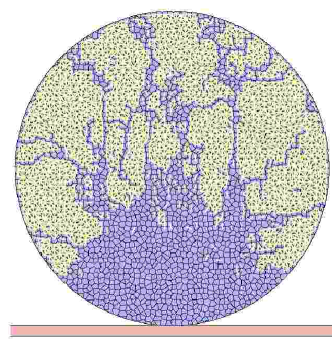
To demonstrate the effect of the impact velocity on the break-up process, in Fig. 2 final states of the process are shown obtained at different impact velocities, with the fragments reassembled into the initial disc. At low velocities the compressive wave intensity generated at the impact point is low, and hence, the cone could not develop fully. Moreover, only a few oblique cracks are obtained, and they do not reach the opposite surface of the disc (Fig. 2a). As the velocity increases, more oblique cracks develop and cover a greater distance (Fig. 2b) and a considerable part of the initial kinetic energy goes into the motion of the residue resulting in rebound. At the impact velocity where the oblique cracks reach the outer surface of the disc opposite to the impact point, the break-up process drastically changes: below this velocity mostly contact damage occurs in the form of the damage cone and a relatively big residue remains back. Above this velocity, however, the cracks spanning the entire disc result in the break-up of the residue into smaller pieces, see Fig. 1d. Later on it will be shown that the behavior of the system quantitatively changes at this velocity, which we call critical velocity. At impact velocities larger than the critical value, secondary cracks are generated roughly perpendicular to the oblique cracks. Secondary cracks from neighboring oblique cracks may merge with each other as can be seen in Fig. 2c. Also at higher impact velocities, vertical cracks with a direction nearly perpendicular to the target plate are more prominent as the intensity of stress concentration near the tip region of the cone is high as compared to other parts.
 |
 |
 |
| (a) | (b) | (c) |
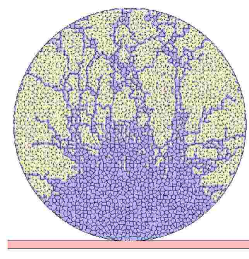
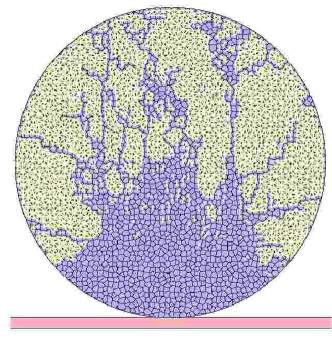
Crack patterns obtained in the final state of oblique impacts at impact angles and are compared in Fig. 3. It is important to emphasize that in our calculations the friction between the target plate and the circular disc is completely excluded. Under this condition, varying the impact velocity while keeping its normal component constant, practically the same crack pattern is obtained (see Fig. 3). Thus, the crack propagation and orientation during the fragmentation process solely depends on the normal component of the impact velocity.
Comparing the crack pattern obtained in the simulations to the experimental results fra_pattern , we did not find any meridian cracks as they are difficult to detect in two dimensions. The pattern of oblique cracks and secondary cracks has a satisfactory agreement with the experimental results. The simulations confirm that oblique cracks which were observed in experimental investigations fra_pattern develop along the trajectories of maximum compression planes.
 |
 |
| (a) | (b) |
 |
 |
| (c) | (d) |
IV Results
Studying the evolution of the final crack patterns when changing the impact velocity, we have identified a critical velocity which separates the regimes of different break-up mechanisms. In the following, we analyze characteristic quantities of the break-up process, and show that there are substantial differences between the two regimes.
IV.1 Size Distribution of Fragments
Recently, it has been shown that the final outcome of a fragmentation process can be classified into two states depending on the amount of the imparted energy: damaged and fragmented states with a sharp transition in between. Detailed analysis revealed that the transition between the two states occurs as a continuous phase transition which also provides a possible explanation of the power law mass distribution of fragments observed.
To explore the nature of the critical velocity identified in the previous section we investigated the evolution of the mass of the two largest fragments when varying the angle and the velocity of impact. Plotting the largest fragment mass as a function of the normal component of the impact velocity for both normal and oblique impacts in Fig. 4, all curves fall over one another. This implies that in the absence of friction between the plate and the disc, the size reduction achieved depends both on and but in such a way that it depends on the combination of the two variables . The curves of the second largest mass exhibit the same data collapse when plotting them as a function of further supporting the above arguments.
The functional form of the two largest fragment masses in Fig. 4 shows the existence of two distinct regions. At low impact velocity, breakage takes place only at the impact point and the largest fragment is nearly equal to the original mass. As the velocity of impact increases, more small fragments are chipped off from the impact point and cracks start around the damaged conical region and move towards the outer surface of the disc. At the critical velocity these propagating cracks reach the outer surface opposite to the impact point and the largest fragment break into several big pieces. The impact velocity where the second largest mass attains its maximum value or where there is an inflexion point in the largest fragment mass curve coincides with the critical velocity defined by analyzing the cracking pattern in Figs. 1,2. In our case for normal impact of a system of cm radius the critical velocity turned out to be cm/sec.
The quality of the data collapse of the curves in Fig. 4 obtained at different impact velocities and angles is excellent for the largest fragment, however, there are large fluctuations of the value of the second largest mass at impact velocities just below the critical point. Above the critical point all curves merge nicely together.
More information about the evolution of fragment sizes with varying impact angle and velocity can be obtained by studying the moments of fragment masses instable ; transition ; univer ; proj . The th moment of fragment masses is defined as
| (1) |
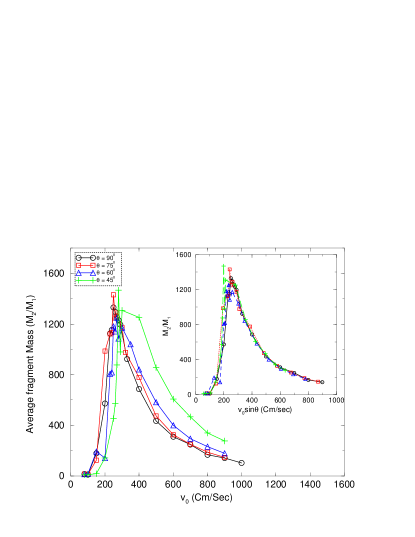
where denotes the total number of fragments, is the mass of fragment and is the largest fragment mass. The definition Eq. (1) means that the th power of the largest mass is extracted from the sum of the th power of the fragment masses. The average mass of fragments can be defined as the ratio of the second and first moments . In order to demonstrate the effect of rescaling the impact velocity, in the main panel of Fig. 5 the average fragment mass is presented as a function of the impact velocity for the system size cm obtained at different impact angles , and in the inset the same curves are shown as a function of the normal component of . It can be seen that for each impact angle has a peak which broadens and gets shifted towards larger velocity values with decreasing impact angle. However, when plotting the same quantity as a function of the normal components of the impact velocity all the curves fall on top of each other. Larger fluctuations arise below the critical point which are more dominant for lower impact angles. Note that the position of the maximum in the inset coincides with the transition point determined in Fig. 4.
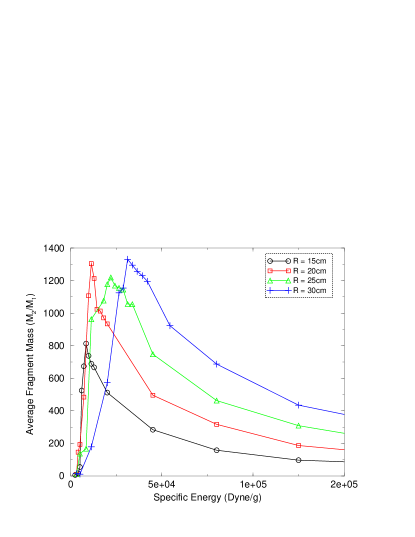
Studies of fragmentation of various types of brittle solids have revealed that a larger amount of energy is required to achieve the same size reduction on systems of larger size. However, in terms of the specific energy, i.e. the energy imparted to the fragmenting system divided by the total mass , all the characteristic quantities show a universal behavior, especially the critical value of the specific energy is independent of the system size transition ; proj ; twodisc ; granulate ; poto ; simu . For impacting discs, however, the critical value of the specific energy shows a clear dependence on the size of disc as it is illustrated in Fig. 6. The larger the disc, the higher the energy density is required to break it into pieces. A possible explanation is that for larger discs, a larger part of the imparted energy goes into the motion of the fragments, lowering the efficiency of break-up.
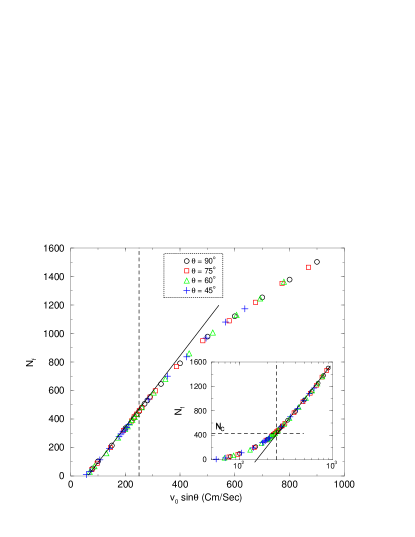
The total number of fragments is also an important measure of the degree of break-up in the impact process. Fig 7 shows that the number of fragments is uniquely determined by the normal component of the impact velocity , i.e. the curves obtained at different impact angles present a perfect collapse when plotting them as a function of . It can be seen in the figure that the number of fragments is a monotonically increasing function of the velocity, however, the functional form of seems to be different on the two sides of the critical point, i.e. up to the critical point the curves show clearly a straight line, whereas, above the critical point all curves are slightly bent towards down as the efficiency of the fragmentation process decreases. Replotting the results using logarithmic scale on the horizontal axis, however, a straight line is obtained above the critical point (see the inset of Fig. 7), which implies that has the form
| (2) |
where denotes the number of fragments at the critical point and is the slope of the straight line in the inset of Fig. 7.
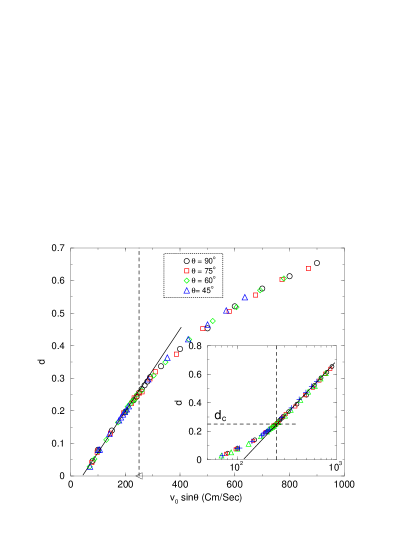
The amount of damage occurring during the break-up process can be quantified by the so-called damage ratio proposed by Thornton et. al agglomerate . is defined as the ratio of the number of broken contacts to the total number of contacts existing initially inside the disc. The damage ratio depends both on the impact angle and the impact velocity , i.e., increasing at a fixed value of results in an increase of , furthermore, increasing the impact angle at a given value of the damage ratio also increases. However, when plotting as a function of the normal velocity in Fig. 8 the curves obtained at different impact angles collapse on top of each other, which implies that solely depends on . Similarly to the number of fragments, is also a monotonically increasing function of , however, its functional form changes at the critical point. It is observed that below the critical point is a linear function of , while above the critical point the curve is non-linear, slightly bending down. On a semilogarithmic plot again a straight line arises which implies the functional form
| (3) |
where is the value of at critical point and is the slope of the fitted straight line in Fig. 8. A somewhat similar functional form of has also been pointed out by Thornton agglomerate ; imp_agglo in impact of discs and spherical objects with a hard plate.
IV.2 Plate Force

|
|
|---|---|
| (a) | (b) |
 |
 |
| (c) | (d) |
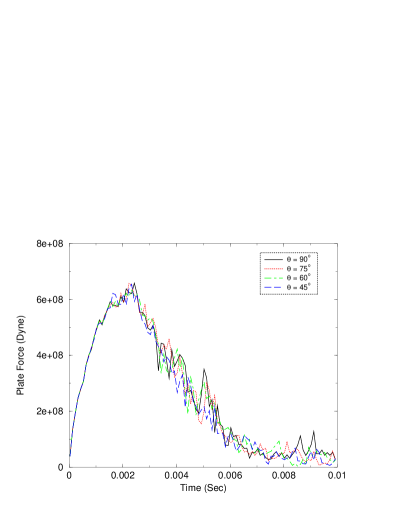
An alternative way of showing the effect of the impact angle is by analyzing the force exerted by the plate on the disc. In Fig. 9(a) and (b) typical time series of the force between the target plate and the disc are presented. If the normal component of the impact velocity is kept constant while changing and , the force practically remains constant except for fluctuations, see Fig. 9(a). It shows clearly that the force exerted by the target plate only depends on the normal component of impact velocity providing further support for the above findings in consistency with refs. agglomerate ; bk ; imp_agglo ; imp_ang .
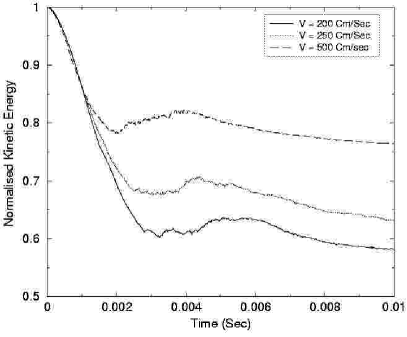
To take a clear view of the nature of the plate force, we have plotted the plate force as a function of time at various velocities (see Fig. 9(b)). In general, as the impact velocity is increased, the maximum plate force increases, the duration of the impact decreases. The maximum force exerted by the plate occurs when the kinetic energy has a minimum (see Fig. 9(c)). The maximum plate force or minimum kinetic energy corresponds to the state of the fragmented disc where most of the bonds break near the contact region and cracks start to propagate radially outwards from the conical damage region (see Fig. 9(d). Since damage, i.e. bond breaking dissipates energy, the final kinetic energy is significantly less than the initial kinetic energy. Increasing the impact velocity gives rise to an increase in the final kinetic energy and decrease of the duration of plate-disc contact. Moreover, the initial kinetic energy remaining at the end of the impact first decreases with impact velocity until the velocity is sufficient to produce multiple fracture and then increases due to increase in kinetic energy of the broken fragments. Clearly, there are two stages to the bond breaking process during impact. Initially bonds are broken primarily as a result of the high compressive shock wave adjacent to the impact site, which occurs during the period when the plate force is increasing. This is followed by further bond breakage due to crack propagation radially outwards, starting around the conical damage region where high stress concentration occurs, while the plate force decreases.
IV.3 Mass Distribution of Fragments
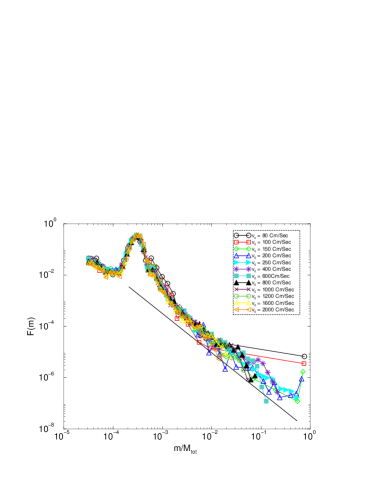
The mass (or size) distribution of fragments is one of the most important characteristic quantities of the disc impact which has also a high practical relevance. The fragment mass histograms of normal impact are presented in the Fig 10, for the system size cm at varying impact velocity . In order to resolve the shape of the distribution over a wide range of mass values, logarithmic binning was used i.e., the binning is equidistant on logarithmic scale.
It can be observed that the histograms have a maximum at small fragment sizes due to the existence of single unbreakable polygons. The shape of the peak of the small fragments is determined by the mass distribution of single Voronoi polygons obtained by the tessellation procedure. At low velocities, much below the critical point, the distributions are discontinuous: for small fragment masses the distributions are smoothly decreasing functions, while for large fragments has a peak indicating the presence of large unbroken pieces. In between however, the medium sized fragments are missing. As the impact velocity increases, the large pieces break up into smaller ones, the peak of the large fragments on the right hand side gradually disappears and the entire mass distribution becomes continuous. It is interesting to note that the peak of large fragments disappears completely at the critical point where the cracks starting from the damaged conical region reach at the outer surface of the disc, breaking the disc into several smaller pieces. As a result, takes a power law form at the critical point
| (4) |
The exponent of the power law fitted to the curve at the critical velocity cm/sec is . For oblique impact the value of the exponent is nearly the same as in normal impact within a precision of . Simulations with different system sizes such as cm, cm and cm proved that the exponent is also independent of .
Increasing the impact velocity above the critical point, the power law regime of the mass distribution remains unchanged, however, the largest fragment size decreased and the shape of the curve attains an exponential form for large fragments. In the limiting case of very high impact velocities the disc suffers complete disintegration into small pieces. In this shattered phase gradually transforms to an exponential form. However, the shattered phase is slowly approached when increasing the impact velocity since the damage ratio and the number of fragments have a logarithmic dependence on . The results are in good quantitative agreement with the experimental findings on the fragmentation of plate-like objects glassplate ; platelike ; composite ; ice .
IV.4 Scaling of the Velocity Distribution
In applications like mineral processing, a fragment, formed with a certain velocity, can undergo secondary break-up due to collisions with other fragments or with the walls of the container. To get an estimate about the importance of this secondary fragmentation, it is essential to study the fragment velocities. We investigated the velocity distribution of fragments and its dependence on the macroscopic variables of the system like the impact velocity and radius of the disc .
 |
 |
| (a) | (b) |
 |
 |
| (a) | (b) |
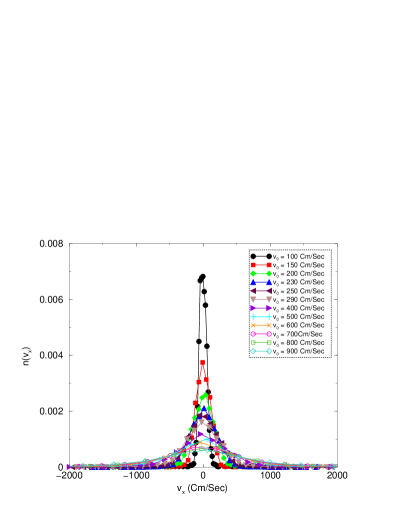
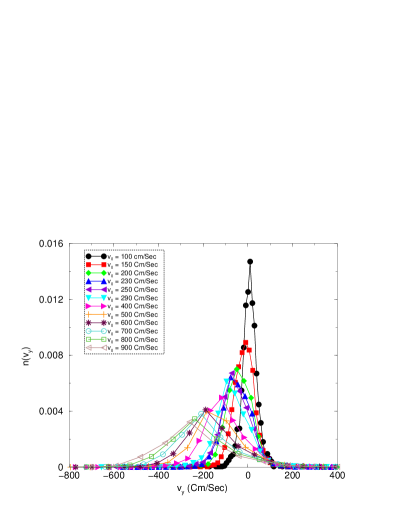
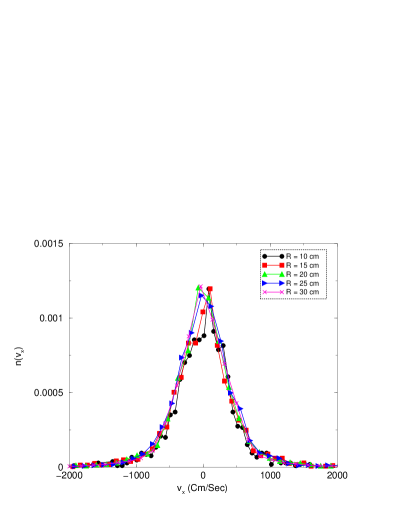
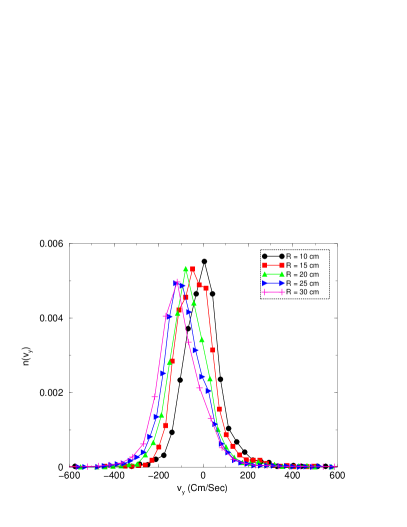
To determine the velocity distribution of fragments and explore its dependence on and , we analyzed the data in two ways. First we fixed the disc radius and varied the impact velocity , then fixed while varying . In both cases the calculations are restricted to normal impact () and the distributions of the velocity components , of the center of mass of the fragments are evaluated. In Figs. 11,12 we present the results for fixed radius varying the initial velocity and for fixed cm/sec varying the radius of the particles, respectively. In Fig. 11(a) one can observe that the distribution of the component of the fragment velocities is symmetric about as expected from the symmetry of the initial conditions. The zero mean value is a consequence of momentum conservation. As the impact velocity increases, the distribution broadens. The distribution of the components also broadens with increasing impact velocity but also shifts towards the negative direction. This is obvious as the direction of the impact velocity is in the negative direction of axis and the total linear momentum increases with the impact velocity. However, in the direction fragments are slower, i.e., the values of are much smaller than those of . Note that there is a small fraction of the debris which has velocity larger than , in agreement with experimental findings breakup . When the impact velocity is fixed and the size of the disc is varied, however, the distribution of the components remains the same (see Fig. 12(a)). For a similar trend is observed as in the case of changing , except that the distribution is less dispersed with varying (Fig. 12(b)).
 |
 |
| (a) | (b) |
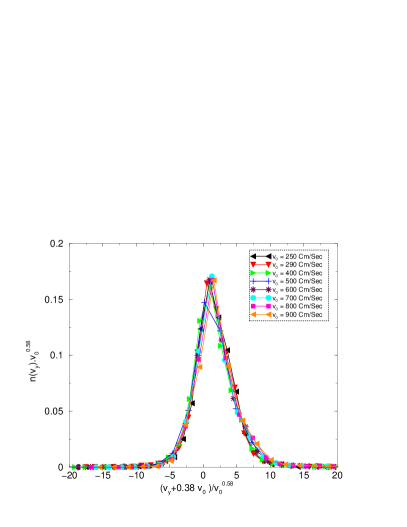
To reveal the functional form of the dependence of and on the macroscopic variables and we performed a scaling analysis of the distributions. Figs. 13, 14 demonstrate that by appropriate rescaling the axes one can merge the curves obtained at different values of the macroscopic variables onto a single curve. In the case of the components, the transformation is a stretching and shrinking by a power of on the vertical and horizontal axis, respectively. However, for the components, a combination of a linear shift and a shrinking by a power of is required. The good quality of the data collapse implies that the and dependence of the distributions can be cast in the form
| (5) | |||||
| (6) |
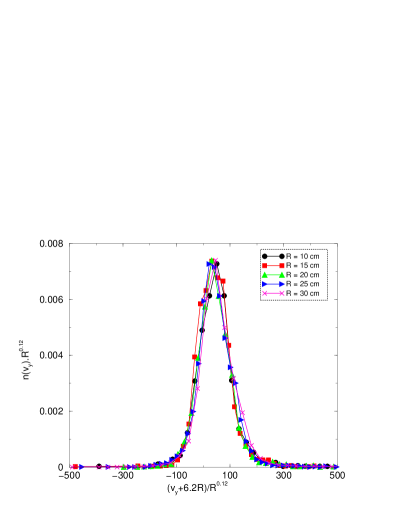
where the parameter values , , and were obtained by varying them until the best data collapse is obtained in Fig. 13,14. Similarly at constant velocity while varying the system size the functional form of the distribution reads as
| (7) |
where and provide the best collapse in Fig. 14. , , and are scaling functions which seem to have a Gaussian-like shape in Figs. 13,14. The scaling forms Eqs. (5,6,7) show that the width of the scaling functions have a power law dependence on the impact velocity and on the radius of the disc . It has to be emphasized that the above scaling behavior is valid only above the critical velocity ; below no scaling was found.
The scaling form of the distribution of the velocity components have also consequences for the spatial distribution of the flying pieces after impact. The increase of the width of the distributions with increasing impact velocity and disc radius implies that the flying fragments are more dispersed in space.
V Conclusion
We studied the normal and oblique impact of a circular brittle particle on a hard frictionless plate using a cell model of cohesive granular materials. We carried out a detailed analyses of the evolution of the crack pattern arising in the disc during the impact process, and of the mass and velocity distributions of fragments in the final state.
For both normal and oblique impact, a cone shaped damage region is formed at the impact point whose base area increases gradually as the velocity of impact increases. Cracks start to develop from the the conical damaged region where the maximum stress concentration exists. The oblique crack patterns obtained resemble those of the experimental findings fra_pattern , where oblique cracks moving along the plane of maximum compression were found. In agreement with the experimental observations, the oblique cracks in our simulation follow the trajectory of the maximum compression plane. Varying the impact velocities while keeping its normal component constant, we observed that the crack pattern remains the same in agreement with recent experimental and theoretical findings fra_pattern ; breakup ; powder ; fra_glass ; ball_impact .
Our analyses showed the existence of a critical value of the impact velocity, at which the oblique cracks reach the outer surface of the disc opposite to the impact point. The critical velocity separates two regimes of the break-up process, i.e. below the critical point only a damage cone is formed at the impact site (damage), cleaving of the particle occurs at the critical point, while above the critical velocity the disc breaks into several pieces (fragmentation). In the limit of very high impact velocities, the disc suffers complete disintegration into many small fragments. However, this shattered phase is slowly approached since the damage ratio and the number of fragments increase logarithmically with the impact speed. The critical behavior proved to be independent of the impact angle, it solely depends on the normal component of the impact velocity. Studying the average fragment size revealed that the critical value of the specific energy increases with the size of the disc. This implies in practical cases that a higher energy density is required to break a particle of larger size.
Above the critical point, the mass distribution of fragments was found to obey the Gates-Gaudin-Schuhmann distribution (power law) with an exponent close to . The power law functional form occurs at the critical point and remains unchanged in a broad interval of the impact velocity independent of the system size and of the impact angle. However, in the shattered phase attained in the limit of very high impact velocities, the fragment mass distribution tends to an exponential form. The results are in good quantitative agreement with the experimental findings on the fragmentation of plate-like objects glassplate ; platelike ; composite ; ice .
In applications like mineral processing, a fragment, formed with a certain velocity, can undergo secondary break-up due to collisions with other fragments or with the walls of the container. To get an estimate about the importance of this secondary fragmentation, the study of fragment velocities is essential. We determined the distribution of the velocity components of fragments and analysed the scaling behaviour of the distributions when changing the macroscopic variables of the system, i.e. impact velocity amd system size . A very interesting anomalous scaling of the distribution functions were revealed with a power law dependence on and .
In a variety of size reduction operations practiced by a wide range of industries, there is a particular interest in the net energy required to achieve a certain size reduction and the energy distribution of the fragments during the grinding process. To maximize efficiency of such processes, it is important to know the breakage characteristics of the grinding materials. Our current work can provide some of this valuable information.
References
- (1) N. Arbiter, C. C. Harris, and G. A. Stamboltzis, Transactions of the Society of Mining Engs. of AIME 119, 244 (1969).
- (2) A. D. Salman, C. A. Biggs, J. Fu, I. Angyal, M. Szabo, M. Z. Hounslow, Powder Technology 128, 36 (2002).
- (3) K. T. Chau, S. Z. Wu, W. C. Zhu, C. A. Tang, and T. X. Yu, in Proceedings of 16th ASCE Engineering Mechanics Conference, July 16-18, 2003, University of Washington, Seattle.
- (4) A. D. Salman, and D. A. Gorham, Powder Technology 107, 179 (1999).
- (5) S. Data, and B. K. Mishra, M. Tech. Thesis, FFT Analysis of Charge Dynamics in Tumbling Mill (1998).
- (6) D. L. Turcotte, Jour. Geophys. Res. 91 B2, 1921 (1986).
- (7) C. Thornton, K. K. Yin, and M. J. Adams, J. Phys. D 29, 424 (1996).
- (8) B. K. Mishra, C. Thornton, Int. J. Mineral Processing 61, 225 (2001).
- (9) F. Kun and H. J. Herrmann, Comput. Meth. Appl. Mech. Eng. 138, 3 (1996).
- (10) F. Kun and H. J. Herrmann, Phys. Rev. E 59, 2623 (1999).
- (11) F. Kun and H. J. Herrmann, Int. Jour. Mod. Phys. C 7, 837 (1996).
- (12) G. A. D’Addetta, F. Kun, E. Ramm, and H. J. Herrmann, From solids to granulates - Discrete element simulations of fracture and fragmentation processes in geomaterials, Continuous and discontinuous modelling of cohesive-frictional materials, pp. 231-258 (2001), Lecture Notes in Physics (LNP) 568,Springer Verlag, Berlin.
- (13) L. Oddershede, P. Dimon, and J. Bohr, Phys. Rev. Lett. 71, 3107 (1993).
- (14) A. Meibom and I. Balslev, Phys. Rev. Lett. 76, 2492 (1996).
- (15) E. S. C. Ching, et al, Physica A 265, 119 (1999).
- (16) A. Diehl et al, Phys. Rev. E 62, 4742 (2000).
- (17) J. Åström, M. Kellomäki and J. Timonen, Phys. Rev. E 55, 4757 (1997).
- (18) W. T. Ashurst and B. L. Holian, Phys. Rev. E 59, 6742 (1999).
- (19) H. Inaoka, E. Toyosawa, and H. Takayasu, Phys. Rev. Lett. 78, 3455 (1997).
- (20) J. Åström and J. Timonen, Phys. Rev. Lett. 78, 3677(1997).
- (21) J. A. Aström, B. L. Holian, and J. Timonen, Phys. Rev. Lett. 84, 3061 (2000).
- (22) M. Arakawa, Icarus 142, 34 (1999).
- (23) F. Wittel, F. Kun, H. J. Herrmann, and B. H. Kröplin, Phys. Rev. Lett. 93, 035504 (2004).
- (24) T. Matsui, T. Waza, K. Kani and S. Suzuki, J. of Geophysical Research 87 B13, 10968 (1982).
- (25) A. Fujiwara and A. Tsukamoto, Icarus 142, 44 (1980).
- (26) V. Latora, M. Belkacem, and A. Bonasera, Phys. Rev. Lett. 73, 1765 (1994).
- (27) A. V. Potapov, C. S. Campbell, and M. A. Hopkins, Int. J. Mod. Phys. C 6, 399 (1995).
- (28) H. Katsuragi, D. Sugino, and H. Honjo Phys. Rev. E 68, 046105 (2003).
- (29) T. Kadono, Phys. Rev. Lett. 78, 1444 (1997).
- (30) T. Kadono and M. Arakawa, Phys Rev. E 65, 035107(R) (2002).
- (31) K. D. Kafui and C. Thornton, Powder Technology 109, 113 (1999).
- (32) O. Tsoungui, D. Vallet, J. -C. Charmet, and S. Roux, Granular Matter 2, 19 (1999).
- (33) M. Khanal, W. Schubert, and J. Tomas, Granular Matter 5, 177 (2004).
- (34) R. Moreno, M. Ghadiri, and S. J. Antony, Powder Technology 130, 132 (2003).
- (35) E. G. Kelly and D. J. Spottiswood, Introduction to Mineral processing, Johns Wiley & Sons Inc. New York, 1982.
- (36) C. Moukarzel and H. J. Herrmann, Jour. Stat. Phys. 68, 911 (1992).
- (37) H. J. Tillemans and H. J. Herrmann, Physica A 217, 261 (1995).
- (38) A. V. Potapov and C. S. Campbell Fourth year progress report, International Fine Particle Research Institute , Dept. of Mech. Eng., University of southern California, USA.
- (39) B. Behera, F. Kun, S. MaNamara and H. J. Herrmann, cond-mat/0404057.
- (40) V. Buchholtz, J. A. Freund, T. Poschel, Eur. Phys. Jour. B 16, 169 (2000).
- (41) Thorsten Pöschel, Dynamik Granularer Systeme: Theorie, Experimente und numerische Experimente, Logos Verlag Berlin (2000).