Adiabatic cooling of Fermions in an optical lattice
Abstract
The entropy-temperature curves are calculated for non-interacting fermions in a 3D optical lattice. These curves facilitate understanding of how adiabatic changes in the lattice depth affect the temperature, and we demonstrate regimes where the atomic sample can be significantly heated or cooled. When the Fermi energy of the system is near the location of a band gap the cooling regimes disappear for all temperatures and the system can only be heated by lattice loading. For samples with greater than one fermion per site we find that lattice loading can lead to a large increase in the degeneracy of the system. We study the scaling properties of the system in the degenerate regimes and assess the effects of non-adiabatic loading.
pacs:
32.80.Pj, 05.30.-dI Introduction
Tremendous progress has been made in the preparation, control and manipulation of Fermi gases in the degenerate regime DeMarco and Jin (1999); Schreck et al. (2001); O’Hara et al. (2002); Modugno et al. (2002); Gupta et al. (2003); Regal et al. (2003); Cubizolles et al. (2003). Such systems have many potential applications in the controlled study of fermionic superfluidity and the production of ultra-cold molecules. Another area of developing theoretical interest is in the physics of fermions in optical lattices Hofstetter et al. (2002); Rabl et al. (2003); Viverit et al. (2004); Santos et al. (2004), and initial experiments have already begun to examine the properties of Fermi-gases (prepared as boson-fermion mixtures) in one-dimensional optical lattices Modugno et al. (2003); Ott et al. (2004). For Bose gases, optical lattices have been used to demonstrate an impressive array of experiments such as: quantum matter-wave engineering Orzel et al. (2001); Greiner et al. (2002a); the Mott-insulator quantum-phase transition Greiner et al. (2002b); quantum entanglement Mandel et al. (2003); and coherent molecule production Rom et al. (2004). It seems likely that a similar range of rich physics lies ahead for fermions in optical lattices.
Many of the physical phenomenon that are suitable to experimental investigation in optical lattices are sensitive to temperature and it is therefore of great interest to understand how the temperature of a quantum degenerate gas changes with lattice depth. Experimental results by Kastberg et al. Kastberg et al. (1995) in 1995 showed that loading laser cooled atoms into a three-dimensional optical lattice caused the atoms to increase their temperature 111In fact this study used adiabatic de-loading to reduce the temperature of the constituent atoms.. Recently one of us conducted a detailed thermodynamic study of bosonic atoms in optical lattices Blakie and Porto (2004). In that work we showed that for sufficiently low initial temperatures a new regime would be entered in which adiabatically ramping up the lattice depth would have the desirable effect of cooling the system. The typical temperatures at which Bose-Einstein condensates are produced lie well within this cooling regime, and thus benefit from reduced thermal fluctuations when adiabatically loaded into an optical lattice. In this paper we examine how degenerate fermions are affected by adiabatic loading into an optical lattice. In Fermi gases the lowest temperatures obtained in experiments tend to be much higher than in Bose gas experiments. It is therefore important to understand to what extent the introduction of an optical lattice might affect the temperature, in particular to determine in what regimes additional cooling can occur during lattice loading.
The quintessential difference in the properties of degenerate fermions from bosons is embodied by the Fermi energy - the energy that marks the top of the Fermi-sea of occupied states (at ). The Fermi energy sets a new energy scale that has no analog in boson systems and plays a crucial role in determining the effect that lattice loading has upon the system. We find that as the Fermi energy approaches a band gap, the cooling regime vanishes and the system can only heat with increasing lattice depth. However, we also find that when the Fermi energy lies in the second band (when the average number of fermions per site is greater than one) a cooling regime is re-established. This cooling regime for the second band is accompanied by a large amplification of degeneracy, i.e. adiabatically loading into the lattice causes both and the ratio to decrease.
The results we present in this paper are obtained from a numerical study of the thermodynamic properties of an ideal gas of fermions in a 3D cubic lattice. We work with the grand canonical ensemble and use the exact single particle eigenstates of the lattice to determine the entropy-temperature curves for the system for various lattice depths and filling factors. We develop analytic expressions for the plateaus that develop in the entropy-temperature curves and characterize a scaling relationship that holds for low temperatures and in deep lattices. A fast loading procedure is considered to ascertain how robust our results are to non-adiabatic effects. The physics we explore here will be relevant to current experiments, and many of the predictions we make should be easily seen.
II Formalism
II.1 Single Particle Eigenstates
We consider a cubic 3D optical lattice made from 3 independent (i.e. non-interfering) sets of counter-propagating laser fields of wavelength , giving rise to a potential of the form
| (1) |
where is the single photon wavevector, and is the lattice depth. We take the lattice to be of finite extent with a total of sites, consisting of an equal number of sites along each of the spatial directions with periodic boundary conditions. The single particle energies are determined by solving the Schrödinger equation
| (2) |
for the Bloch states, of the lattice. For notational simplicity we choose to work in the extended zone scheme where specifies both the quasimomentum and band index of the state under consideration 222For a discussion of how the quantum numbers of quasimomentum and band index are introduced we refer the reader to Ref. Ashcroft and Mermin (1976). By using the single photon recoil energy, , as our unit of energy, the energy states of the system are completely specified by the lattice depth and the number of lattice sites (i.e. in recoil units is independent of ).
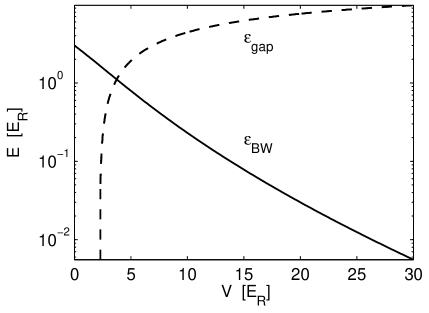
For completeness we briefly review some important features of the band structure of Eq. (2) relevant to the thermodynamic properties of the system. For sufficiently deep lattices an energy gap, , will separate the ground and first excited bands (see Fig. 1). For the cubic lattice we consider here, a finite gap appears at a lattice depth of 333The delay in appearance of the excitation spectrum gap until is a property of the 3D band structure. In a 1D lattice a gap is present for all depths . (marked by the vertical asymptote of the dashed line in Fig. 1). For lattice depths greater than this, the gap increases with lattice depth. In forming the gap higher energy bands are shifted up-wards in energy, and the ground band becomes compressed — a feature characteristic of the reduced tunneling between lattice sites. We refer to the energy range over which the ground band extends as the (ground) band width, . As is apparent in Fig. 1, the ground band width decreases exponentially with , causing the ground band to have an extremely high density of states for deep lattices.
II.2 Equilibrium Properties
Our primary interest lies in understanding the process of adiabatically loading a system of fermions into a lattice. Under the assumption of adiabaticity the entropy remains constant throughout this process and the most useful information can be obtained from knowing how the entropy depends on the other parameters of the system. In the thermodynamic limit, where and while the filling factor remains constant, the entropy per particle is completely specified by the intensive parameters . The calculations we present in this paper are for finite size systems, that are sufficiently large to approximate the thermodynamic limit. We would like to emphasize at this point the remarkable fact that is an adjustable parameter in optical lattice experiments, in contrast to solid state systems where the lattice parameters are immutable.
The entropy is determined as follows: The single particle spectrum of the lattice is calculated for given values of and . We then determine the thermodynamic properties of the lattice with fermions in the grand canonical ensemble, for which we calculate the partition function
| (3) |
where is found by ensuring particle conservation. The entropy of the system can then be expressed as
| (4) |
where , and is the mean energy.
II.2.1 Multiple components
In most current experiments mixtures of Fermi gases in different internal states are studied. This is required because s-wave elastic collisions, needed for re-equilibration, are prohibited by the Pauli principle for spin polarized samples 444This also means that a single component Fermi gas is quite well described by a non-interacting theory.. The theory we present here is for the spin polarized case, but is trivially extensible to multiple components if the lattice potential is spin independent and the number of atoms in each component is the same: in this case all extensive parameters are doubled (e.g. ) and intensive parameters (e.g. ) remain the same. The inclusion of interaction effects, which will be important in the multiple component case, is beyond the scope of this paper.
III Results
III.1 Effect of lattice loading on Fermi-gas temperature
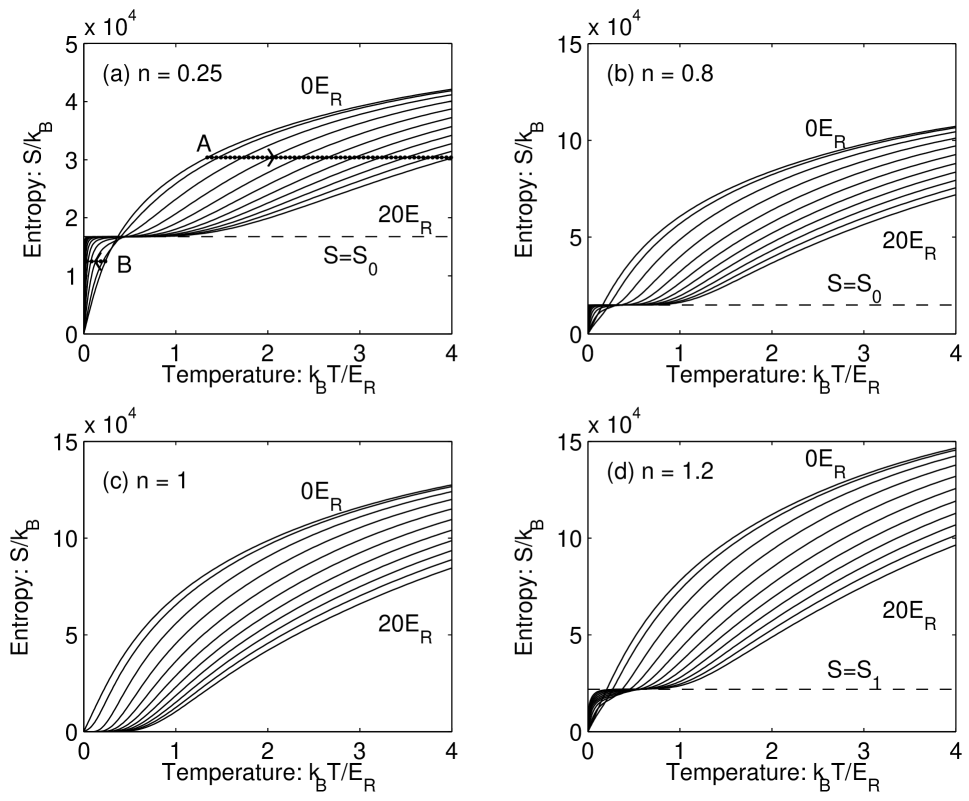
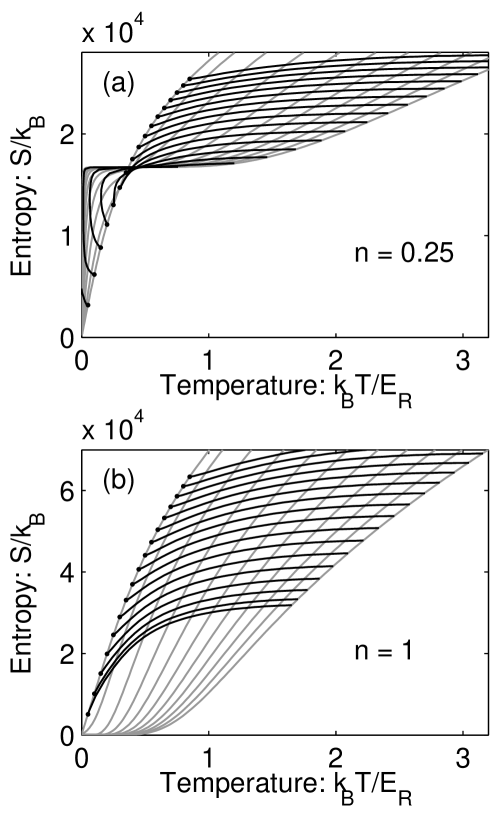
In Fig. 2 we show entropy-temperature curves for various lattice depths and filling factors . These curves have been calculated for a lattice with lattice sites along each spatial dimension, i.e. .
A general feature of these curves is the distinct separation of regions where adiabatic loading causes the temperature of the sample to increase or decrease, which we will refer to as the regions of heating and cooling respectively. These regions are separated by a value of entropy at which the curves plateau - a feature that is more prominent in the curves for larger lattice depths. This plateau entropy is indicated by a horizontal dashed line and is discussed below. For the case of unit filling factor shown in Fig. 2(c), this plateau occurs at , and only a heating region is observed.
We now explicitly demonstrate the temperature changes that occur during adiabatic loading using two possible adiabatic processes labeled and , and marked as dashed-dot lines in Fig. 2(a). Process begins with a gas of free particles in a state with an entropy value lying above the plateau entropy. As the gas is loaded into the lattice the process line indicates that the temperature increases rapidly with the lattice depth. Conversely process begins with a gas of free particles in a state with entropy below the plateau. For this case adiabatic lattice loading causes a rapid decrease in temperature. This behavior can be qualitatively understood in terms of the modifications the lattice makes to the energy states of the system. As is apparent in Fig. 1, the ground band rapidly flattens for increasing lattice depth causing the density of states to be more densely compressed at lower energies. Thus in the lattice all these states can be occupied at a much lower temperature than for the free particle case. As we discuss below, is the maximum entropy available from only accessing states of the lowest band. If , the temperature of the system must decrease with increasing lattice depth to remain at constant entropy. Alternatively, for the occupation of states in higher bands is important, and as the lattice depth and hence increases, the temperature must increase for these excited states to remain accessible.
III.2 Fermi-gas degeneracy
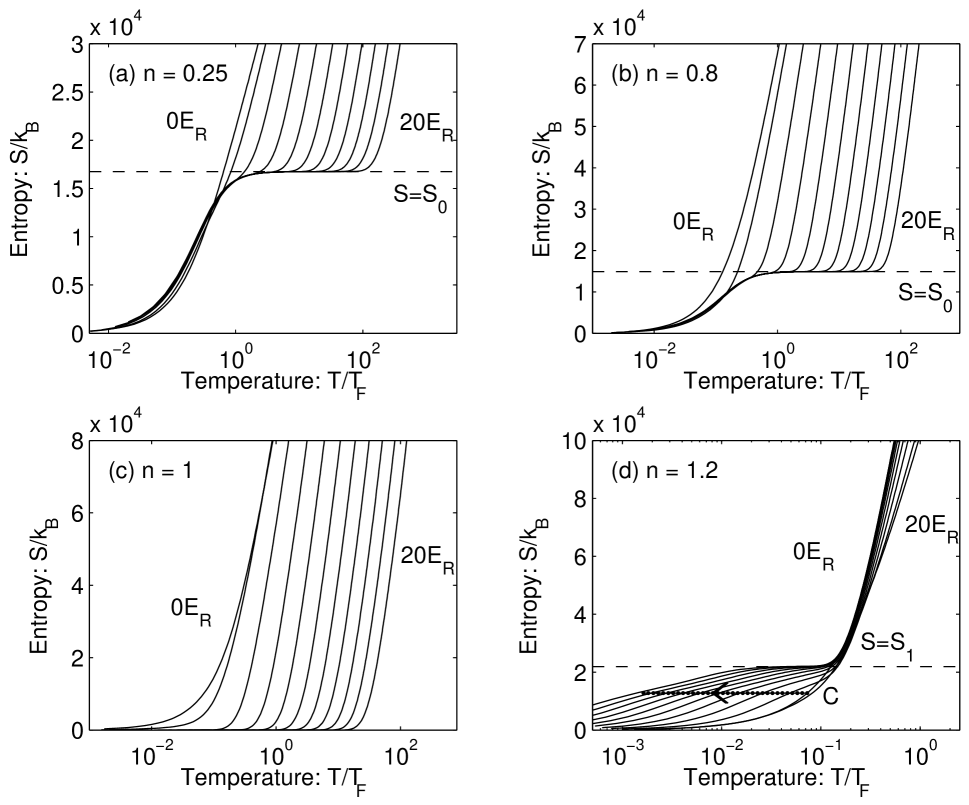
In addition to the effect that lattice loading has on the temperature of a Fermi-gas, it is of considerable interest to understand how the ratio of temperature to the Fermi temperature ()555The Fermi temperature is given by where (the Fermi energy) is the energy of the highest occupied single particle state for the system at . changes. Indeed, the ratio is the standard figure of merit used to quantify the degeneracy of dilute Fermi gases. In Fig. 3 we show how changes with adiabatic lattice loading for the same parameters used in Fig. 2. In Fig. 3 (a)-(b) the same general behavior is seen: Below the entropy plateau where cooling is observed (see Fig. 2 (a)-(b)), the ratio of remains approximately constant, so that there is little change in the degeneracy of the gas. Above the entropy plateau where heating was observed, the ratio of rapidly increases, so that in this regime the gas will rapidly become non-degenerate as it is loaded into the lattice. For the unit filling case (Fig. 3 (c)), there is no cooling regime, and heating is accompanied by a rapid increase in for all initial conditions of the gas. In Fig. 3 (d), where the filling factor is , rather different behavior is seen: In the cooling regime, the ratio of is rapidly suppressed as the temperature decreases, e.g. see the dotted line marked in Fig. 3 (d). This most desirable behavior could be used for example to prepare a Fermi-gas into a highly degenerate state where the BCS transition might be observable. We also note that for the same parameters but in the heating regime the ratio remains relatively constant.
We can give a simple explanation for the behavior of . For the three cases considered in Fig. 3 (a)-(c) the Fermi energy lies within or at the top of the first band of energy states. As shown in Fig. 1 the width of the ground band () decreases rapidly with lattice depth. Because the number of states contained in each band is constant (given by the number of lattice sites) both the Fermi energy and scale identically to , thus will rapidly decrease with lattice depth. In the cooling regime, the temperature scales in the same manner as (see Sec. III.4 below and Fig. 4), and thus the ratio remains approximately constant. In the heating regime increases slowly, while the ratio increases rapidly with lattice depth (on account of becoming small).
For the case considered in Fig. 3 (d) the filling factor satisfies and the Fermi energy lies in the second band. As the lattice depth increases the Fermi energy and now scale like , i.e. slowly increases with lattice depth (see Fig. 1). Thus in the regime where the temperature decreases, the ratio must become smaller. We note that the temperature reduction occurs because the width of the second band decreases with lattice depth.
III.3 Entropy plateau
In Figs. 2(a) and (b) a horizontal plateau (at the level marked by the dashed lines) is common to the entropy-temperature curves for larger lattice depths (). This occurs because for these lattices, the energy range over which the ground band extends is small compared to the energy gap to the excited band, and there is a large temperature range over which states in the excited bands are unaccessible, yet all the ground band states are uniformly occupied. The entropy value indicated by the dashed line in Figs. 2(a) and (b) corresponds to the total number of -particle states in the ground band. Since the number of single particle energy states in the ground band is equal to the number of lattice sites, the total number of available -particle states () is given by (valid for ). The associated entropy , which we shall refer to as the plateau entropy, can be evaluated using Sterling’s approximation
the validity condition for this result is that . An important case for which the above approximation is invalid is for i.e. we have a filling factor of , where . This case corresponds to the unit filling factor result shown in Fig. 2(c) where, as a result of the entropy plateau occurring at only a heating region is observed.
Similar entropy plateaus are observed for greater than unit filling (), e.g. as is seen in Fig. 2(d). For fermions such high filling factors necessarily means that higher bands are occupied, and in general the precise details of these higher plateaus will depend on the particle band structure of the lattice. E.g in the lattice we consider here (1) there are three degenerate first excited bands, that contain a total of single particle states. Because the first band is fully occupied only particles are available to occupy the excited band, and so the total number of available states is found according to the ground band result (III.3), but with the substitutions and . This result is shown as the dashed horizontal in Fig. 2(d) labelled as .
The suppression of the plateaus at specific integer filling factors (e.g. for and for ) corresponds to the Fermi-energy of the system approaching a band gap. Whenever this occurs it means that all the states below the gap are occupied at and excitations in the system require the promotion of particles into the excited band (above the gap). As all band gaps increase in size with lattice depth, the temperature of the system must increase for the entropy to remain constant. Thus in regimes where the Fermi-energy lies at a band gap the system only exhibits heating with increasing lattice depth (e.g. see Fig. 2(c)).
III.4 Scaling: Tight-binding limit at low temperatures and filling factors
Here we give limiting results for the entropy-temperature curves.
As discussed in Sec. III.3, when and the temperature is sufficiently low that , then only single particle states within the ground band are accessible to the system. In addition when the tight-binding description is applicable for the initial and final states of an adiabatic process, the initial and final thermodynamic variables are related by a scaling transformation.
In the tight-binding regime, which is good approximation for , the ground band dispersion relation takes the form
| (6) |
where is the lattice period, the ground bandwidth has already been introduced (e.g. see Fig. 1), and the wavevector is restricted to the first Brillouin zone. We refer the reader to Refs. Jaksch et al. (1998); van Oosten et al. (2001) for more details on the tight-binding approximation.
To illustrate the scaling transformation we consider an initial system in equilibrium with entropy , in lattice of depth sufficiently large enough for tight-binding expression (6) to provide an accurate description of the ground band energy states. If an adiabatic process is used to take the system to some final state at lattice depth (also in the tight-binding regime) it is easily shown that the macroscopic parameters of the initial and final states are related as
| (7) |
where , , or , and the scaling parameter is given by the ratio of the final and initial bandwidths. The requirement that the initial and final states are in the tight-binding regime is because the single particle states are then related as , which is essential for (7) to hold.
This type of scaling suggests that the occupations of the single particle levels are unchanged during the change in lattice: the products and are independent of , so the Fermi distribution, will also be independent of . This suggests that being adiabatic in this regime will not require redistribution through collisions and may allow the lattice depth to be changed more rapidly.
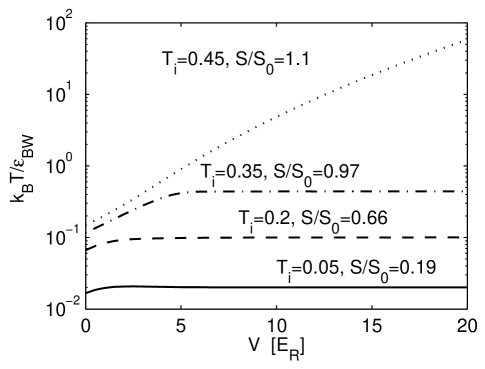
To confirm the scaling predictions, in Fig. 4 we plot the ratio of the temperature to ground bandwidth as a function of lattice depth along contours of constant entropy, (e.g. how varies along the process curves labelled and in Fig. 2(a)). In regimes where the scaling relationship (7) holds true, the ratio should be constant (independent of ). In Fig. 4 this is clearly observed for initial entropies less than and lattice depths . For single particle states of higher bands necessarily play an important role in the thermodynamic state of the system, and the scaling transformation clearly does not hold at any lattice depth, as is seen in the dotted curve in Fig. 4. For this case as the lattice depth increases the cooling effect of the ground band compression is offset by the f particles in the excited band that are lifted to larger energies as the gap () grows (see Fig. 1).
III.5 Adiabaticity
Finally we note that interactions between particles are essential for establishing equilibrium in the system, and understanding this in detail will be necessary to determine the timescale for adiabatic loading. In general this requirement is difficult to assess, and in systems where there is an additional external potential it seems that the adiabaticity requirements will likely be dominated by the process of atom transport within the lattice to keep the chemical potential uniform, though recent proposals have suggested ways of reducing this problem Sklarz et al. (2002) for Bose systems. A study of the effects of interactions or inhomogeneous potentials is beyond the scope of this work, however it is useful to assess the degree to which non-adiabatic loading would cause heating in the system. We consider lattice loading on a time scale fast compared to the typical collision time between atoms, yet slow enough to be quantum mechanically adiabatic with respect to the single particle states. This latter requirement excludes changing the lattice so fast that band excitations are induced, and it has been shown that in practice this condition can be satisfied on very short time scales Denschlag et al. (2002). We will refer to this type of loading as fast lattice loading, to distinguish it from the fully adiabatic loading we have been considering thus far.
To simulate the fast lattice loading we take the system to be initially in equilibrium at temperature for zero lattice depth. For the final lattice depth we fast load into, we map the initial single particle distribution onto their equivalent states in the final lattice, and calculate the total energy for this final non-equilibrium configuration (i.e. we calculate , where and are the single particle energies for the initial and final lattice depths respectively, and is the Fermi distribution function). This procedure assumes that there has been no collisional redistribution to allow the system to adjust to the lattice potential during the period it is changed. To determine the thermodynamic state the final distribution will relax to, we use the energy of the non-equilibrium distribution as a constraint for finding the equilibrium values of temperature and entropy. In general the final state properties will depend on the initial temperature, filling factor, and final depth of the lattice. To illustrate typical behavior we show a set of fast loading process curves in Fig. 5 for two different values of the filling factor.
These curves show, as is expected from standard thermodynamic arguments, that entropy increases for non-adiabatic processes, i.e. all loading curves in Figs. 5(a) and (b) bend upwards with increasing lattice depth. For the results with filling factor and for initial temperatures deep in the cooling regime (i.e. initial states far below the entropy plateau) a useful degree of temperature reduction can be achieved with fast lattice loading up to certain maximum depth. For example, the second lowest fast loading curve in Fig. 5(a) cools with increasing lattice depth up to , and then begins to heat for larger final lattice depths. Generally for low filling factors () where the ground band plays the dominant role in the system behavior at low temperatures, the entropy increase is due to mainly to the reshaping of the single particle energy states which occurs at low lattice depth 666As the lattice is ramped up the free particle dispersion relation rapidly changes to a tight-binding form (see Eq. (6)). As the lattice depth increases further the ground band energy states compress more (i.e. scale) but do not undergo further reshaping.. This effect can be reduced by taking as the initial condition for the fast loading a system in equilibrium at a finite lattice depth for which the dispersion relation is more tight-binding-like. This situation was considered in Ref. Hofstetter et al. (2002) in application to preparing a superfluid Fermi gas using in an optical lattice. Their results, for the case and an initial lattice depth of , predicted a useful degree of cooling.
As was demonstrated in Fig. 2(c), for filling factor adiabatic lattice loading causes the atoms to heat. This effect is exasperated by non-adiabatic loading, as shown in Fig. 5(b). This case also benefits from beginning in a lattice of non-zero depth, since at fixed temperature but increasing lattice depth (hence larger ), a smaller number of particles will be found in the excited bands.
IV Conclusion
In this paper we have calculated the entropy-temperature curves for fermions in a 3D optical lattice at various depths and filling factors. We have identified general features of the thermodynamic properties relevant to lattice loading, indicated regimes where adiabatically changing the lattice depth will cause heating or cooling of the atomic sample, and have provided limiting results for the behavior of the entropy curves.The results presented in this work suggest optimal regimes (filling factors and temperatures) which will facilitate the suppression of thermal fluctuations in a fermionic gas by lattice loading. These predictions should be easily verifiable with current experiments. We have also shown that for a sample of fermions with filling factor greater than one, the cooling regime is accompanied by a significant reduction of the temperature compared to the Fermi temperature. This regime would clearly be desirable for experiments to investigate as an avenue for producing dilute Fermi gases with . We have shown that many of our predictions are robust to non-adiabatic effects.
Acknowledgments
PBB would like to thank C.W. Clark (NIST) for support during the initial stages of this research. PBB would like to thank the referee for useful suggestions related to the effects of lattice loading on .
References
- DeMarco and Jin (1999) B. DeMarco and D. S. Jin, Science 285(5434), 1703 (1999).
- Schreck et al. (2001) F. Schreck, L. Khaykovich, K. L. Corwin, G. Ferrari, T. Bourdel, J. Cubizolles, and C. Salomon, Phys. Rev. Lett. 87(8), 080403 (2001).
- O’Hara et al. (2002) K. M. O’Hara, S. L. Hemmer, M. E. Gehm, S. R. Granade, and J. E. Thomas, Science 298, 2179 (2002).
- Modugno et al. (2002) G. Modugno, G. Roati, F. Riboli, F. Ferlaino, R. J. Brecha, and M. Inguscio, Science 297(5590), 2240 (2002).
- Gupta et al. (2003) S. Gupta, Z. Hadzibabic, M. W. Zwierlein, C. A. Stan, K. Dieckmann, C. H. Schunck, E. G. M. van Kempen, B. J. Verhaar, and W. Ketterle, Science 300, 1723 (2003).
- Regal et al. (2003) C. A. Regal, C. Ticknor, J. L. Bohn, and D. S. Jin, Nature 424, 47 (2003).
- Cubizolles et al. (2003) J. Cubizolles, T. Bourdel, S. J. J. M. F. Kokkelmans, G. Shlyapnikov, and C. Salomon, Phys. Rev. Lett. 91, 240401 (2003).
- Hofstetter et al. (2002) W. Hofstetter, J. I. Cirac, P. Zoller, E. Demler, and M. D. Lukin, Phys. Rev. Lett. 89, 220407 (2002).
- Rabl et al. (2003) P. Rabl, A. J. Daley, P. O. Fedichev, J. I. Cirac, and P. Zoller, Phys. Rev. Lett. 91, 110403 (2003).
- Viverit et al. (2004) L. Viverit, C. Menotti, T. Calarco, and A. Smerzi, Phys. Rev. Lett. 93, 110401 (2004).
- Santos et al. (2004) L. Santos, M. A. Baranov, J. I. Cirac, H.-U. Everts, H. Fehrmann, and M. Lewenstein, Phys. Rev. Lett. 93, 030601 (2004).
- Modugno et al. (2003) G. Modugno, F. Ferlaino, R. Heidemann, G. Roati, and M. Inguscio, Phys. Rev. A 68, 011601(R) (2003).
- Ott et al. (2004) H. Ott, E. de Mirandes, F. Ferlaino, G. Roati, G. Modugno, and M. Inguscio, Phys. Rev. Lett. 92, 160601 (2004).
- Orzel et al. (2001) C. Orzel, A. K. Tuchman, M. L. Fenselau, M. Yasuda, and M. A. Kasevich, Science 23(291), 2386 (2001).
- Greiner et al. (2002a) M. Greiner, O. Mandel, T. W. Hänsch, and I. Bloch, Nature 419, 51 (2002a).
- Greiner et al. (2002b) M. Greiner, O. Mandel, T. Esslinger, T. W. Hänsch, and I. Bloch, Nature 415, 39 (2002b).
- Mandel et al. (2003) O. Mandel, M. Greiner, A. Widera, T. Rom, T. Hänsch, and I. Bloch, Phys. Rev. Lett. 91, 010407 (2003).
- Rom et al. (2004) T. Rom, T. Best, O. Mandel, A. Widera, M. Greiner, T. W. Hänsch, and I. Bloch, Phys. Rev. Lett. 93, 073002 (2004).
- Kastberg et al. (1995) A. Kastberg, W. D. Phillips, S. L. Rolston, R. J. C. Spreeuw, and P. S. Jessen, Phys. Rev. Lett. 74, 1542 (1995).
- Blakie and Porto (2004) P. B. Blakie and J. V. Porto, Phys. Rev. A 69, 013603 (2004).
- Jaksch et al. (1998) D. Jaksch, C. Bruder, J. I. Cirac, C. Gardiner, and P. Zoller, Phys. Rev. Lett. 81, 3108 (1998).
- van Oosten et al. (2001) D. van Oosten, P. van der Straten, and H. T. C. Stoof, Phys. Rev. A 63, 053601 (2001).
- Sklarz et al. (2002) S. E. Sklarz, I. Friedler, D. J. Tannor, Y. B. Band, and C. J. Williams, Phys. Rev. A 66, 053620 (2002).
- Denschlag et al. (2002) J. H. Denschlag, J. E. Simsarian, H. Häffner, C. McKenzie, A. Browaeys, D. Cho, K. Helmerson, S. L. Rolston, and W. D. Phillips, J. Phys. B 35(14), 3095 (2002).
- Ashcroft and Mermin (1976) N. W. Ashcroft and N. D. Mermin, Solid State Physics (W.B. Saunders Company, 1976).