Interpretation of experimental data near -transition point in liquid helium
Abstract
The recently published experimental data for specific heat of liquid helium in zero gravity conditions very close to the –transition have been discussed. We have shown that these data allow different interpretations. They can be well interpreted within the perturbative RG approach and within our recently developed theory, as well. Allowing the logarithmic correction, the corresponding fits lie almost on top of each other over the whole range of the reduced temperatures (for bin averaged data) . However, the plot of the effective exponent suggests that the behaviour of , probably, changes very close to . To clarify this question, we need more accurate data for . In addition, we show that the experimental data for superfluid fraction of liquid helium close to within can be better fit by our exponents , than by the RG exponents and . The latter ones are preferable to fit the whole measured range where, however, remarkable systematic deviations appear. Our estimated value of the asymptotic exponent well agrees with the theoretical prediction .
Keywords: liquid helium, -transition, critical exponents
1 Introduction
It is widely accepted to consider the measurements in liquid helium near –transition point as a crucial test of validity of the theoretical predictions for the critical exponents, since these measurements are done with a high degree of accuracy much closer to the critical point than in any other experiments or numerical simulations. In particular, it is believed that accurate experimental measurements of specific heat of liquid helium very close to the -transition point in zero gravity conditions (in space) [1] provide a convincing evidence of overall correctness of the perturbative RG approach. The aim of our paper is to show that this conclusion is not unambiguous, since these experimental data as well as those of the superfluid fraction of liquid helium can be equally well or even better interpreted by a completely different set of critical exponents provided by our recently developed theory [2].
2 Interpretation of the specific heat data
It has been found in [1] that fits of experimental data for a wide range of reduced temperatures below by using two slightly different ansatz,
| (1) |
and
| (2) |
biased by the RG theoretical value of the correction–to–scaling exponent , provide well consistent values of the specific heat exponent in a good agreement with the value of the variational perturbative theory [3] as well as in a worse, but still acceptable, agreement with more recent estimates [4] and [5]. Apart from the exponent , some other quantities have been determined and compared with the RG values in [1]. However, the agreement is not so good to conclude that any theoretical approach, which does not agree with the perturbative RG, is wrong. In particular, the experimental quantity is , whereas the recent RG calculation (Ref. 63 in [1]) yields .
We have found that the measured data of [1] can be well reproduced also by an ansatz of the form
| (3) |
with fixed exponents and proposed in [2, 6]. It is consistent with the idea that specific heat can have a logarithmic correction, as discussed in [2]. The power–like singularity is recovered at . Note that in [2] (cf. Eq. (60) there) an ordinary term is related the behaviour of the correlation function within the range of wave vectors , where is the correlation length, whereas the logarithmic term can appear due to the contribution of the region . In this aspect, the ratio in (3) can be varied in a wide range of values.
From the raw data of [1] given in [7] we have produced the set of bin averaged data points by dividing each decade of the reduced temperature in 10 segments of equal width when looking in the logarithmic scale. One binned data point has been obtained by an averaging over and values within one segment, and only the data for the smallest values within a twice wider interval have been merged together into one bin to reduce the statistical error. In our binning, the averaged data points come as close to as , whereas those given in [7] extend only to .
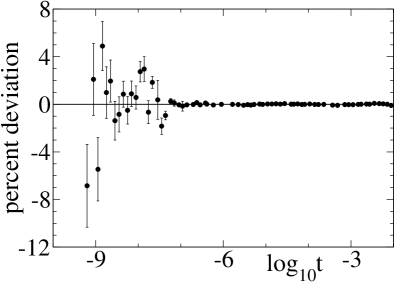
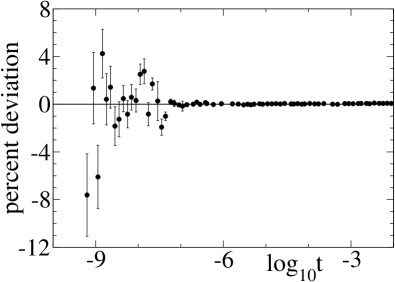
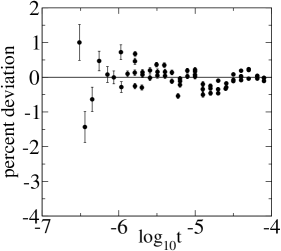
The percent deviations from the least–squares fits to (3) and (1) are shown in Fig. 1. The upper picture corresponds to (3) with fixed exponents and and coefficients , , , and , whereas the lower one represents the fit to (1) with exponents (fit parameter) and (fixed) and coefficients listed in Tab. II of [1]. As in some fits made in [1], we have assigned the error bars to the bin averages which originally had smaller errors. In this way, we have reduced the impact of these data points, located at relatively large values of the reduced temperature , where the asymptotic ansatz (3) is not very accurate. As we see from Fig. 1, both fits are almost identical in the whole range of the reduced temperatures. The fit with our exponents (top) is slightly worse at the largest values. It can be well understood, since (to ensure the stability of the fit parameters) we have neglected the subleading correction of the kind included in the other ansatz (1). Besides, our fit is even slightly better at the smallest values: the mean percent deviation for 10 smallest values is in our case of (3) and in the case of (1). These deviations are reduced to and , respectively, when shifting the values by nK within the experimental error bars [1].
Note that only the possibility and not the necessity of the logarithmic correction follows from the theory [2]. However, the presence of the logarithmic correction for specific heat, perhaps, is a quite general feature: the logarithmic singularity (as a special case of the logarithmic correction when ) of specific heat is a rigorously stated fact in 2D Ising model [8], and our Monte Carlo simulation data for 3D Ising model [6] also supports the logarithmic singularity. Our analysis of the experimental data for the superfluid fraction, made in Sec. 3, gives one more argument: it suggests that the exponent is remarkably larger than . According to the known scaling relation [8], the exponent then should be remarkably more negative than . It well coincides with the measured data [1] in the whole range of the reduced temperatures only if the pure power is perturbed by a logarithmic correction, as proposed by ansatz (3).
Considering as a fit parameter in (3), we obtain a value , which is quite close to our theoretical prediction . The small systematic deviation could be caused by the error of the asymptotic ansatz (3) at the largest values. This problem cannot be reliably solved by adding more correction terms or by narrowing the range of the fit, since the minimum of the for such fits is very shallow, i. e., the results become poorly defined.
Alternatively, we have fit the data within a moving window of the reduced temperatures to the simplest possible ansatz
| (4) |
where corresponds to the –th bin averaged data point. It yields the effective exponent , where belongs to the considered interval. For convenience, we have defined it as , where is the minimal and is the maximal value in the interval. By this method, the result converges to the true value of at irrespective to the error of the asymptotic ansatz at finite . It works also when the logarithmic correction is present, only in this case the convergence is very slow, like at . The only problem is that this method requires that the measurement errors both for and remain sufficiently small when approaching .
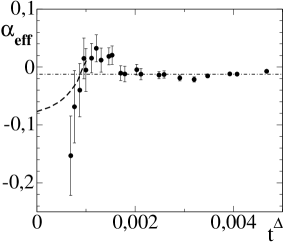
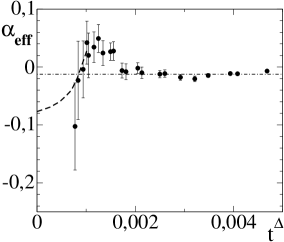
We have plotted in Fig. 2 the results for depending on (with our exponent ) obtained by using the unbiased values of (left), as well as the shifted values (for the same sets of measured points) corresponding to (right). In spite of the large error bars, these plots show certain trend, where the effective exponent tends to decrease below the (RG) value found in [1]. Moreover, we have verified that the same trend is observed in both cases when only the odd and only the even raw measurements (the original values listed in [7]) are used. Hence, we cannot exclude any striking scenario. For instance, could converge to our asymptotic value , as indicated by dashed lines, particularly, if we allow a small shift in values (right picture) within the experimental error bars. However, such a behaviour would mean that the logarithmic correction is absent, since the convergence is rather fast. It would imply also that the estimation of from the fit over the whole measured range is not valid: formally, such a fit looks good, but it effectively ignores the systematic deviations at the smallest values where the error bars are larger.
Due to the experimental errors, the results of our analysis of the effective exponent are not conclusive, they only point to a possible scenario. From an intuitive point of view, it does not seem plausible that such a remarkable change in the behaviour of the system could take place at so small reduced temteratures (). However, since the deviations from the asymptotic scaling law are caused by the corrections to scaling, an essential parameter is rather than , and the values of in Fig. 2 are not so extremely small. Besides, the critical region, where an asymptotic ansatz is valid, can be as narrow as even in a simple mean field model. An example is given in [9] (p. 75). From this point of view, it is possible that the deviations in Fig. 2 represent a real physical effect and not an artifact. On the other hand, random deviations in Fig. 1 too often are as large as standard deviations or even larger, therefore the unusual behaviour of in Fig. 2 can be ascribed also as an artifact.
3 Interpretation of the experimental data for
the superfluid fraction
Here we discuss the experimental data for the superfluid fraction in liquid . It decreases asymptotically (at ) as . It is believed (see [10] and references therein) that the exponent is equal to the correlation length exponent for the 3D model. In [2], the superfluid fraction of measured in [10] has been discussed with an aim to compare the experimentally observed behaviour at the temperatures closest to with our theoretical prediction [2].
The data listed in [11] allow a more precise comparison. For this purpose, first we have fit these data to the asymptotic ansatz
| (5) |
including two corrections to scaling. Similar fits over the whole measured range have been considered in [10, 11]. Note that at , used in [10, 11], the second order correction reduces to the analytical one, and (5) differs from the ansatz of [10, 11] only by a remainder term of higher order. The overall fits discussed in [10, 11] yield in agreement with the RG prediction and in disagreement with our value . However, these fits look really good only within , whereas remarkable systematic deviations appear at smaller values. This phenomenon was discussed in [11] and no reasonable explanation was found. In particular, the effect of gravity is negligible in these experiments [11] and the nK uncertainty in also does not explain these systematic deviations.
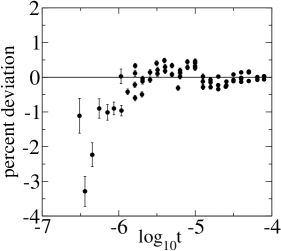
Our theory [2] provides an explanation. First, the data cannot be well fit within the whole measured range simply because the critical region, where the asymptotic expansion in powers is valid, is much narrower than . Second, the data can be well fit to (5) with our exponents and within a reduced range , which means that the measured data for are not anomalous, but the region of validity of (5) is as narrow as . The percent deviations from the least–squares fits within with our (left) and RG (right) exponents are shown in Fig. 3. As we see, in our case there are no essential systematic deviations, whereas in the RG case they are observed like in the case of the fit over the whole measured range [10, 11].
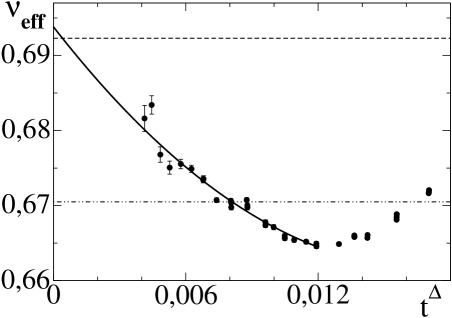
Similarly as in Sec. 2, we have evaluated also the effective exponent as the local slope of the vs plot within , where is the reduced temperature of the –th measurement and is the middle point of the fitted interval in the logarithmic scale. The results depending on (with our value ) are shown in Fig. 4. Evidently, the effective exponent tends to deviate above the value (dot-dot-dashed line) obtained in [10, 11]. On the other hand, the fit of this plot to a parabola (solid line) gives the asymptotic estimate in excellent agreement with our theoretical value . However, taking into account the nK uncertainty in the value [10], the error bars become larger, i. e., .
4 Conclusions
Although the opinion dominates in publications that the perturbative RG theory is strongly confirmed by very accurate measurements of the specific heat and the superfluid fraction in liquid helium near the –transition point, our current analysis shows that these experimental data can be well understood and interpreted also within our recently developed theory [2].
In summary we conclude the following:
-
1.
The critical exponents of the perturbative RG theory look preferable from a point of view that all measured data points must be necessarily fit on one curve and no logarithmic corrections are normally expected. However, if we allow the logarithmic correction to specific heat , our theory also provides a good fit of data for the whole measured range. Our fit then is slightly worse at the largest reduced temperatures and better at the smallest ones . As discussed in Sec. 2, the existence of the logarithmic correction is partly supported by our estimation of the exponent (Sec. 3), as well as by some general argument.
-
2.
The analysis of the effective exponent indicates that the behaviour of could be remarkably changed very close to , in such a way that the true asymptotic singularity is power–like (without the logarithmic correction) with the exponent which more probably is closer to our value than to the (RG) value obtained in [1]. However, this effect can be ascribed also as an artifact caused by the measurement errors. Further improvement of the experimental accuracy for would be very helpful to clarify this question.
-
3.
As compared to the RG exponents, our critical exponents are better consistent with the closest to data () for the superfluid fraction (cf. Figs. 3 and 4). A self consistent estimation in this case yields in agreement with our theoretical prediction . Since the fit over the whole measured range () in no case is really good, we argue that our way of estimation is preferable.
Acknowledgments
This work partly has been done during my stay in 2005 at the Institute of Physics of Rostock University, Germany.
References
- [1] J. A. Lipa, J. A. Nissen, D. A. Stricker, D. R. Swanson, T. C. P. Chui, Phys. Rev. B 68, 174518 (2003)
- [2] J. Kaupužs, Ann. Phys. (Leipzig) 10, 299 (2001)
- [3] H. Kleinert, Phys. Rev. D 60, 085001 (1999)
- [4] H. Kleinert, Phys. Lett. A 277, 205 (2000)
- [5] M. Campostrini, M. Hasenbusch, A. Pelissetto, P. Rossi, E. Vicari, Phys. Rev. B 63, 214503 (2001)
- [6] J. Kaupužs, Proceedings of SPIE 5471, 480 (2004); see also e–print cond–mat/0405197
- [7] EPAPS Document No. E-PRBMD0-68-041341, see EPAPS homepage http://www.aip.org/pubservs/epaps.html
- [8] Rodney J. Baxter, Exactly Solved Models in Statistical Mechanics, (Academic Press, London, 1989)
- [9] R. Mahnke, J. Kaupužs, I. Lubashevsky, Physics Reports 408, 1 (2005)
- [10] L. S. Goldner, G. Ahlers, Phys. Rev. B 45, 13129 (1992)
- [11] L. S. Goldner, N. Mulders, G. Ahlers, Journal of Low Temperature Physics 93, 131 (1993)