Mixed magnetic phases in (Ga,Mn)As epilayers
Abstract
Two different ferromagnetic-paramagnetic transitions are detected in (Ga,Mn)As/GaAs(001) epilayers from ac susceptibility measurements: transition at a higher temperature results from (Ga,Mn)As cluster phases with [110] uniaxial anisotropy and that at a lower temperature is associated with a ferromagnetic (Ga,Mn)As matrix with cubic anisotropy. A change in the magnetic easy axis from [100] to [110] with increasing temperature can be explained by the reduced contribution of cubic anisotropy to the magnetic properties above the transition temperature of the (Ga,Mn)As matrix.
pacs:
Ferromagnetism in Mn-doped type semiconductors can theoretically be understood by the exchange interaction between hole carriers and doped Mn spins Ohno2 ; Dietl2 ; Abolfath ; Keavney , which can be manipulated by electric-field Ohno or optical-hole generation Oiwa . Recent studies of magnetic anisotropy in (Ga,Mn)As/GaAs(001) epilayers, on the other hand, have shown a significant change in the magnetic anisotropy with increasing temperature Sawicki ; Welp ; Liu ; Hamaya2 ; uniaxial anisotropy along [110] ([110] uniaxial anisotropy) Tang ; Hrabovsky ; Sawicki ; Welp ; Liu ; Hamaya2 becomes predominant with increasing temperature Sawicki ; Welp ; Liu ; Hamaya2 as well as increasing hole concentrationHamaya4 . In spite of these intensive studies, the origin of [110] uniaxial anisotropy is still unclear within the current theoretical framework and an understanding of the change in the magnetic anisotropy with temperature is therefore of fundamental importance in revealing the physics of magnetic semiconductors.
The aim of this study is to give a comprehensive description of the magnetic anisotropy in (Ga,Mn)As epilayers. In this Letter, two different peaks in temperature-dependent ac susceptibility that are associated with ferromagnetic-paramagnetic transitions are clearly shown. The peak profile at a higher transition temperature has a considerable dependence on frequency, indicating a blocking process in magnetic clusters, while that at a lower transition temperature shows no frequency dependence. The results provide evidence that the magnetic transitions at the lower and higher temperatures are associated with magnetic phases with cubic anisotropy and [110] uniaxial anisotropies, respectively, and the crossover of the magnetic easy axis from to [110] can be interpreted by the ferromagnetic-paramagnetic transition of the magnetic phase with cubic magnetocrystalline anisotropy accordingly.
100 nm-thick (Ga,Mn)As epilayers were grown on top of a 400-nm-thick GaAs buffer layer grown at 590∘C on a semi-insulating GaAs (001) substrate using low-temperature molecular beam epitaxy (MBE) at 190 235∘C under an As-rich growth condition. To increase the hole carrier concentration, some epilayers were subject to post-growth annealing in an N2 atmosphere for 60 240 min at 250∘C Hayashi ; hole concentration was controlled by changing the Mn content and/or low-temperature annealing Hamaya4 . Hole carrier concentrations ( ionized Mn acceptor concentration) were measured with electrochemical capacitance-voltage (ECV) method at room temperature Moriya . In order to check a possible origin of magnetic anisotropy due to lattice strain, we characterized the crystal structures of all samples we grew using high resolution x-ray diffraction. The x-ray diffraction experiments revealed that lattice strain along [110] and [10] were equivalent; the (Ga,Mn)As unit cell was not elongated asymmetrically toward either of the [110] and [10] Hamaya4 so that we could rule out structural origins for the magnetic anisotropy. No precipitated phases were also detected in any of the samples. Magnetic properties were measured with a superconducting quantum interference device (SQUID) magnetometer and a physical property measurement system (PPMS).
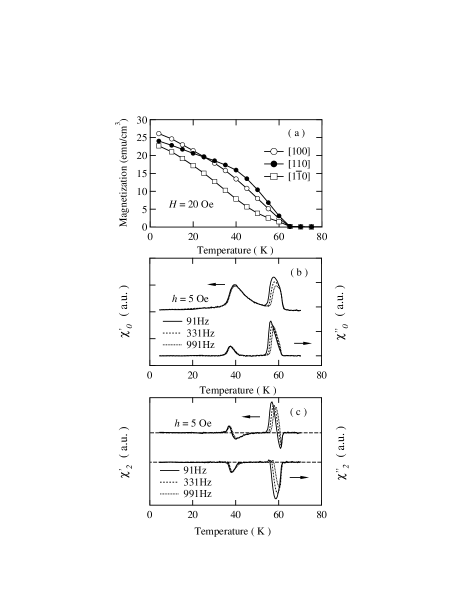
Figure 1(a) shows the temperature-dependent magnetization ( curves) of a typical (Ga,Mn)As epilayer with = 4.0 1020 cm-3 and a Curie temperature () of 62 K at various applied field orientations of [100], [110], and [10] . A dc magnetic field of 20 Oe was applied after the magnetization had almost saturated in a high magnetic field of 70 kOe at 4 K. In the low temperature regime ( 25 K), the magnetization is the largest for [100] of the three applied field orientations, indicating that the magnetic easy axis is parallel to [100] as indicated in recent reports Welp ; Liu ; Sawicki ; Hamaya2 . However, a crossover of the magnetic easy axis from [100] to [110] is seen at 25 30 K, being similar to previous reports which show that the predominant magnetic anisotropy changes from cubic magnetocrystalline anisotropy to [110] uniaxail anisotropy Welp ; Liu ; Hamaya2 ; Sawicki .
We measured the temperature dependent ac susceptibility in an ac magnetic field . In general, magnetization can be written as Bitoh
| (1) |
where m0 is the spontaneous magnetization, is the linear susceptibility, and , ,.. are the nonlinear susceptibilities. When the magnetic field is expressed as , an voltage is induced in a pick-up coil as
| (2) |
where A is a numerical factor depending on the dimensions of the coil and the filling factor of a sample, and + …, …, …,. If is small, the higher order ac signals at and 3 are directly related to the linear and nonlinear susceptibilities, 0 and 2.
Figures 1(b) and (c) show the temperature dependence of both in-phase and out-of-phase components of linear (0) and nonlinear (2) susceptibilities of the same sample used in Fig. 1(a). The measurements were made with an ac magnetic field amplitude of 5 Oe at a frequency of 91, 331, and 991 Hz, and the ac magnetic field was applied parallel to . Interestingly, two peaks are seen in the temperature-dependent and at all the frequencies we examined. The peak near ( 60 K) is relatively sharp compared with that at 37 K. Also, and have peaks and dips at around the same temperature. When single characteristic time describes the magnetic relaxation, dynamic susceptibility can be expressed as the Debye-type relaxation: and , and as a consequence should dip and shows a maximum since the characteristic time of a ferromagnet diverges at the Curie temperature. However, in Fig. 1(b) does not dip but peaks at 37 K and 60 K, indicating that the nonlinear component is becoming significant at the peak temperature () as in ferromagnets, spin-glass and cluster-glass materials Shirane ; Koyano . In addition, the nonlinear susceptibilities and peak at the same temperature. Therefore, the two maxima in and are related to ferromagnetic-paramagnetic phase transitions and there are two different magnetic phases in the sample. The behavior we observed is similar to previous reports on FexTiS2 single crystals Koyano and manganite perovskite La1-xCaxMnO3 single crystals Markovich , exhibiting spin-glass or cluster-glass and magnetic phase separation, respectively. Since all the samples show two peaks, we define the peak temperature far below as () and that near as () (reasons given below).

Comparing the temperature-dependent magnetic anisotropy with the ac susceptibility, we notice that the temperature where crossover of the magnetic easy axis occurs is close to () in the linear susceptibility so that cubic magnetocrystalline anisotropy and [110] uniaxial anisotropy are likely to be associated with the two magnetic phases. In this regard, we assume that one of the magnetic phases with () has cubic magnetocrystalline anisotropy while the other with () has [110] uniaxial anisotropy. This assumption is compatible with the fact that cubic magnetocrystalline anisotropy is dominant at 25 K whereas [110] uniaxial anisotropy is enhanced with increasing temperature. Also, the experimental results of magnetization reversal processes in (Ga,Mn)As, which indicate a significant contribution of [110] uniaxial anisotropy above 40 K, support the assumptionHamaya2 . Hereafter, we term phases with cubic anisotropy and uniaxial anisotropy the cubic phase and uniaxial phase, respectively.
Our recent experiment Hamaya4 and theoretical prediction reported by Dietl et al. Dietl2 indicated a strong correlation between magnetic anisotropy and hole concentration in (Ga,Mn)As. In order to further examine the correlation between magnetic transition temperatures and hole concentration, we plot () and () obtained from curves in 6 Oe at 1 Hz as a function of hole concentration in Fig. 2. Note that the data in Fig. 2 were taken from a sample before and after annealing with a fixed as well as a different Mn content. () clearly increases with increasing hole concentration, while () is reduced, in particular, in the high hole-concentration regime.
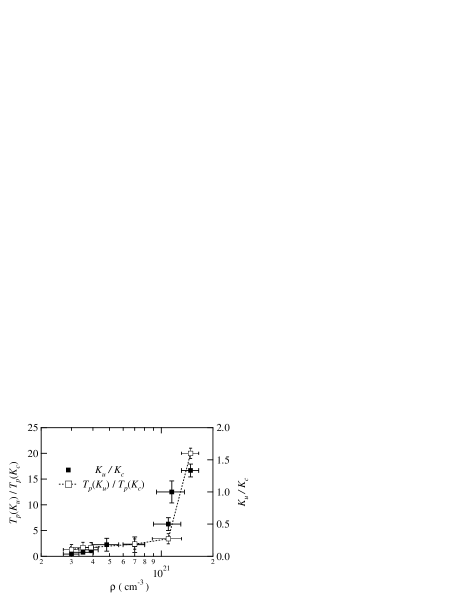
It has been demonstrated that magnetic anisotropy and magnetization reversal processes are qualitatively interpreted with the following equation Hamaya2 ; Hamaya4 , i.e., sin2( 45∘) (/4) sin22 cos( ), where Ku and Kc are the in-plane uniaxial and cubic anisotropy constants, M is the magnetization, H is the field strength, and is the direction of magnetization with respect to [100] in the film plane. Assuming that the hard axis curves are based on coherent rotation Welp ; Hamaya4 , we can estimate Ku and Kc using conditions E/ 0, 2E/2 0, and 135∘ ([10]) Hamaya4 . Figure 3 shows both numerically calculated u/c at 4 K and p(u)/p(c) obtained from the data in Fig. 2 as a function of hole concentration. It should be noted that u/c and p(u)/p(c) show a similar dependence on hole concentration with a marked increase in the high hole concentration regime. Therefore, this corroborates that p(c) and p(u) are attributed to cubic and [110] uniaxial anisotropy phases.
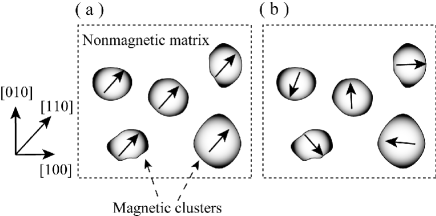
Note that the feature at around 60 K has a strong frequency dependence while that at around 37 K has no frequency dependence (Fig. 1). A similar behavior has been reported in La0.8Ca0.2MnO3 single crystals Markovich , where a strong frequency dependence of the linear susceptibility was found due to the blocking process of spin-clusters in the La0.8Ca0.2MnO3 matrix. From the frequency dependence of p(u), we deduce that magnetic phase with [110] uniaxial anisotropy, which we detected through ac susceptibility measurements, can be an assembly of (Ga,Mn)As magnetic clusters with a relatively high hole concentration and corresponding [110] uniaxial anisotropy in a (Ga,Mn)As matrix with low hole concentration and p(c). Since the (Ga,Mn)As matrix has a low Curie temperature, the ferromagnetic clusters are embedded in nonmagnetic (Ga,Mn)As and the magnetic moments are blocked along [110] in a temperature range of p(c)p(u) (Fig. 4(a)). When the temperature is raised to p(u), the magnetic moments of the clusters become random due to melting of the blocked moments (Fig. 4(b)). At temperatures below p(c), on the other hand, the cubic phase is now ordered ferromagnetically and competes with the ferromagnetism of the uniaxial cluster phase. If the [110] uniaxial anisotropy is relatively small, the magnetic easy axis of the whole epilayer should be governed by the cubic phase predominantly below p(c) Hamaya2 ; Welp ; Kato .
In general, these magnetic clusters have a characteristic superparamagnetic frequency given by exp( /), where represents the specific frequency of attempts for a cluster to change its spin orientation, is the magnetic anisotropy constant, and is the activation volume of the magnetic cluster Markovich . In the present case, Arrhenius plot vs p(u)-1 gives an activation energy of 0.73 eV to change the spin orientation. Assuming that is 5.0 102 erg/cm3 ref. , a typical magnetic cluster is about 82 nm in diameter, which is much smaller than the magnetic domain size above /2 observed in a previous report Welp . However, the domain imaging technique averages magnetic structures over an area with 1m in size so that our description is consistent with the observation of domain structures , provided that all clusters align crystallographically in the epilayer.
Now we discuss the process by which (Ga,Mn)As clusters are formed with [110] uniaxial anisotropy and the matrix is formed in (Ga,Mn)As epilayers. Mn interstitials generated during low-temperature growth processes are believed to diffuse toward substitutional Mn acceptors as a results of post-annealing due to local electric field Edmonds . This diffusion induces the local accumulation of substitutional Mn in the epilayer. The accumulation has also been inferred from a recent report by Welp et al., who proposed that [110] uniaxial anisotropy is due to preferential Mn incorporation induced by the presence of As dimers in every monolayer of the layer-by-layer grown epilayer Welp2 . Taking these considerations and our experimental results into account, the diffusion process facilitates the formation of highly substituted (Ga,Mn)As clusters in (Ga,Mn)As epilayers, in particular, in the high hole-concentration regime. On the other hand, the (Ga,Mn)As matrix is likely to have relatively low ionized Mn content, resulting in cubic anisotropy and a low Curie temperature. The description is also supported by our recent results, in which a significant enhancement in [110] uniaxial anisotropy is induced by low-temperature annealing in a sample with fixed Mn content Kato .
In conclusion, we have found that (Ga,Mn)As epilayers have two different ferromagnetic phases through ac susceptibility and magnetization measurements. A comparison of ac susceptibility with numerical calculation of the magnetic anisotropy constants indicates that phase with a lower ferromagnetic-paramagnetic transition temperature p(c) has cubic magnetocrystalline anisotropy while phase with a higher ferromagnetic-paramagnetic transition temperature p(u) shows [110] uniaxial anisotropy. The frequency dependence of the ac susceptibility have revealed that cubic anisotropy and [110] uniaxial anisotropy are attributed to a (Ga,Mn)As matrix and highly-substituted (Ga,Mn)As clusters, respectively. These results clearly demonstrate that a change in the magnetic easy axis from [100] to [110] with increasing temperature is a consequence of the marked decrease in the contribution of cubic anisotropy at around p(c).
We acknowledge Prof. Hiro Munekata for providing (Ga,Mn)As samples used in this study. K. H. would like to thank Dr. A. Oiwa for his useful discussions and acknowledge the financial support given by the 21st Century COE Program, “Nanomaterial Frontier Cultivation for Industrial Collaboration”, of Ministry of Education, Culture, Sports, Science and Technology (MEXT), Japan. This work was partially supported by the Scientific Research in Priority Areas “Semiconductor Nanospintronics”, provided by MEXT.
REFERENCES
References
- (1) H. Ohno, Science 281, 951 (1998).
- (2) T. Dietl, H. Ohno, and F. Matsukura, Phys. Rev. B 63, 195205 (2001).
- (3) M. Abolfath, T. Jungwirth, J. Brum, and A. H. MacDonald, Phys. Rev. B 63, 054418 (2001).
- (4) D. J. Keavney, D. Wu, J. W. Freeland, E. Johnston-Halperin, D. D. Awschalom, and J. Shi, Phys. Rev. Lett. 91, 187203 (2003).
- (5) H. Ohno, D. Chiba, F. Matsukura, T. Omiya, E. Abe, T. Dietl, Y. Ohno, and K. Ohtani, Nature (London) 408, 944 (2000).
- (6) A. Oiwa, Y. Mitsumori, R. Moriya, T. Slupinski, and H. Munekata, Phys. Rev. Lett. 88, 137202 (2002).
- (7) M. Sawicki, F. Matsukura, T. Dietl, G. M. Schott, C. Ruester, G. Schmidt, L. W. Molenkamp, and G. Karczewski, J. Supercond. 16, 7 (2003).
- (8) U. Welp, V. K. Vlasko-Vlasov, X. Liu, J. K. Furdyna, and T. Wojtowicz, Phys. Rev. Lett. 90, 167206 (2003).
- (9) X. Liu, Y. Sasaki, and J. K. Furdyna, Phys. Rev. B 67, 205204 (2003).
- (10) K. Hamaya, T. Taniyama, Y. Kitamoto, R. Moriya, and H. Munekata, J. Appl. Phys. 94, 7657 (2003).
- (11) D. Hrabovsky, E. Vanelle, A. R. Fert, D. S. Yee, J. P. Redoules, J. Sadowski, J. Kanski, and L. llver, Appl. Phys. Lett. 81, 2806 (2002).
- (12) H. X. Tang, R. K. Kawakami, D. D. Awschalom, and M. L. Roukes, Phys. Rev. Lett. 90, 107201 (2003).
- (13) K. Hamaya, T. Watanabe, T. Taniyama, Y. Kitamoto, Y. Yamazaki, A. Oiwa, and H. Munekata, (submitted).
- (14) T. Hayashi, Y. Hashimoto, S. Katsumoto, and Y. Iye, Appl. Phys. Lett. 78, 1691 (2001).
- (15) R. Moriya and H. Munekata, J. Appl. Phys. 93, 4603 (2003).
- (16) U. Welp, V. K. Vlasko-Vlasov, A. Menzel, H. D. You, X. Liu, J. K. Furdyna, and T. Wojtowicz, Appl. Phys. Lett. 85, 260 (2004).
- (17) T. Bitoh, T. Shirane, and S. Chikazawa, J. Phys. Soc. Jpn. 62, 2837 (1993).
- (18) T. Shirane, T. Moriya, T. Bitoh, A. Sawada, H. Aida, and S. Chikazawa, J. Phys. Soc. Jpn. 64, 951 (1995).
- (19) M. Koyano, M. Suezawa, H. Watanabe, M. Inoue, J. Phys. Soc. Jpn. 63, 1114 (1994).
- (20) V. Markovich, E. Rozenberg, A. I. Shames, G. Gorodetsky, I. Fita, R. Puzniak, D. A. Shulyatev, and Ya. M. Mukovskii, Phys. Rev. B 65, 144402 (2002).
- (21) H. Kato, K. Hamaya, T. Taniyama, Y. Kitamoto, and H. Munekata, Jpn. J. Appl. Phys. 43, L904 (2004).
- (22) The magnetic anisotropy constant is chosen from our recent study Hamaya4 which has estimated the value using magnetization curves and magnetoenergetics calculations.
- (23) K. W. Edmonds, P. Boguslawski, K. Y. Wang, R. P. Campion, S. N. Novikov, N. R. S. Farley, B. L. Gallagher, C. T. Foxon, M. Sawicki, T. Dietl, M. B. Naedelli, and J. Bernholc, Phys. Rev. Lett. 92, 037201 (2004).