Magnetic properties and thermal expansion of YbGaxGe2-x ()
Abstract
The composition dependence of the Yb valence and of the thermal expansion have been studied in the YbGaxGe2-x system. X-ray diffraction reveals that single-phased samples isostructural to YbGaGe are obtained in the range of . The magnetic susceptibility shows that the systems are almost nonmagnetic below room temperature, indicating a stable Yb2+ state for the range . The lattice constants as well as the lattice volume of these systems are found to decrease monotonically with decreasing temperature, suggesting the absence of zero thermal-expansion previously reported for YbGaGe.
keywords:
intermetallics , YbGaGe , X-ray diffraction , magnetic measurements , thermal expansion1 Introduction
Yb-based intermetallic compounds are of interest due to their anomalous physical properties concerning to valence fluctuation and/or heavy-fermion behavior [1, 2]. Yb ion can have two different valence state: divalent(Yb2+) and trivalent(Yb3+) states. The former has a closed 4 shell and thereby is nonmagnetic, whereas the latter has one hole in the 4 shell, leading to a total angular momentum of = 7/2. Valence-fluctuating Yb-compounds are characterized by nearly trivalent Yb ions at temperatures sufficiently higher than the valence-fluctuation temperature, . With decreasing temperature, valence admixture with the divalent state occurs, resulting in a nonmagnetic ground state with a large density of states. Since divalent Yb has a larger ionic radius than trivalent Yb, lattice expansion of Yb-based compounds can occur on cooling. The most prominent example may be YbInCu4, which shows a first-order valence-transition at = 40 K [3], at which the lattice abruptly expands more than 0.1% on cooling [4].
If such volume expansion occurs moderately to cancel the normal lattice shrinkage with decreasing temperature, the total volume change can become zero. Such zero thermal-expansion has recently been reported by Salvador et al. in the intermetallic compound YbGaGe [5]. It has been reported that the volume change is almost negligible in a wide temperature range from 300 K to 100 K [5]. The authors have also presented magnetic susceptibility data that suggest a Yb valence changes from Yb3+ at high temperatures (150 K) to nearly divalent state at low temperatures [5]. From these facts, they have concluded that the zero thermal-expansion is due to the valence change of Yb.
Lately, however, controversial results have been reported for YbGaGe by several authors [6, 7, 8]. Margadonna et al. have reported the absence of zero thermal-expansion. They have reported that the lattice volume shrinks similarly to normal substances below 700 K [6]. Instead, these authors have found a sudden volume change at 5 K without symmetry change, possibly due to a valence transition of Yb [6]. On the other hand, Muro et al. and Bobev et al. have shown that the magnetic susceptibility of YbGaGe corresponds to an almost nonmagnetic state, suggesting the Yb2+ state in whole the temperature range [7, 8]. These results are indicative of large sensitivity of magnetic and thermal properties of YbGaGe to the chemical composition or stoichiometry.
To clarify these discrepancies, we have studied the composition dependence of the physical properties of the YbGaGe system. In this paper, we report the solubility range of YbGaxGe2-x system, and their magnetic susceptibility and the thermal expansion.
2 Experimental
Polycrystalline samples were prepared by argon arc melting from pure metals. To compensate the loss of volatile Yb, a slightly richer amount of Yb (%) was charged. The samples were subsequently annealed in evacuated silica tubes at 750∘C for 4 days. For samples with Ge-rich compositions, a higher annealing temperature (850∘C) for 1 day was also examined. EDS analysis revealed that the samples thus prepared were almost of ideal chemical composition. Structure of samples were studied by powder X-ray diffraction at room temperature using Cu Kα radiation with a RIGAKU diffractmeter. The magnetic susceptibility was measured with a SQUID magnetometer (Quantum Design, MPMS5S) at 1000 Oe. The temperature dependence of the lattice constants was investigated by means of powder X-ray diffraction using another RIGAKU diffractmeter.
3 Results and discussion
At first, we have studied the stoichiometry for Yb1±δGaGe. SEM and EDS analysis have shown that the solubility range is within 3%, indicating that the chemical composition ratio of Yb:(Ga,Ge) is almost 1 : 2.
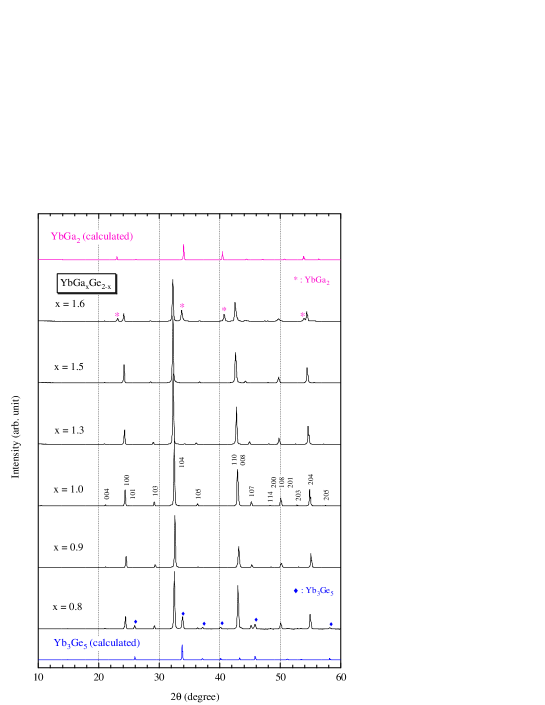
Next, we have studied the system YbGaxGe2-x. In Fig.1, powder X-ray diffraction patterns of YbGaxGe2-x are shown. The pattern of =1.0, i.e., YbGaGe, well agrees with a calculation (not shown) based on the structure parameter reported in ref [5]. It is seen in the figure that the YbGaxGe2-x compounds have the same crystal structure up to = 1.5, i.e., YbGa1.5Ge0.5. For , additional peaks are found to develop, which are attributed to the YbGa2 phase with CaIn2-type structure [9], as is seen in the figure, where the peaks from the YbGa2 phase are marked by asterisks.
For the solubility range has been found to be narrow. In Fig.1, the patterns for =0.9 and 0.8 are shown. One can see that peaks due to the Yb3Ge5 phase appear for . These data are those of the samples annealed at 850∘C and subsequently quenched. For samples annealed at 750∘C, the Yb3Ge5 phase is seen even for = 0.9, suggesting that the solubility range is narrower at low temperatures. From these results, it is concluded that the single-phase region of YbGaxGe2-x is .
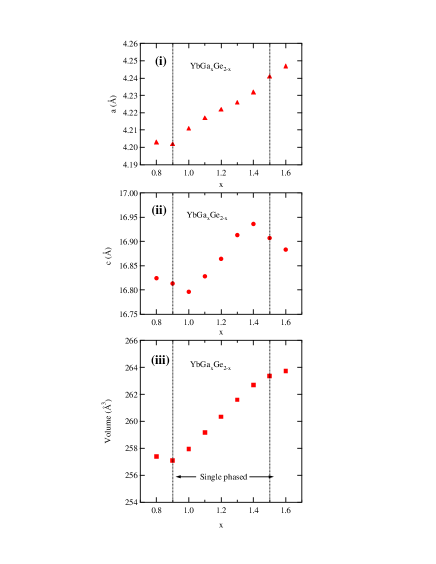
In Fig.2, the lattice constants of YbGaxGe2-x are shown. These lattice constants were determined by a least square method using the peak position of the (3 0 0), (1 1 12), (2 1 8), and (2 0 12) reflections. It is found that with increasing Ga concentration , increases monotonically. On the other hand, does not show a monotonic composition dependence. The origin of this is not yet clear. Nevertheless, the unit cell volume varies monotonically with in the single-phase region (). We have found that the standard deviation for the estimation of lattice constants becomes extremely large for when we use the () peaks with odd numbers, such as (2 1 7) and (2 0 11). This is probably due to stacking faults along the -direction for Ga-rich compositions, as is shown below.
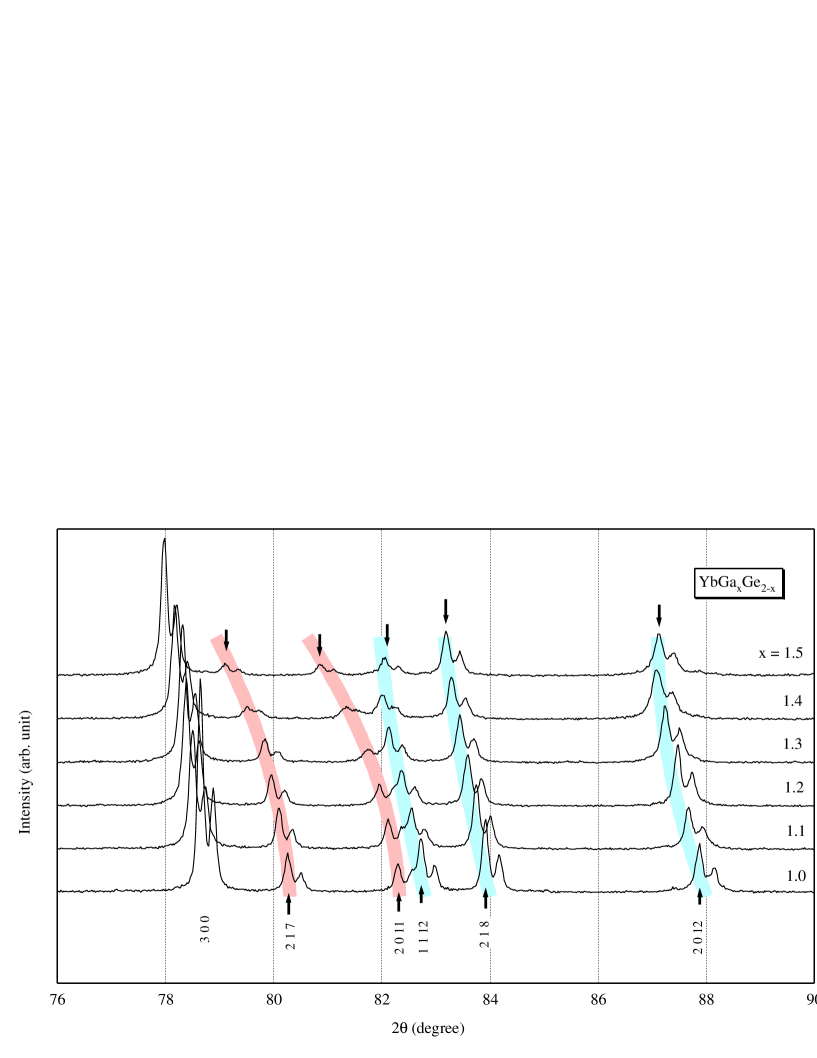
In Fig.3, X-ray diffraction patterns of YbGaxGe2-x at high angles are shown. One can see that the (3 0 0) peak monotonically shifts to lower angles with increasing , indicating the monotonic increase of . On the other hand, other reflections do not show such simple -variations. For the (2 1 7) and (2 0 11) reflections, the peaks shift to lower angles with increasing . Especially for , the peaks shift rapidly. In contrast, the (2 1 8) and (2 0 12) reflections do not shift rapidly to lower angles, or even shift to higher angles for . It is also noticeable that the intensities of the peaks with odd show a remarkable decrease for , whereas those with even are almost unchanged. These variations cannot be explained by an -dependence of the lattice parameters. It should be noted that for YbGaGe, the Ga-Ge layers are stacked along the direction with the sequence [5]. On the other hand, for YbGa2, the Ga layers stack as [9]. We speculate for YbGaxGe2-x with large , that the stacking of is inserted in the regular stacking. For the case of complete stacking, () reflection with odd should vanish. Thereby the insertion of in the regular stacking can lead to an incommensurate modulation of the -value of these plains, giving rise to an -dependence of the peak positions different from that expected from the lattice constants.
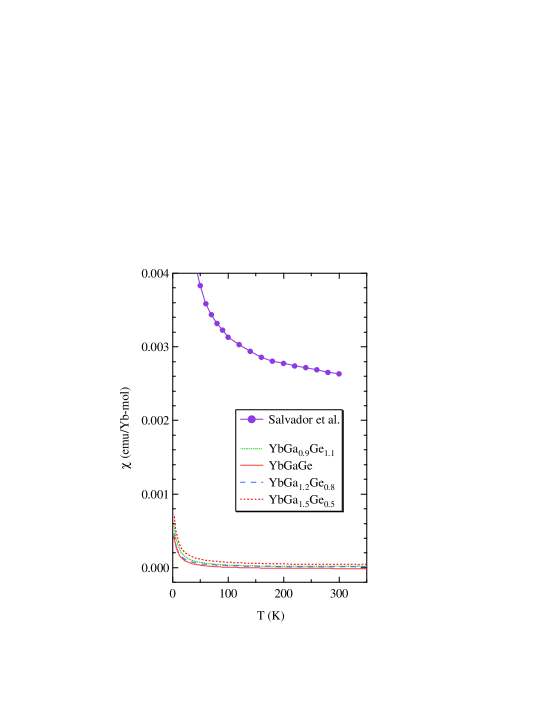
Having determined the single phase region to be , we show the physical properties of the YbGaxGe2-x system. In Fig.4, the magnetic susceptibility of YbGaxGe2-x is shown together with that reported by Salvador et al. in ref. [5]. In a good contrast to the data of ref. [5], our data show that the susceptibility of YbGaxGe2-x is extremely small in whole the range of . We have fitted the data between 150 and 300 K using a Curie-Weiss function: , where , , and are the Curie constant, Weiss temperature, and temperature-independent susceptibility, respectively. Here is written as , where is the concentration of Yb3+ per formula unit, the Avogadro number, the effective magnetic moment, and the Boltzmann constant. should be 4.54 for the case of Yb3+. The results of fitting have yielded a value of , which corresponds to . This indicates that most of the Yb ions are nonmagnetic, i.e., in the Yb2+ state. This result is consistent with the results of X-ray photoemission spectroscopy measurement on polycrystalline samples [10]. The low temperature increase in is then attributed to a small amount of impurities. Since the Yb2+ state is consistently dominant for all the measured, we conclude that the valence of the Yb ions in YbGaxGe2-x is divalent, independent of the chemical composition.
In addition, no magnetic transition was observed down to 3 K. In several samples, a very tiny transition was observed at 2.3 K, and this is attributed to the antiferromagnetic transition in a trace of Yb2O3, of which the Néel temperature is = 2.2 K [11]. This contrasts with the valence transition around 5 K suggested in ref. [6].
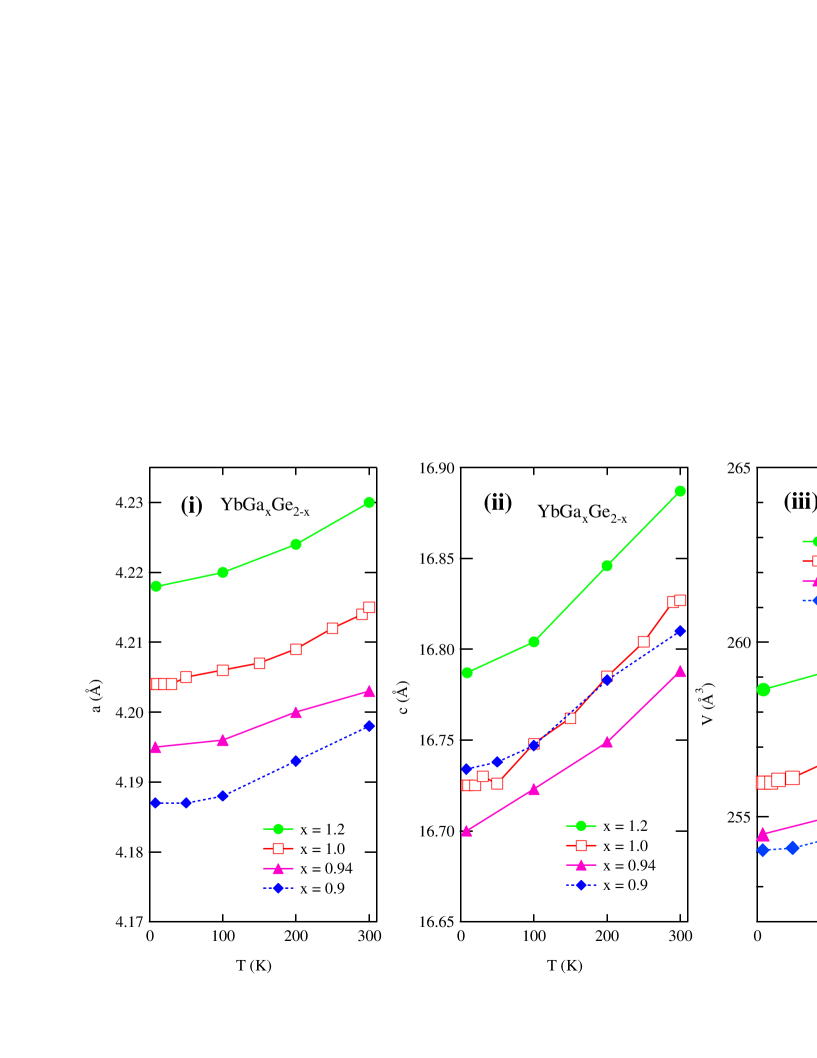
Since the ionic radius of Yb2+ is larger than that of Yb3+, a volume expansion with decreasing temperatures or zero thermal-expansion should not occur for these systems, as far as the valence-change mechanism is concerned. To confirm this expectation, we have studied the thermal expansion of YbGaxGe2-x, of which results are shown in Fig. 5. For YbGaGe, both and decrease monotonically with decreasing temperatures as in normal substances. As a result, the lattice volume also shows a monotonical decrease on cooling. This result for = 1.0 is consistent with that reported for YbGaGe by several authors [6, 7, 8]. Moreover, a similar lattice expansion is seen for the other samples, = 0.9, 0.94, and 1.2, where , , and the lattice volumes show a conventional decrease on cooling. This behavior well agrees with the divalent Yb state in these systems, because Yb2+ ions can no longer expand through a valence transition mechanisms.
In summary, we have determined the solubility range of the YbGaxGe2-x system. In the composition range of , it is found that single phase samples isostructural to YbGaGe are formed. The magnetic susceptibility of these samples reveals that the Yb ions are consistently divalent. This should lead a normal lattice shrinkage with decreasing temperature. In fact, X-ray diffraction shows normal lattice shrinkage on cooling in these systems. These results lead us the conclusion that the valence state of Yb in YbGaxGe2-x is not sensitive to the composition but is robustly divalent, and that a zero thermal expansion does not occur in YbGaxGe2-x for whole the composition range (), at least not via a valence transition mechanism.
The YbGaGe phase with Yb3+ ions may be obtained at much smaller , because Yb3+ favors smaller lattice volumes. However, such samples were not obtained by conventional arc melting or annealing technique. Other method such as high pressure synthesis may be useful.
The authors sincerely thank T. Yokoya for fruitful discussions and comments. They also thank T. Takabatake for sending us their preprint.
References
- [1] E. Bauer, Adv. Phys. 40 (1991) 417.
- [2] M. Laewenhaupt and K.H. Fischer, in Handbook on the Physics and Chemistry of Rare Earth, vol.16, p.1, edited by K.A. Gschneidner Jr and L. Eyring, 1993, Elsevier.
- [3] I. Felner and I. Nowik, Phys. Rev. B 33 (1986) 617.
- [4] I. Felner, I. Nowik, D. Vaknin, U. Potzel, J. Moser, G.M. Kalvius, G. Wortmann, G. Schmiester, G. Hilscher, E. Gratz, C. Schmitzer, N. Pillmayr, K.G. Prasad, H. de Waard, and H. Pinto, Phys. Rev. B 35 (1987) 6956.
- [5] J.R. Salvador, Fu Guo, T. Hogan, and M.G. Kanatzidis, Nature 425 (2003) 702, ibid (corrigenda), 426 (2003) 584.
- [6] S. Margadonna, K. Prassides, A.N. Fitch, J.R. Salvador, M.G. Kanatzidis, J. Am. Chem. Soc. 126 (2004) 4498.
- [7] Y. Muro, T. Nakagawa, K. Umeo, M. Itoh, T. Suzuki, and T. Takabatake, J. Phys. Soc. Jpn. 73 (2004) 1450.
- [8] S. Bobev, D.J. Williams, J.D. Thompson, and J.L. Sarrao, Solid State Commun. 131 (2004) 431.
- [9] U. Schwarz, R. Giedigkeit, R. Niewa, M. Schmidt, W. Schnelle, R. Cardoso, M. Hanfland, Z. Hu, K. Klementiev, and Y. Grin, Z. Anorg. Allg. Chem., 627 (2001) 2249.
- [10] K. Yamamoto et al., unpublished.
- [11] J.C.P. Klaasse, F.R. de Boer, and P.F. de Châtel, Physica 106B (1981) 178.