Zn and Ni doping effects on the low-energy spin excitations in La1.85Sr0.15CuO4
Abstract
Impurity effects of Zn and Ni on the low-energy spin excitations were systematically studied in optimally doped La1.85Sr0.15Cu1-yAyO4 (A=Zn, Ni) by neutron scattering. Impurity-free La1.85Sr0.15CuO4 shows a “spin gap” of meV below in the antiferromagnetic(AF) incommensurate spin excitation. In Zn:, the spin excitation shows a spin gap of 3 meV below . In Zn: and Zn:, however, the dynamical susceptibility at meV decrease below and increase again at lower temperature, indicating an in-gap state. In Zn:, the low-energy spin state remains unchanged with decreasing temperature, and elastic magnetic peaks appear below K then exponentially grow. As for Ni: and Ni:, the low-energy excitations below meV and 2 meV disappear below . The temperature dependence of at meV, however, shows no upturn in contrast with Zn: and Zn:, indicating the absence of in-gap state. In Ni:, the magnetic signals were observed also at meV. Thus the spin gap closes with increasing Ni. Furthermore, as increases, the magnetic peak width broadens and the peak position shifts toward the magnetic zone center ( ). We interpret the impurity effects as follows: Zn locally makes a non-superconducting island exhibiting the in-gap state in the superconducting sea with the spin gap. Zn reduces the superconducting volume fraction, thus suppressing . On the other hand, Ni primarily affects the superconducting sea, and the spin excitations become more dispersive and broaden with increasing energy, which is recognized as a consequence of the reduction of energy scale of spin excitations. We believe that the reduction of energy scale is relevant to the suppression of .
pacs:
Valid PACS appear hereI Introduction
In past years, a large number of neutron scattering studies have suggested that antiferromagnetic (AF) spin fluctuations are relevant to the mechanism of high- superconductivity. Significant features of AF spin correlations in exhaustively studied LSCO and YBCO are summarized as follows; (i) A well-defined gap with a gap energy opens below the superconducting transition temperature in the energy spectrum, which is often called “spin gap.” Note that the spin gap in neutron scattering appears at temperature lower than that observed in NMR, because neutron scattering detects not local spin behaviors but spatial structures of spins with a coherence. As for LSCO, the spin gap is observed only around the optimum doping concentration . Yamada et al. (1995); Lee et al. (2000, 2003) On the other hand, the spin gap of YBCO appears in the superconducting state and there exists a relationship in the region . Dai et al. (2001) (ii) In both LSCO and YBCO, the spin excitations appear at incommensurate positions ( 0), ( 0) in the high-temperature tetragonal (HTT) notation. Additionally, the incommensurability is proportional to in LSCO() Yamada et al. (1998) and YBCO(). Dai et al. (2001) However, it is ambiguous whether the incommensurate peaks of LSCO and that of YBCO have the same origin. For example, the incommensurate peaks of YBCO are not clearly separated due to the broadened peak. (iii) The magnetic excitation of YBCO is enhanced below at a particular energy () and a position ( ), which is called a magnetic resonance peak. The existence of the magnetic resonance peak in LSCO is still an open question. Tranquada et al. (2004a); Christensen et al.
To study whether a certain phenomenon is related to the superconductivity, reducing is very effective. There exist many ways for reduction; for example, crystal structure, magnetic field, and impurity substitution. Impurity substitution for Cu sites can be chosen so as to affect a particular property; ions with a different valence change carrier doping rate in the CuO2 plane, the ionic radius mismatch induces local distortions, and the spins of impurities affect magnetic correlations. Thus, we can control a particular parameter to investigate which parameter is most related to . Substitutions by divalent transition metal ions for Cu sites conserve the carrier doping level and hardly influence on the macroscopic crystal structure, which is reflected in the changes of lattice constants and structural phase transition temperature. In particular, non-magnetic ion Zn2+ (3d10, ) and magnetic ion Ni2+ (3d8, ) are suitable to understanding how magnetic interaction contributes to the high- pairing mechanism. It is known that the -suppression effect of Zn is stronger than that of Ni, unlike those for BCS superconductors. Furthermore, magnetic susceptibility measurements show that local magnetic moments induced by Zn are larger than that by Ni. Xaio et al. (1990) NMR studies for YBCO indicate that there exist staggered moments on Cu sites around Zn, Mahajan et al. (1994); Julien et al. (2000) suggesting that Zn induces local magnetic moments around itself. In scanning tunneling microscopy (STM) studies for impurity-doped Bi2Sr2CaCu2O8+δ (Bi2212) near the impurity site, Zn induces an intense quasiparticle scattering resonance, Pan et al. (2000) while Ni makes quasiparticle state near the superconducting gap. Hudson et al. (2001) These results indicate that effects of Zn on the superconductivity and the magnetism are different from those of Ni. For the study of impurity doping, we should choose a high- superconductor which overall behaviors have already been revealed and has the single CuO2 layer in order to avoid the ambiguity for which Cu site impurities are substituted. For this reason, LSCO is most suitable.
Systematic neutron scattering studies on impurity substitution had not been performed, because neutron scattering studies need large and homogeneous single crystals. It is even more difficult to prepare a single crystal with a correctly controlled impurity concentration. Recently, however, Kimura et al. have systematically studied Zn doping effects on the low-energy AF spin excitations for optimally doped La1.85Sr0.15CuO4 with various Zn concentrations, through strenuous efforts for crystal growth. Kimura et al. (2003); Kimura (2003) They have revealed that Zn induces a novel AF spin state in the spin gap, which they call an in-gap state. They also found that the induced state becomes more dominant and more static with increasing Zn. Combined with STM and SR studies which suggest that the superconductivity is excluded around Zn, Pan et al. (2000); Nachumi et al. (1996) they have concluded that the induced state appears in the non-superconducting region and that the induced state regions are spatially separated from the superconducting regions which exhibit the spin gap state.
In this paper, we report Zn and Ni doping effects on the low-energy AF spin excitations and the superconducting transition. Our purpose is to clarify the difference between the effects of Zn and those of Ni. We performed neutron scattering and magnetic susceptibility measurements in La1.85Sr0.15Cu1-yZnyO4 (Zn:, 0.008, 0.011, 0.017) and La1.85Sr0.15Cu1-yNiyO4 (Ni:, 0.018, 0.029).
II sample preparation and experimental details
Neutron scattering study for spin excitations requires large and spatially homogeneous single crystals due to weak signals. Moreover, for the study of the impurity effect, it is essential to control impurity concentrations correctly without changing other properties, for example, Sr concentration homogeneity and mosaicness. We controlled the size, shape and growth direction of crystals for all samples in order to unify experimental conditions and realize the quantitative comparisons of results among different samples.
Single crystals of La1.85Sr0.15CuO4, La1.85Sr0.15Cu1-yZnyO4 (Zn:, 0.008, 0.011, 0.017) and La1.85Sr0.15Cu1-yNiyO4 (Ni:, 0.018, 0.029) were grown using the traveling-solvent-floating-zone (TSFZ) method. Feed rods were prepared by the ordinary solid-state reaction method. Dried powders of La2O3, SrCO3, CuO, ZnO, and NiO were weighed and mixed. The mixed powder was ground and calcined at 900 oC for 20 h for four times in air. After several grindings and calcinations of powder, we added extra CuO of 2 mol% into the powder in order to compensate the loss of Cu during the crystal growth. The powder was formed into a cylindrical rod and the rod was hydrostatically pressed. We sintered the rod at 1250oC for 24 h in air. The solvent material with a composition of La:Sr:Cu:Zn(Ni)=1.85:0.15:(4-): for each was prepared. We use 0.3 g of the solvent and a La1.85Sr0.15Cu1-yAyO4 (A=Zn, Ni) single crystals as a seed rod. We controlled the growth direction of crystals by using the seed rod which the direction of cylinder is -axis. The TSFZ operation was carried out using infrared image furnaces (NEC Machinery Co., SC-4 and SC-35HD) with small two halogen lamps and double ellipsoidal mirrors. To cut off reflections of the light from high angles, a silica tube was partially covered with aluminum foils. This yields a sharp temperature gradient in the direction of crystal growth, which helps to stabilize the melting zone. The growth rate was kept constant at 1.0 mm/h, and both the feed and seed rods were rotated 30 and 15 rpm, respectively. We flowed mixed gas of argon and oxygen with the flow rate of 100 cm3/min.(Ar:20 cm3/min., O2:80 cm3/min.). Crystal growth conditions for all the samples were kept same and we maintained the conditions for 100 hours during crystal growth. After crystal growth, we put the crystal rod in water for 1 week, to check the inclusion of La2O3 which reacts with water and changes to La(OH)3. The appearance of La(OH)3 break the crystal, because the size of La(OH)3 is larger than that of La2O3. Finally, to eliminate oxygen deficiencies, all the crystals were annealed under oxygen gas flow at 900 oC for 50 hours, cooled to 500 oC at a rate of 10 oC/h and annealed at 500 oC for 50 hours.
The concentrations of La, Sr, Cu, Zn and Ni ions were precisely estimated by the inductively coupled plasma (ICP) analysis using Shimadzu ICPS-7500. Within the detection limit of the ICP analysis, no observable impurities were detected. We checked the spatial homogeneity of Sr, Zn and Ni ions by comparing the values for small portions of crystals taken at different points of each sample, and we confirm the macroscopic homogeneity of composition. The obtained values of Sr, Zn and Ni concentrations are summarized in Table 1. The values of Sr concentration for all the sample are within the measurement error and those of impurity concentrations are substantially larger than the error. These results show that we could control the impurity doping rate with keeping the Sr concentration. We also determined the structural phase transition temperature by neutron diffraction measurement. As temperature decreases, the crystal structure changes from high-temperature tetragonal (HTT) to low-temperature orthorhombic (LTO) at . The (072)ortho superlattice peak in the LTO notation appears below and we measured temperature dependence of the (072)ortho peak intensity. As seen in Table 1, the obtained values of for all the samples are almost same and consistent with that of LSCO (). Yamada et al. (1995) is very sensitive to the Sr concentration and the reduction rate is K at.%. Hence, these results show that the Sr concentration for all the samples are and Sr ions are doped homogeneously into the crystals. In the Zn-doped samples, becomes somewhat high with increasing the doping contents. On the other hand, of the Ni-doped samples is almost equal to that of the impurity-free sample. Gaojie et al. reported that the crystal structure of Zn-doped LSCO(, Zn:) is orthorhombic in the room temperature, while that of Ni-doped LSCO(, Ni:) remain tetragonal. Gaojie et al. (1997) Their results are consistent with our results; though Zn slightly increases , a small amount of impurities hardly affects the averaged crystal structure. Furthermore, we measured rocking curves of crystals by neutron diffraction. The full width half maximum (FWHM) are for all the samples, suggesting a good crystallinity.
| sample | Sr | Zn or Ni | |
| 0.142(8) | - | 186 K | |
| Zn: | 0.144(3) | 0.0044(4) | |
| Zn: | 0.147(4) | 0.0083(3) | 192 K |
| Zn: | 0.144(7) | 0.0112(5) | |
| Zn: | 0.145(2) | 0.0170(7) | 202 K |
| Ni: | 0.145(7) | 0.0090(3) | |
| Ni: | 0.144(6) | 0.0185(5) | 184 K |
| Ni: | 0.142(6) | 0.0287(8) | 182 K |
Inelastic neutron scattering experiments were performed with the Tohoku University triple-axis spectrometer (TOPAN) installed at the JRR-3M reactor in the Japan Atomic Energy Research institute (JAERI). The final energy was fixed at meV using the (002) reflection of a pyrolytic graphite analyzer. The horizontal collimator sequence were 40′-100′-S-60′-80′ (a low-resolution condition) and 40′-30′-S-30′-80′ (a high-resolution condition), where S denotes the sample position. A pyrolytic graphite filter and a sapphire filter were placed to reduce higher order reflections and fast neutrons. To compare magnetic signals quantitatively, these experimental conditions were unified throughout the experiments. Elastic neutron scattering experiments were performed using TOPAN for Zn-doped sample and ISSP triple axis spectrometer PONTA also in JRR-3M for Ni-doped sample. We selected the incident and final energies of 13.5 meV with the horizontal collimator sequence of 40′-30′-S-30′-80′ for the Zn-doped samples, and 14.7 meV with 40′-40′-S-40′-80′ for the Ni-doped samples. In order to increase the sample volume, the columnar-shaped crystals (typical size of each crystal was 5mmmm) were assembled and mounted in the (0) zone. Since we controlled the growth axis parallel to the -axis, all the crystal arrangements were kept identical. In this paper, we denote the crystallographic indices by the HTT notation if no specification is given. The crystals were mounted in alminum containers in which He gas was charged to act as a heat exchanger. 4He-closed cycle refrigerators were used to cool the samples down to 4 K or 10 K for inelastic scattering measurements, and a top-loading liquid-4He cryostat was used to cool down to 1.5 K for elastic measurements.
III results
III.1 suppression by impurity-doping
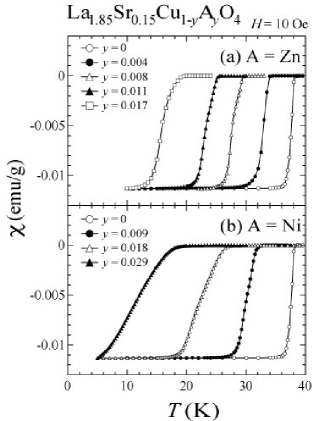
To estimate the reduction by impurity-doping, we measured the magnetic susceptibilities under zero-field cooling using a SQUID magnetometer. Figure 1 shows the shielding signals of the impurity-doped LSCO samples, and the signals are scaled so that the transition widths are compared. We define as the temperature at which the shielding signal is half of the low-temperature saturated value, and is defined as a difference between two temperatures where the signal is 10% and 90% of the low-temperature value. The values of and are listed in Table 2. The values of are in good agreement with those of previous studies, Xaio et al. (1990) and the reduction rates of are 12.5 K/% for Zn and 8.7 K/% for Ni. In addition, is almost constant regardless of the Zn concentration, while broadens with increasing Ni.

| sample | (midpoint) | |
|---|---|---|
| 36.8 K | 1.7 K | |
| Zn: | 32.6 K | 2.2 K |
| Zn: | 27.8 K | 2.5 K |
| Zn: | 23.2 K | 2.9 K |
| Zn: | 16.0 K | 3.8 K |
| Ni: | 30.0 K | 2.8 K |
| Ni: | 22.5 K | 5.9 K |
| Ni: | 11.6 K | 9.2 K |
One may consider that the broadening of is caused by a spatial inhomogeneity of Ni concentration. As for Ni:, we performed two measurements to investigate the inhomogeneity of Ni. We cut the crystal into several portions with the size of 1 mm3 and evaluated the Ni concentration of each portion by ICP analysis. The obtained values are identical within the measurement error, and the error corresponds to of 2 K. This result indicates no macroscopic inhomogeneity of Ni in the crystal. In addition, to check the microscopic inhomogeneity, we performed small angle neutron scattering measurements using the T1-2 double-axis spectrometer attached to a thermal guide in JRR-3M, which is owned by IMR, Tohoku University. If clusters of Ni ions are produced in a CuO2 plane, signals should appear in the small angle region corresponding to a characteristic scale of the cluster size. However, no such signal was detected in the range Å-1. If signals appear in the smaller angle region, one cluster contains Ni ions more than 30 and the mean distance between clusters exceeds 100Å. This situation seems improper, because such a segregation should introduce two superconducting transition temperatures. As shown in Fig. 1, though the superconducting transition broadens, the temperature dependence show no two-step behavior. Besides, as listed in Table 1, the structural transition temperature does not change by Ni-doping. If clusters of Ni ions exist, the averaged crystal structure should be affected. Thus, we believe that there is no cluster of Ni in the crystal. These behaviors, the broadening of and no change of , are already reported by Churei et al. Churei et al. (2003) and are consistent with our results. We conclude that there is no microscopic nor macroscopic inhomogeneity of Ni ions and that the broadening of is an intrinsic effect of Ni-doping.
III.2 Energy spectra of spin excitations
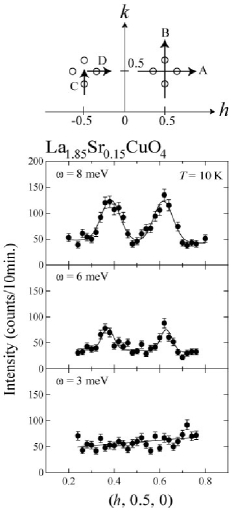
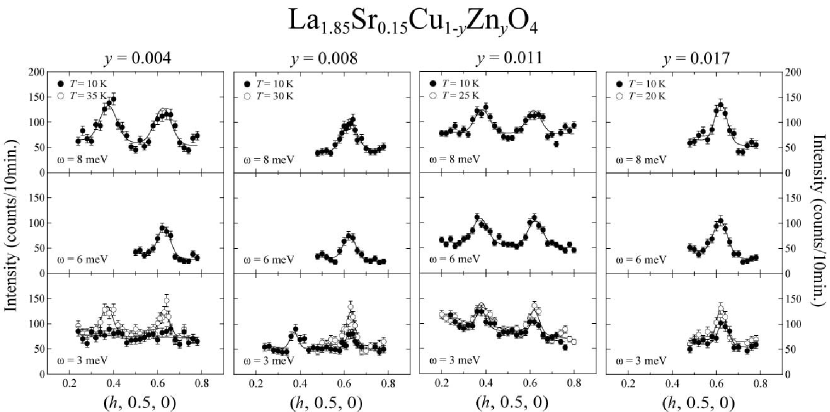
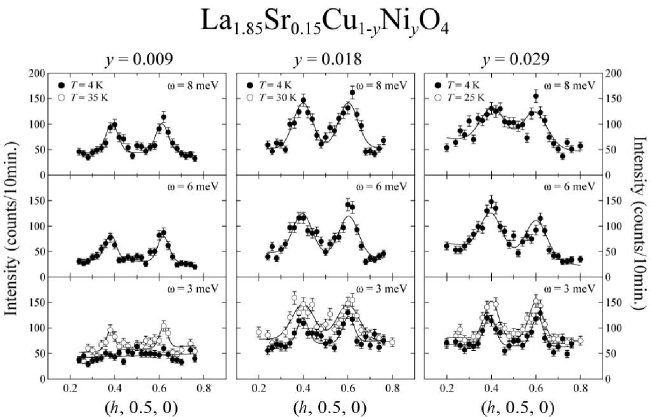
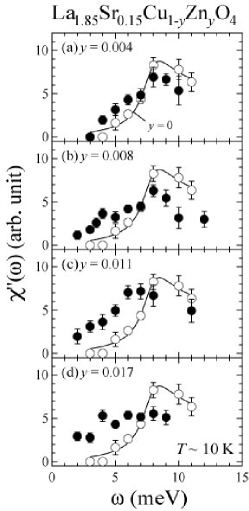
Figure 2 shows constant-energy spectra of the spin excitations at , 6, 8 meV for impurity-free La1.85Sr0.15CuO4. The scan through two incommensurate peaks corresponds to the trajectory A illustrated at the top of Fig. 2. At 10 K, a clear spin gap was observed and is consistent with the previous studies. Yamada et al. (1995); Lee et al. (2000) In Figs. 3 and 4, we show profiles at , 6, 8 meV for Zn:, 0.008, 0.011, 0.017 and Ni:, 0.018, 0.029, measured below (filled circles) and just above (open circles). The trajectories of scans and experimental conditions are identical to those for impurity-free LSCO.
In Zn: and Ni:, the spin excitations at meV disappear at low temperatures, suggesting a spin gap opening analogous to impurity-free LSCO. While, in Zn: and Ni:, the magnetic signals at meV appear at low temperatures. These results suggest that both Zn and Ni doping yield the appearance of low-energy spin excitations and that the effect of Ni is weaker that that of Zn. In Ni: and Ni:, as increases, the magnetic peak intensity increases and the peak width apparently broadens. The effect becomes marked with increasing Ni. On the other hand, Zn does not affect the peak profiles of spin excitations.
Figures 5 and 6 show energy spectra of the -integrated dynamical magnetic susceptibility at low temperatures for both the Zn and Ni doped samples. The open circles and solid lines in the figures denote for impurity-free LSCO. Here corresponds to the dynamical structure factor corrected with the thermal population factor,
| (1) |
Assuming that magnetic excitations consist of four equivalent incommensurate magnetic rods running along , we have estimated , where denotes the integration of magnetic signals around one incommensurate magnetic peak. Magnetic signals are fitted to Gaussian peaks and the fitting error corresponds to the error bar in Fig. 3. We also normalize the estimated by the intensity of transverse acoustic phonons at (2, -0.19, 0)ortho which should be proportional to the effective sample volume.
In the impurity-free sample, has a maximum at meV (=), reflecting the gap structure. In Zn: and Zn:, the value of remains unchanged, but decrease and around 3 meV increases instead. These results suggest that the spin gap state decreases and an additional low-energy spin state appears. In Zn:, shifts toward the lower energy. At last, in Zn:, the spin gap entirely vanishes, because of the reduction of spin gap energy and the development of the additional state.
of Ni: shows a behavior similar to that of Zn:; above meV decreases while below meV increases as compared to . In Ni:, the low-energy spin excitations are observable at meV, but that below meV disappears. The spin excitations above 2 meV are observed in Ni:, showing a tendency of gap closing. One of the most remarkable results is that the amplitude of for Ni: and Ni: is larger than those for and Ni:.


III.3 Temperature dependence of spin excitations
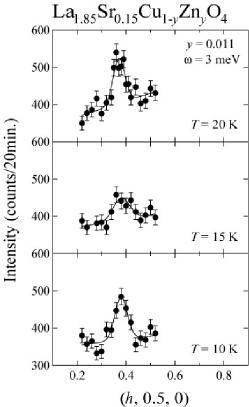
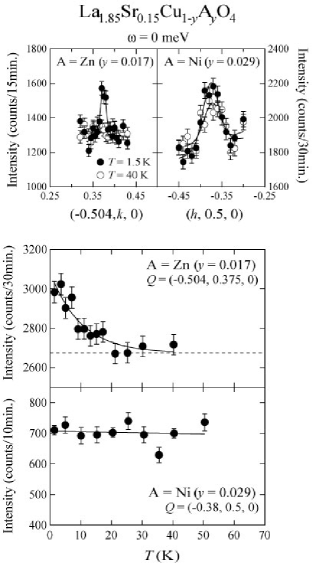
The temperature dependence of () at meV is shown in Fig. 7 for the Zn-doped samples. represents a fitted peak amplitude corrected with the thermal population factor. of Zn: decreases below , suggesting the gap opening similar to the impurity-free sample. In Zn: and Zn:, the magnetic signal once starts decreasing around , which suggests the gap opening. However, the signal increases again at lower temperature, indicating an emergence of the additional state. We show a clear proof of the upturn behavior. Figure 8 presents peak profiles of Zn: at , 15 and 20 K. Apparently, the peak intensity at K is smaller than those at and 20 K. This upturn behavior indicates two components of the spin excitations, and we regard them as an additive state and the spin gap state. We consider that the low-energy additive state is not caused by the gap shift nor broadening and that it is a novel spin state induced by Zn. Here we call the novel state an in-gap state, as defined by Kimura et al. Kimura et al. (2003); Kimura (2003) Note that the temperature which the signals begin to decrease in Zn: is lower than that of Zn:, suggesting that the temperature of gap opening is associated with . In Zn:, () shows no temperature dependence, implying the reduction of spin gap energy and the development of the in-gap state.
In Fig. 9, we show the temperature dependence of at meV for the Ni-doped samples. In Ni:, decreases below , suggesting a gap opening. of Ni: shows no upturn as opposed to those of Zn: and Zn:, which indicates the absence of the in-gap state. Thus, in the Ni-doped samples, the spin gap simply closes with increasing Ni, which is not caused by the development of the in-gap state but by the gap shift or broadening.
III.4 - dependence of incommensurate peaks
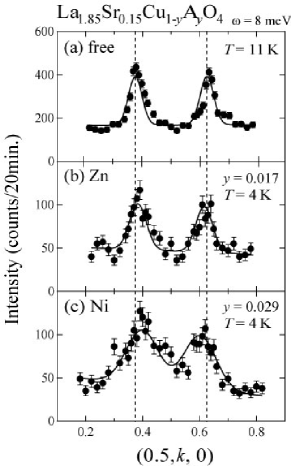
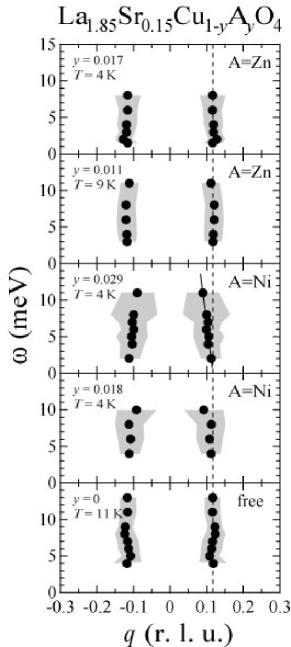
In order to investigate the impurity effects on the magnetic peak profile in more detail, we performed inelastic neutron scattering measurements under a high-resolution condition. Figure 10 shows peak profiles at meV for the impurity-free, the Zn-doped with Zn: and the Ni-doped with Ni: samples, taken at 11 K, 4 K and 4 K, respectively. In Zn:, clear incommensurate magnetic peaks were observed, and the peak width and position are almost identical to those of impurity-free sample. In contrast, the magnetic peak width broadens in Ni: and the peak position shifts toward the magnetic zone center (0.5, 0.5, 0). In Fig. 11, we plot - dependence of peak position for the impurity-free, the Zn-doped (Zn:, 0.017) and the Ni-doped (Ni:, 0.029) samples. Shaded regions represent FWHM of incommensurate magnetic peaks, and a dashed line shows the peak positions for the impurity-free sample. In the impurity-free sample, the peak positions and widths are independent of the excitation energy. The peak positions and widths of the Zn-doped samples almost coincide with those of the impurity-free sample. While in the Ni-doped samples, as the excitation energy increases, the peak positions apparently deviate from the dashed line and approach . Furthermore, the peak broadens more drastically with increasing energy. These results suggest that the spin excitations of Ni-doped samples are dispersive and broaden with increasing energy. These phenomena are characteristic of Ni and become marked with increasing the doping concentration.
III.5 Elastic scattering
We performed elastic scattering measurements for Zn: and Ni:. Figure 12 shows the peak profiles at and 40 K and the temperature dependence of the elastic peak intensity. In Zn: and Zn:, there is no observable signal, suggesting that the spin gap still opens. However, a very sharp peak was clearly observed in Zn: at K and the signals appear below K. On the other hand, in the Ni-doped LSCO, we found a broader peak, which shows no temperature dependence. Recently, Churei et al. have reported that no clear elastic peak was detected while a peak was observed at meV for La1.85Sr0.15Cu1-yNiyO4 (), with the instrumental energy resolution of meV. Churei et al. (2003) In our case, the instrumental resolution is meV, and we speculate that the observed “elastic” peaks arise from the inelastic signals which are detected due to a broad energy resolution. We discuss these elastic signals from the viewpoint of spectral weight shift of spin excitation in Sec. IV.1.
IV discussion
IV.1 Differences between Zn and Ni doping effects
We summarize impurity doping effects in Table 3. In both Zn: and Zn:, we observed an upturn behavior in the temperature dependence of at meV. This result suggests the existence of two components; an in-gap state and a spin gap state. On the other hand, there is no upturn for Ni-doping, indicating the absence of in-gap state. The elastic signal induced by Zn is also different from those by Ni: Zn induces a very sharp peak below K and the signal exponentially increases with cooling, while we found a broad peak which shows no temperature dependence in the Ni-doped LSCO. Hirota et al. reported that Zn-doping of shifts the spectral weight of the spin excitations from the inelastic to the quasi-elastic region at low temperature. Hirota et al. (1998); Hirota (2001) We consider that the increase of elastic signal at low temperature is owing to the spectral-weight shift resulting from the development of the in-gap state. As for Ni-doping, the absence of the in-gap state yields no shift of the spectral weight, leading to no elastic signal.
| Zn | Ni | |
| almost unchanged | broadening | |
| - spin gap state - | ||
| gap | slight gap shift | gap shift/broadening |
| excitations | almost unchanged | enhance, dispersive |
| in-gap state | ||
| elastic signals | ||
| non-SC island | : large | : small or 0 |
As for the spin gap state in the Zn-doped LSCO, the gap slightly moves to the lower energy, but profiles of spin excitations are almost unchanged. On the contrary, Ni changes the spin excitations drastically: The spin gap shifts or broadens, and moreover, is enhanced and the spin excitations become dispersive. Ni strongly affects not only the spin gap state but also the superconducting transition unlike Zn-doping. The transition width is almost constant as a function of the Zn concentration, while broadens with increasing Ni. We speculate that the effects on the spin gap state are associated with the change of the electronic state of the superconductivity.
For impurity-doped systems, inhomogeneous pictures have been proposed Nachumi et al. (1996); Adachi et al. (2004a, b); impurities make the non-superconducting island with radius in the superconducting sea, and local moments reside in the island. In our results, Zn-doping yields two components in magnetic excitations, and we regard them as the in-gap state in the island and the spin gap state in the sea. We consider that the spin correlations in different islands are connected across the superconducting sea, which we call an inter-island correlation. We discuss the inter-island correlation later. In the Ni-doped LSCO, we observed no evidence for the in-gap state. However, SR studies and uniform susceptibility measurements suggest that Ni also induces local moments in a non-superconducting island similar to Zn. Adachi et al. (2004a, b); Terascon et al. (1987); Xaio et al. (1990); Nakano et al. (1998) Neutron scattering at a finite wave vector detects not local spin behaviors but spin correlations with a certain coherence. If spin correlations are considerably short, we may not detect signals due to a too broadened peak profile. In the case of Ni-doping, we speculate that spins only correlate within an individual island due to smaller . In fact, a recent SR study of impurity-doped LSCO suggested that the island in a Ni-doped sample is smaller than that of a Zn-doped sample. Adachi et al. (2004b) Thus, we conclude that the in-gap state is invisible and that we only observed the spin state of superconducting sea in the case of Ni-doping.
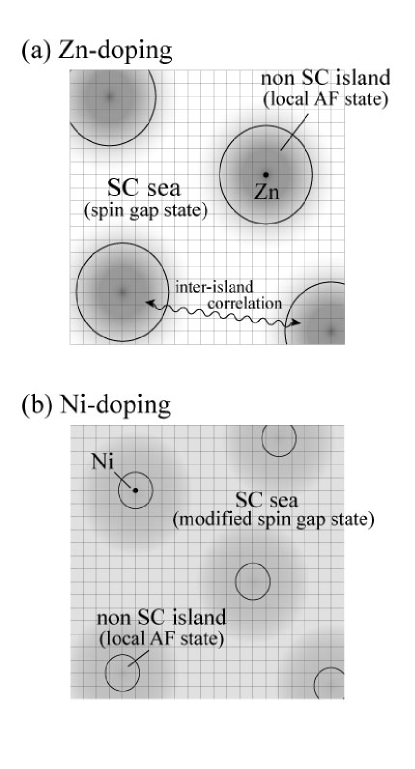
We schematically show our concept in Fig. 13, from a viewpoint of the inhomogeneous picture. Zn induces non-superconducting islands and hardly affects the superconducting sea, so that the spin gap state and are almost unchanged. While Ni primarily effects on the sea. In other word, Ni affects the electronic and magnetic state of the superconductivity, leading to the modified spin gap state and the broadening of . We believe that the gap is filled by the development of the in-gap state and the slight gap shift in the case of Zn-doping, while the gap shift or broadening simply closes the gap for Ni-doping.
IV.2 Zn doping effects; the in-gap state
A primary effect by Zn on the spin excitations is the appearance of in-gap state. Most obvious evidence for the in-gap state is the upturn in the temperature dependence of at meV. Previously Kimura et al. reported the upturn behavior in Zn:. Kimura et al. (2003); Kimura (2003) In the present study, we also confirmed the upturn behavior in Zn:. In YBa2(Cu1-yZny)3O6.97 (), similar results have been reported by Sidis et al. Sidis et al. (1996) Their inelastic neutron scattering measurements showed that magnetic signals emerge around meV while the spin gap is retained, and that at meV is almost temperature independent below . Their results indicate the coexistence of the in-gap state with the spin gap state at low temperature, signifying that the appearance of in-gap state is a universal phenomenon in Zn-doped high- cuprates. Note that the in-gap state appears at the same position as that of the normal and high energy states for both LSCO and YBCO. Therefore, Zn locally slows spin fluctuations without modifying the AF wave vector. In other words, Zn seems to act as a pinning center of AF spin fluctuations.
As for Zn:, the in-plane spin correlation length ( 80 Å) of the in-gap state is much longer than ( 42 Å), which corresponds to the mean distance between the nearest-neighbor Zn ions. These results indicate that the spin correlations of the in-gap state do not result from the local AF coherence in an individual island, but from the inter-island correlation. One may argue that it is caused by an overlap of islands. However, our results show the coexistence of the spin gap and the in-gap state (See Fig. 7), suggesting a phase separation of islands and sea. Therefore we conclude that induced moments in an island correlate with those in spatially separated islands.
IV.3 A threshold in Ni doping effects
We observed that the amplitude of for Ni: and Ni: is much larger than those for and Ni:, signifying that there exists a certain threshold between Ni: and Ni:. We speculate that the threshold corresponds to a critical Ni concentration where the valence of Ni ions changes; Nakano et al. have reported that no Curie term appears in the uniform susceptibility measurements below the critical Ni concentration Nakano et al. (1998). They also reported that the characteristic temperature which exhibits a broad peak, so-called , increases with increasing Ni below . On the other hand, the Curie term appears and does not change above . If the valence of Ni ions are not divalent, the effective hole concentration should change, leading to the variation of which is susceptible to . From these results, they conclude that Ni ions are substituted for Cu ions as Ni3+ ( : low-spin state) below and Ni2+ () above ; Ni3+ has the spin of as well as that of Cu2+, indicating that the Ni3+ substitution hardly affects the spin correlation in the CuO2 plane. In our result, of Ni: is almost same as those of except for a slight gap broadening. We consider that this behavior of Ni: is consistent with the absence of the Curie term and the reduction of below ( for ).
IV.4 Spin excitations: a possible scaling with
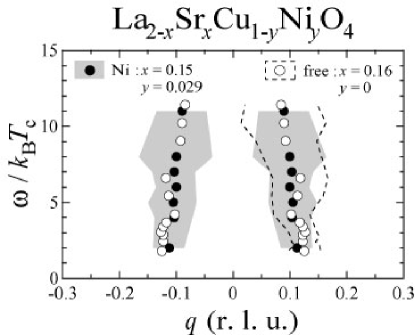
Recently, quite similar spin excitations are discovered in both YBCO Hayden et al. (2004) and La2-xBaxCuO4 (LBCO) Tranquada et al. (2004b) by a time-of-flight neutron spectrometer which covers a wide range of energy: The low-energy spin excitations form incommensurate peaks, and the peaks disperse inwards toward . At a characteristic energy, which is called in YBCO, the peak is found at a commensurate position . In higher energy region, the excitations disperse outwards and form a square-shaped continuum. Furthermore, the dispersive excitations at low-energy are observed in LSCO (), Christensen et al. though the commensurate peak and the dispersion in higher energy region are not yet confirmed. These results suggest that such dispersive excitations are a common feature in the high- cuprates. In our study, we measured spin excitations in the low energy region meV, so that we cannot detect the dispersive excitations in the impurity-free and the Zn-doped samples. However, to our surprise, the present results show that the spin excitations of Ni-doped samples are dispersive and broaden with increasing energy. These behaviors are very similar to those of impurity-free LSCO Christensen et al. , when the energy scale of spin excitations is adjusted. We plot the dispersion of spin excitations scaled to as shown in Fig. 14. This behavior indicates that Ni reduces the energy scale of spin excitations which associates with . A previous neutron scattering study of YBCO reported that Ni reduces with conserving the ratio , while such a shift is much smaller in the Zn-doped sample. Sidis et al. (2000) Furthermore, Cu NQR study of Ni-doped YBCO has shown that all the 1/ data in the normal state are on a universal curve, when 1/ is plotted against . Since 1/ is related to , the universality of 1/ implies that AF spin fluctuations are scaled to upon Ni-doping. Tokunaga et al. (1997) These results are consistent with ours, and we consider that these behaviors are consequences of the reduction of energy scale of spin excitations by Ni. However, we cannot affirm how precisely the spin excitations are scaled to , because we measured in the narrow energy region ( meV). Further inelastic neutron scattering studies in higher energy region are strongly required.
V conclusion
Zn-doping induces local moments within individual non-superconducting islands and the islands are spatially separated from the superconducting sea, which is hardly affected by Zn. At low temperature, the local moments among different islands correlate, leading to the emergence of an in-gap state. The in-gap state appears at the same position in the normal and high energy states, and Zn seems to act as a pinning center of AF spin fluctuations. We consider that Zn reduces the volume fraction of the superconducting regions, which results in the reduction of .
We observed no evidence for the in-gap state in the case of Ni-doping. We consider that the invisibility of the in-gap state arises from undeveloped spin correlations among different islands, because the islands are smaller than those of Zn-doping. Instead, Ni primarily effects on the superconducting sea; the spin gap shifts or broadens, and Ni makes the spin excitations get broader and dispersive. These behaviors are recognized as a consequence of the reduction of energy scale of spin excitations. We believe that the reduction of energy scale is relevant to the suppression of .
Acknowledgements.
We are grateful to M. Matsuura for experimental supports and critical discussions throughout the project. We are indebt to S. Hosoya and M. Onodera for technical helps in the crystal growth. Neutron scattering experiments were supported by T. Asami, Y. Kawamura, K. Nemoto, K. Ohoyama, and S. Watanabe. We also thank T. Adachi, T. Churei, Y. Endoh, M. Fujita, H. Hiraka, K. Ishida, Y. Itoh, K. Iwasa, C. H. Lee, M. Matsuda, Y. Murakami, Y. Noda, and K. Yamada for stimulating discussions. This work was supported in part by a Grant-In-Aid for Scientific Research (B) (15340109, 2003-2004) and a Grant-In-Aid for Encouragement of Young Scientist (13740198, 2001-2002) from the Japanese Ministry of Education, Culture, Sports, Science and Technology.References
- Yamada et al. (1995) K. Yamada, S. Wakimoto, G. Shirane, C. H. Lee, M. A. Kastner, S. Hosoya, M. Greven, Y. Endoh, and R. J. Birgeneau, Phys. Rev. Lett. 75, 1626 (1995).
- Lee et al. (2000) C. H. Lee, K. Yamada, Y. Endoh, G. Shirane, R. J. Birgeneau, M. A. Kastner, M. Greven, and Y.-J. Kim, J. Phys. Soc. Jpn. 69, 1170 (2000).
- Lee et al. (2003) C. H. Lee, K. Yamada, H. Hiraka, C. R. VenkateswaraRao, and Y. Endoh, Phys. Rev. B 67, 134521 (2003).
- Dai et al. (2001) P. Dai, H. A. Mook, R. D. Hunt, and F. Doǧan, Phys. Rev. B 63, 054525 (2001).
- Yamada et al. (1998) K. Yamada, C. H. Lee, K. Kurahashi, J. Wada, S. Wakimoto, S. Ueki, H. Kimura, Y. Endoh, S. Hosoya, G. Shirane, et al., Phys. Rev. B 57, 6165 (1998).
- Tranquada et al. (2004a) J. M. Tranquada, C. H. Lee, K. Yamada, Y. S. Lee, L. P. Regnault, and H. M. Ronnow, Phys. Rev. B 69, 174507 (2004a).
- (7) N. B. Christensen, D. F. McMorrow, H. M. Rønnow, B. Lake, S. M. Hayden, G. Aeppli, T. G. Perring, M. Mangkorntong, M. Nohara, and H. Takagi, eprint cond-mat/0403439.
- Xaio et al. (1990) G. Xiao, M. Z. Cieplak, J. Q. Xiao, and C. L. Chien, Phys. Rev. B 42, R8752 (1990).
- Mahajan et al. (1994) A. V. Mahajan, H. Alloul, G. Collin, and J. F. Marucco, Phys. Rev. Lett. 72, 3100 (1994).
- Julien et al. (2000) M.-H. Julien, T. Fehér, M. Horvatić, C. Berthier, O. N. Bakharev, P. Ségransan, G. Collin, and J.-F. Marucco, Phys. Rev. Lett. 84, 3422 (2000).
- Pan et al. (2000) S. H. Pan, E. W. Hudson, K. M. Lang, H. Eisaki, S. Uchida, and J. C. Davis, Nature 403, 746 (2000).
- Hudson et al. (2001) E. W. Hudson, K. M. Lang, V. Madhavan, S. H. Pan, H. Eisaki, S. Uchida, and J. C. Davis, Nature 411, 920 (2001).
- Kimura et al. (2003) H. Kimura, M. Kofu, Y. Matsumoto, and K. Hirota, Phys. Rev. Lett. 91, 067002 (2003).
- Kimura (2003) H. Kimura, Physica C 392-396, 34 (2003).
- Nachumi et al. (1996) B. Nachumi, A. Keren, K. Kojima, M. Larkin, G. M. Luke, J. Merrin, O. Tchernyshov, Y. J. Uemura, N. Ichikawa, M. Goto, and S. Uchida, Phys. Rev. Lett. 77, 5421 (1996).
- Gaojie et al. (1997) X. Gaojie, M. Zhiqiang, T. Mingliang, W. Yu, and Z. Yuheng, Journal of Superconductivity 10, 13 (1997).
- Churei et al. (2003) T. Churei, H. Hiraka, Y. Endoh, M. Matsuda, and K. Yamada, Physica C 392-396, 194 (2003).
- Hirota et al. (1998) K. Hirota, K. Yamada, I. Tanaka, and I. Kojima, Physica B 241-243, 817 (1998).
- Hirota (2001) K. Hirota, Physica C 357-360, 61 (2001).
- Adachi et al. (2004a) T. Adachi, S. Yairi, K. Takahashi, Y. Koike, I. Watanabe, and K. Nagamine, Phys. Rev. B 69, 184507 (2004a).
- Adachi et al. (2004b) T. Adachi, S. Yairi, Y. Koike, I. Watanabe, and K. Nagamine, Phys. Rev. B 70, 060504(R) (2004b).
- Terascon et al. (1987) J. M. Tarascon, L. H. Greene, P. Barboux, W. R. McKinnon, G. W. Hull, T. P. Orlando, K. A. Delin, S. Foner, and E. J. McNiff, Phys. Rev. B 36, 8393 (1987).
- Nakano et al. (1998) T. Nakano, N. Momono, T. Nagata, M. Oda, and M. Ido, Phys. Rev. B 58, 5831 (1998).
- Sidis et al. (1996) Y. Sidis, P. Bourges, B. Hennion, L. P. Regnault, R. Villeneuve, G. Collin, and J. F. Marucco, Phys. Rev. B 53, 6811 (1996).
- Hayden et al. (2004) S. M. Hayden, H. A. Mook, P. Dai, T. G. Perring, and F. Doǧan, Nature 429, 531 (2004).
- Tranquada et al. (2004b) J. M. Tranquada, H. Woo, T. G. Perring, H. Goka, G. D. Gu, G. Xu, M. Fujita, and K. Yamada, Nature 429, 534 (2004b).
- Sidis et al. (2000) Y. Sidis, P. Bourges, H. F. Fong, B. Keimer, L. P. Regnault, J. Bossy, A. Ivanov, B. Hennnion, P. Gautier-Picard, G. Collin, et al., Phys. Rev. Lett. 84, 5900 (2000).
- Tokunaga et al. (1997) Y. Tokunaga, K. Ishida, Y. Kitaoka, and K. Asayama, Solid State Commun. 103, 43 (1997).