Excitations of a Superfluid in a 3D Optical Lattice
Abstract
We prepare a Bose-Einstein condensed gas in a three-dimensional optical lattice and study the excitation spectrum of the superfluid phase for different interaction strengths. We probe the response of the system by modulating the depth of the optical lattice along one axis. The interactions can be controlled independently by varying the tunnel coupling along the other two lattice axes. In the weakly interacting regime we observe a small susceptibility of the superfluid to excitations, while for stronger interactions an unexpected resonance appears in the excitation spectrum. In addition we measure the coherent fraction of the atomic gas, which determines the depletion of the condensate.
pacs:
05.30.Jp, 03.75.Kk, 03.75.Lm, 73.43.NqA variety of intriguing macroscopic quantum phenomena have become accessible to experiments with quantum gases by loading them into the periodic potential of an optical lattice. Initial experiments were carried out in the weakly interacting regime which led to the observation of Josephson type oscillations Anderson1998 ; Cataliotti2001 , analogous to those seen in superconductors or superfluids. The strongly interacting regime could be reached in experiments with extremely deep lattice potentials leading to number squeezing Orzel2001 ; Hadzibabic2004 , and with three-dimensional optical lattices leading to the observation of a quantum phase transition from a superfluid to a Mott insulator Greiner2002a ; Stoeferle2004 . In the latter experiments the repulsive interaction energy between two atoms within a minimum of the optical lattice potential is much larger than the kinetic energy associated with the tunnel coupling between adjacent minima Fisher1989 ; Freericks1994 ; Kuehner1998 ; Jaksch1998 .
In this paper we explore the excitation spectrum of a Bose-Einstein condensed gas in an three-dimensional optical lattice where we can continuously tune the experimental regime from weak () to increasingly stronger () interactions. Modulation of the depth of the optical lattice along one axis is used to excite the system while the effect of interactions is controlled by increasing the potential depth along the other two axes.
The strength of the excitation is measured by the fraction of atoms which are exited out of the condensate. The weakly interacting Bose gas shows a very low susceptibility to the modulation. This observation is in agreement with a theoretical prediction derived with stationary Bogoliubov theory Menotti2003 . When we continuously increase we observe a gradual appearance of an unexpected resonance in the excitation spectrum. For each value of we measure the coherent fraction of the atomic gas to determine the depletion of the condensate.
Our experimental setup is described in Ref. Moritz2003 . In brief, we produce almost pure condensates of typically 87Rb atoms in the hyperfine groundstate which is confined by a magnetic trap with trapping frequencies , , and . Three retro-reflected laserbeams (wavelength nm) are focused onto the condensate to form the optical lattice. At the position of the condensate the gaussian shaped beams have -radii of ( and axes) and (). The Thomas-Fermi radius of the magnetically trapped condensate is m and the number of occupied sites along the probe axis can be estimated to be . For the maximal depth of the optical lattice potential the confinement of the atomic cloud is dominated by the gaussian intensity profile of the lattice beams which leads to a nearly isotropic harmonic potential with a trapping frequency of Hz.
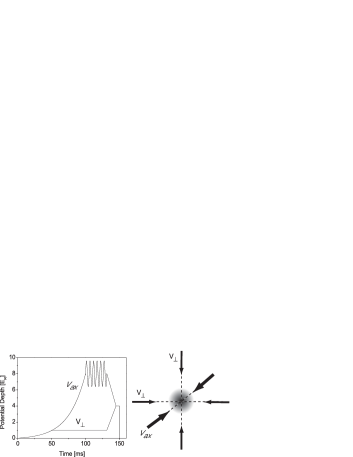
To load the condensate into the ground state of the optical lattice, the intensities of the lasers are slowly increased to their final values using an exponential ramp with a time constant of and a duration of . The resulting optical potential depths and are proportional to the laser intensities and are conveniently expressed in terms of the recoil energy with and the atomic mass . The specific loading sequence is shown in figure 1. The axial potential is ramped to and simultanously the potential along the orthogonal axes is ramped to different values in the interval . The ratio is set by the final value of . Here is the combined tunnel coupling between a single site and all nearest neighbor sites, i.e. where is the tunnel coupling between two adjacent sites along the axis .
After loading the condensate into the optical lattice we modulate the amplitude of the standing wave along the probe axis at a frequency (see figure 1). This modulation adds two sidebands at frequency to the carrier frequency of the standing wave field. Accordingly, two-photon Raman transitions can be induced which transfer energy , in analogy with Bragg spectroscopy on magnetically trapped condensates Stenger1999 . For an extended periodic system the quasi-momentum transfer of the modulation would be zero. Due to the finite size of the sample the transferred quasi-momentum lies in the interval around zero.
Following the excitation we ramp down the lattice potentials linearly in ms to . The system is kept at this lattice depth for ms to allow for re-thermalization thermalization . Then all optical and magnetic potentials are suddenly switched off. The resulting matter wave interference pattern is detected by absorption imaging after of ballistic expansion. The duration and amplitude of the modulation are chosen such that we always observe a finite condensate fraction. We have also verified that all atoms remain in the lowest Bloch band by adiabatically switching off the lattice potentials Greiner2001b after the modulation.
In figure 2 we show absorption images taken after modulating the optical lattice amplitude at a frequency kHz. During the modulation energy is transferred to the atomic gas which results in a broadening of the central momentum peak. We analyze the central momentum peak using a two dimensional bimodal distribution consisting of a gaussian function for the thermal fraction and an inverted parabolic function for the condensate component. We use the thermal fraction obtained from the image analysis as a measure for the excitation strength, with and being the condensate and total number of atoms in the central momentum peak. For the thermal fraction we find a minimum of around 0.2 even when we reduce the amplitude of the modulation to zero. When we adiabatically increase and subsequently reduce the lattice potential we do not observe any significant heating of the condensate. However, during expansion from the optical lattice atom-atom scattering may reduce the condensate fraction. Also, when the condensate fraction is high the optical density of the central momentum peak saturates and we underestimate the number of atoms in the condensate. Finally, when the thermal fraction is small the atomic distribution is no longer accurately fitted by the bimodal distribution.
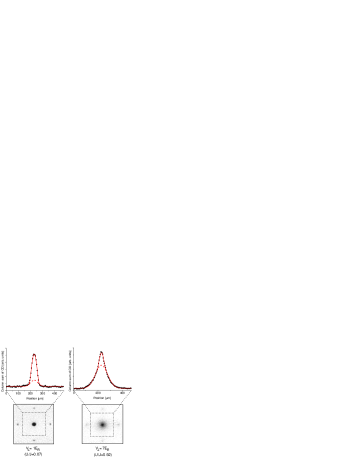
Figure 2 shows that the thermal fraction remains close to its minimum when the modulation is performed in the weakly interacting regime (), i.e. the system is not susceptible to the excitation. In the more strongly interacting regime () the thermal fraction approaches unity. Here the superfluid shows an increased susceptibility to the modulation. We have measured a full series of spectra to characterize the Bose gas in the transition region between weak and increasingly stronger interactions. Each spectrum is recorded by scanning the frequency of the modulation for a fixed value of . These data are displayed in figure 3 where the excitation strength is plotted as a function of the transverse lattice potential and the frequency .
We first discuss our results for the weakly interacting Bose gas (, and ). In this regime the observed excitation strength remains close to the lower detection limit of 0.2 for all excitation energies. This observation can be related to the behaviour of the static structure factor derived from stationary Bogoliubov theory. The structure factor describes the total strength of all possible excitations with momentum transfer . For close to zero the excitation energy to the second Bogoliubov band is above where kHz. Since the highest modulation frequency is kHz we can safely neglect excitations beyond the lowest band. For long wavelength excitations ( close to zero) the structure factor behaves like , where and are the lowest Bloch- and Bogoliubov bands in the optical lattice Menotti2003 . Due to the quadratic (linear) dispersion relation of the Bloch (Bogoliubov) band near zero quasimomenta we expect a strong suppression of the measured excitation strength for all excitation energies which is in reasonable agreement with our experimental observation.
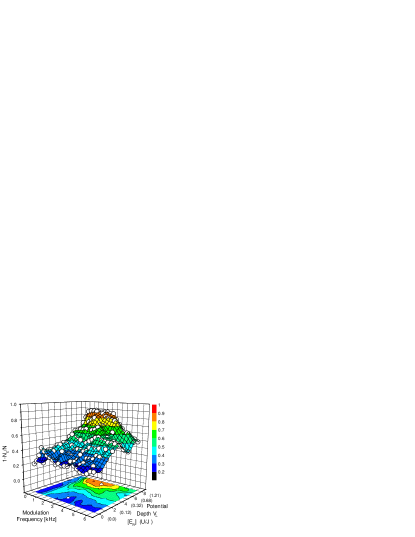
The excitation strength in figure 3 shows the gradual appearance of a resonant feature when we approach the more strongly interacting superfluid phase (, and ). The position of this resonance is well above the frequencies expected for collective oscillations of the superfluid. We can also rule out excitations to the second Bogoliubov band since these appear at a much higher frequency.
For a translationally invariant system the appearance of the resonance would be unexpected for the following reasons. First, the single-phonon excitation energy is limited by the width of the first Bogoliubov band. For our parameters this width is kHz, where is the Bragg momentum of the periodic lattice Kraemer2003 . This is significantly below the observed resonance close to kHz. Secondly, the suppression of the structure factor discussed above for the weakly interacting Bose gas is based on the f-sum rule Pines1966 which is also valid for strongly interacting many-body systems. In liquid helium for example, inelastic scattering of x-rays and slow neutrons has shown that long wavelength excitations are suppressed at low temperature Gordon1958 ; Svennson1980 . However, high energy excitations at low momenta corresponding to multi-phonon states have been observed in liquid helium Greytak1970 . Recently it was also suggested that the quantum depletion of an atomic gas at zero temperature adds a correction to the dynamic structure factor at low momenta and non-vanishing excitation energies Buechler2003 . This result was derived for a three dimensional system by going beyond the lowest order Bogoliubov expansion. It thus points out the important role played by the quantum depletion which can lead to the excitation of two quasi-particles with opposite momenta at a finite excitation energy.
Recently the parametric excitation of Bogoliubov modes was studied by solving the time-dependent Gross-Pitaevskii equation for an elongated Bose-Einstein condensate in an optical lattice Tozzo2004 . In this simulation the modulation at frequency drives the parametric amplification of excitations with momenta which satisfy the resonance condition . Soon after these two modes have been amplified, their mean-field interaction with each other and with the groundstate leads to the population of new modes and a rapid broadening of the momentum distribution. When the resonance condition can no longer be satisfied and the excitation strength decreases. The timescale for the onset of the parametric process decreases with larger population of the Bogoliubov modes. Therefore the excitation efficiency should increase with increasing depletion of the condensate, i.e. for larger .
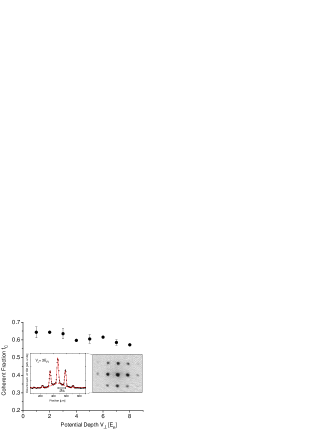
In order to investigate the role played by the depletion of the condensate we have measured the coherence properties of the atomic sample both in the weakly and the more strongly interacting superfluid phase where the resonance appears. We image the matter wave interference pattern to extract the coherent fraction Orzel2001 ; Greiner2002a ; Stoeferle2004 . First we prepare the Bose gas in the lattice as described above but do not apply our excitation scheme. Instead, after holding the atoms at the final lattice depth for , we increase all lattice axes rapidly () to about and then abruptly switch off all optical and magnetic trapping potentials. This procedure always projects the state of the superfluid on the same set of Bloch levels. To extract the number of coherent atoms from the interference pattern, the peaks at , and are fitted by Gaussians (see inset in figure 4). Incoherent atoms give rise to a broad gaussian background. Taking this fit as a measure of the number of incoherent atoms , we calculate the coherent fraction . In figure 4 the coherent fraction is shown for increasing values of . The very slow decrease of shows that the system remains coherent and we do not observe a significant increase in the condensate depletion when preparing the superfluid in the more strongly interacting regime where . Using a Gutzwiller variational calculation we find that, as a result of the quantum depletion, the condensate fraction is reduced to for the maximal depth of the optical lattice Rokhsar1991 .
In conclusion, we have used an optical lattice composed of three orthogonal standing waves to adjust the level of interactions in a Bose-Einstein condensed gas and we have investigated the response of this system to the modulation of the optical lattice amplitude along one axis. In the weakly interacting regime ( ) the observed excitation strength remains close to zero while in the more strongly interacting regime () a broad resonance appears at excitation energies above the width of the first Bogoliubov band in the optical lattice. Finally we have measured the depletion of the condensate which remains almost constant for the same parameters where the resonance appears.
We would like to thank H. P. Büchler, G. Blatter, F. Dalfovo, M. Krämer, L. Pitaevskii, A. Sørensen and C. Tozzo for useful discussions, and SNF and QSIT for funding.
References
- (1) email:Schori@phys.ethz.ch
- (2) B. P. Anderson and M. A. Kasevich, Science 282, 1686 (1998).
- (3) F. S. Cataliotti, S. Burger, C. Fort, P. Maddaloni, F. Minardi, A. Trombettoni, A. Smerzi, and M. Inguscio, Science 293, 843 (2001).
- (4) C. Orzel, A. K. Tuchman, M. L. Fenselau, M. Yasuda, and M. A. Kasevich, Science 291, 2386 (2001).
- (5) Z. Hadzibabic, S. Stock, B. Battelier, V. Bretin, and J. Dalibard, e-print quant-ph/0405113.
- (6) M. Greiner, O. Mandel, T. Esslinger, T. W. Hänsch, and I. Bloch, Nature 415, 39 (2002).
- (7) T. Stöferle, H. Moritz, C. Schori, M. Köhl, and T. Esslinger, Phys. Rev. Lett. 92, 130403 (2004).
- (8) M. P. A. Fischer, P. B. Weichmann, G. Grinstein, and D. S. Fisher, Phys. Rev. B 40, 546 (1989).
- (9) J. K. Freericks and H. Monien, Europhys. Lett. 26, 545 (1994).
- (10) T. D. Kühner and H. Monien, Phys. Rev. B 58, 14741 (1998).
- (11) D. Jaksch, C. Bruder, J. I. Cirac, C. W. Gardiner, and P. Zoller, Phys. Rev. Lett. 81, 3108 (1998).
- (12) C. Menotti, M. Krämer, L. Pitaevskii, and S. Stringari, Phys. Rev. A 67, 053609 (2003).
- (13) H. Moritz, T. Stöferle, M. Köhl, and T. Esslinger, Phys. Rev. Lett. 91, 250402 (2003).
- (14) J. Stenger, S. Inouye, A. P. Chikkatur, D. M. Stamper-Kurn, D. E. Pritchard, and W. Ketterle, Phys. Rev. Lett. 82, 4569 (1999).
- (15) We have experimentally checked that the system is re-thermalized after ms, in accordance with a tunneling time of ms for .
- (16) M. Greiner, I. Bloch, O. Mandel, T. W. Hänsch, and T. Esslinger, Phys. Rev. Lett. 87, 160405 (2001).
- (17) M. Krämer, C. Menotti, L. Pitaevskii, and S. Stringari, Eur. Phys. J. D 27, 247 (2003).
- (18) D. Pines and P. Nozieres, The Theory of Quantum Liquids (Benjamin, New York, 1966), Vol. I.
- (19) W. L. Gordon, C. H. Shaw, and J. G. Daunt, J. Phys. Chem. Solids 5, 117 (1958).
- (20) E. C. Svensson, V. F. Sears, A. D. B. Woods, and P. Martel, Phys. Rev. B 21, 3638 (1980)
- (21) T. J. Greytak, R. Woerner, J. Yan, and R. Benjamin, Phys. Rev. Lett. 25, 1547 (1970).
- (22) H. P. Büchler and G. Blatter, e-print cond-mat/0312526.
- (23) M. Krämer, C. Tozzo, and F. Dalfovo, e-print cond-mat/0410122.
- (24) D. S. Rokhsar, and B. G. Kotliar, Phys. Rev. B 44, 10328 (1991).