Present address: ]RISE, Waseda University, Tokyo 169-8555, Japan; PRESTO, Japan Science and Technology Corporation, Saitama 332-0012, Japan
Charge dynamics of Ca2-xNaxCuO2Cl2 as a correlated electron system with the ideal tetragonal lattice
Abstract
We report the reflectivity and the resistivity measurement of Ca2-xNaxCuO2Cl2 (CNCOC), which has a single-CuO2-plane lattice with no orthorhombic distortion. The doping dependence of the in-plane optical conductivity spectra for CNCOC is qualitatively the same to those of other cuprates, but a slight difference between CNCOC and LSCO, i.e., the absence of the 1.5 eV peak in CNCOC, can be attributed to the smaller charge-stripe instability in CNCOC. The temperature dependence of the optical conductivity spectra of CNCOC has been analyzed both by the two-component model (Drude+Lorentzian) and by the one-component model (extended-Drude analysis). The latter analysis gives a universal trend of the scattering rate with doping. It was also found that shows a saturation behavior at high frequencies, whose origin is the same as that of resistivity saturation at high temperatures.
pacs:
74.25.Gz, 74.25.Fy, 74.72.JtI Introduction
There has been a long history of discussions about the in-plane charge dynamics of cuprate superconductors. It is believed that the in-plane charge dynamics of cuprate superconductors is dominated by a small amount of holes introduced into a CuO2 plane, which is theoretically represented by a tetragonal lattice of Cu2+ ions () with strong on-site coulomb repulsion. However, most of the cuprate superconductors have other characteristics that make the system away from such a simple two dimensional tetragonal lattice. First, there is often a different type of orthorhombic distortion in each system: La2-xSrxCuO4 (LSCO) has a buckling of CuO6 octahedra,Fleming et al. (1987) YBa2Cu3O7 (YBCO) has CuO chains between CuO2 planes, and Bi2Sr2CaCu2O8 (BSCCO) has the anisotropic modulation of BiO layers,Shaw et al. (1988) all of which introduces orthorhombicity into the systems. Second, there is an instability of the stripe formation in the CuO2 plane, which is particularly strong in LSCO.Tranquada et al. (1995) Although it is not established whether such a stripe instability is an intrinsic nature of the tetragonal lattice, it is experimentally shown that the orthorhombic distortion largely affects the stripe formation in LSCO.Wakimoto et al. (1999) This instability also complicates the system and its physics. Finally, YBCO and BSCCO has a bilayer structure of CuO2 planes, and it is known that the inter-bilayer coupling cannot be ignored in such systems.Feng et al. (2001) This difference between single-layer LSCO and bilayer YBCO or BSCCO makes it difficult to compare their charge dynamics in a quantitative way.
Reflectivity measurement is a powerful technique to investigate the charge dynamics of metals and has been used for the study of both the in-plane and the out-of-plane charge dynamics in cuprate superconductors. As an overall feature, the doping dependence and the temperature dependence of the in-plane optical spectra are similar in all systems, YBCO,Cooper et al. (1993) BSCCO,Terasaki et al. (1990) and LSCO.Uchida et al. (1991) Namely, upon doping, the peak around 2 eV in the optical conductivity spectrum, which corresponds to the charge-transfer (CT) excitation between the Cu and the oxygen levels, decreases in its intensity whereas a quasi-Drude peak, which arises from the itinerant motion of the carriers, evolves below 1.0 eV. However, several details are different between the spectra of these systems. It was pointed out that the shape of the quasi-Drude peak below 1.0 eV is slightly different between these three systems: The quasi-Drude spectrum of LSCO has a dip around 0.1 eV and can be separated into a sharp Drude component below 0.1 eV and a Lorentzian above it, whereas that of BSCCO and YBCO is more smooth and does not look like the sum of two components.Tajima et al. (1999) It was also pointed out that there is a peak existing between the CT excitation and the quasi-Drude peak in the LSCO spectra around 1.5 eV,Uchida et al. (1991) which is absent in other two systems. These differences should come from the difference in the crystal structure as described above, but it has yet to be understood how the deviation from a tetragonal lattice affects the in-plane charge dynamics.
Ca2-xNaxCuO2Cl2 (CNCOC) is one of the best systems in that sense to investigate the charge dynamics of the correlated electron system with a purely tetragonal lattice. This compound has a single-CuO2-plane structure with apical chlorine ionsHiroi et al. (1996) instead of apical oxygen ions in LSCO. Since the (Ca,Na)Cl plane separating two CuO2 planes has a more ionic character than the (La,Sr)O plane in LSCO, it is expected that the coupling between two adjacent CuO2 planes is much smaller in CNCOC than in LSCO. In addition, unlike LSCO, there is no buckling distortion of the octahedral network in CNCOC, thus being a simple tetragonal structure.Hiroi et al. (1996) These two characteristics make CNCOC the best system representing the electron correlation in the purely tetragonal lattice. Previously, it was difficult to make single crystals of CNCOC because of the necessity of using high pressure even for making polycrystalline samples. However, recent progress in making single crystals under high pressure has overcome this obstacle,Kohsaka et al. (2002) and now a series of single crystals with various doping level in CNCOC can be grown, which is large enough in size for resistivity and reflectivity measurement. In this paper, we report the resistivity and reflectivity measurement of CNCOC. In particular, we focus on the doping and temperature dependence of the in-plane charge dynamics in the normal phase studied by optical measurement.
II Experimental
Single crystals of CNCOC were grown by a flux method under high pressures. The details of crystal growth have already been published in Ref. Kohsaka et al., 2002. Since the Na doped samples () are highly hygroscopic, a special attention was paid not to expose the sample to the air in the preparation and measurement. The in-plane resistivity was measured by a standard four-probe technique, while the out-of-plane resistivity was measured by a quasi-Montgomery technique. In both cases, evaporated gold was used as the electrodes. The measurements were performed in the vacuum condition with a sample holder that was specially designed not to expose the sample to the air during the preparation and measurement. The reflectivity spectra were measured on the cleaved surface, which was prepared in the argon-filled glove box. We used a Fourier-type interferometer between 70 meV and 1.2 eV and a grating type spectrometer between 0.75 eV and 5 eV. The size of the sample we measured was 1mm 1mm at best, and the optically flat area is much smaller than that. Thus, all the measurements were done under the microscope attached to the spectrometer, with a typical spot size of 80 m 80 m. Because of this size limitation, the measurement in the far-infrared region (below 70meV) cannot be made with our measurement system. For the measurement at room temperature, the sample was placed in a sealed small box filled with argon gas equipped with an optical window. Al mirror was also placed adjacent to the sample as a reference. We measured the reflectivity at low temperatures between 70 meV and 1.2 eV with a conduction-type cryostat in a vacuum condition. To obtain the absolute value of the reflectivity, we used the spectrum at room temperature, which was separately measured as described above, as a reference. We also measured the reflectivity of the undoped sample in the energy range 5 - 34 eV using the synchrotron source at the Institute for Molecular Science (UV-SOR). Optical conductivity spectrum was calculated from the measured reflectivity spectrum using Kramers-Kronig relation. We used Hagen-Rubens extrapolation for eV and the extrapolation above 34 eV. We also made other types of extrapolation for eV and check the difference of optical conductivity spectra, which will be discussed in the following sections.
III Resistivity measurements
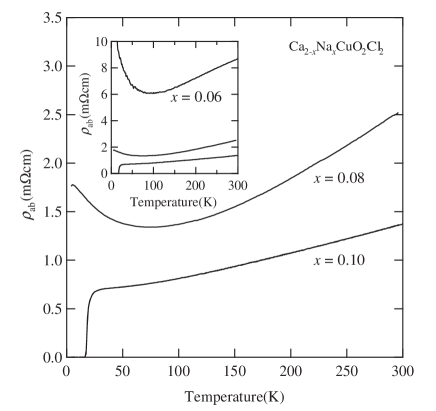
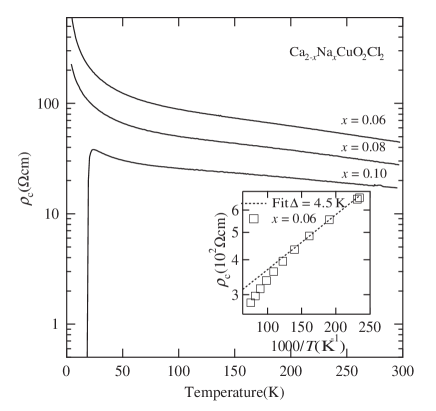
Figure 1 shows the temperature dependence of the in-plane resistivity () for CNCOC (). The absolute value and the temperature dependence of for CNCOC is similar to that of LSCO at the same doping level for and .Komiya et al. (2002) For , however, the absolute value of is much larger than that of the LSCO counterpart. We speculate that the large value of for is caused by the mixing of the out-of-plane component, which often happens in the resistivity measurement of thin samples with large anisotropy. It should be noted that such a mixing barely affects the result of the out-of-plane resistivity. Figure 2 shows the temperature dependence of the out-of-plane resistivity () for CNCOC. The magnitude of at room temperature is about 50 times larger than that of LSCOKomiya et al. (2002) at the same doping level. As a result, the ratio of anisotropy in the resistivity () amounts to in CNCOC. This larger absolute value of can be attributed to the smaller coupling of two adjacent CuO2 planes in CNCOC, which are separated by the Ca(Na)Cl plane with a highly ionic character. By contrast, the temperature dependence of in CNCOC is smaller than that in LSCO. For example, at , the resistivity ratio (50 K) / (290 K) is about 1.8 for CNCOC whereas 2.0 for LSCO.Komiya et al. (2002) This discrepancy between the absolute value and the temperature dependence of can hardly be explained by a conventional semiconductor model. One possible explanation is that the temperature dependence of is dominated by the size of the so-called pseudogap as proposed previously.Takenaka et al. (1994); Yan et al. (1995) The pseudogap has been observed in various experiments, for example, NMR,Waren Jr. et al. (1989) photoemission spectroscopy,White et al. (1996) and even optical measurement.Basov et al. (1996); Puchkov et al. (1996) The size of the pseudogap should scale with the maximum of each system, which is 28 K for CNCOC and 38 K for LSCO in the present case. Therefore, it is expected that the size of the pseudogap in LSCO is larger than that in CNCOC, consistent with the temperature dependence of . As a more quantitative analysis, we estimated the size of the pseudogap from Arrenius plot of . As shown in Fig. 2, the activation energy of , which scales with the size of the pseudogap, is about 4.5 K in CNCOC. For BSSCO, the activation energy of is about 200 K.Watanabe et al. (1997) Such a huge difference of the size of the pseudogap estimated from may explain why of CNCOC is so low compared with BSSCO.
IV The doping dependence of the optical spectra
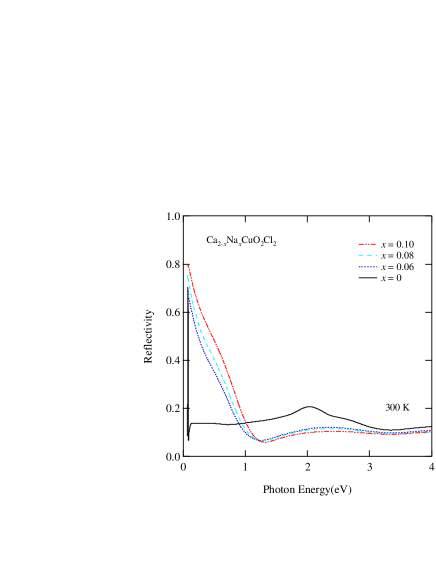
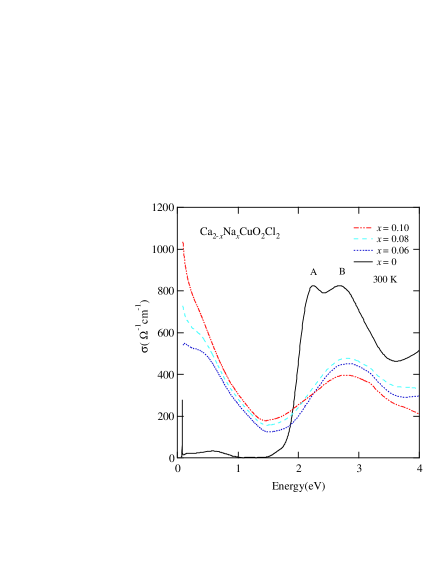
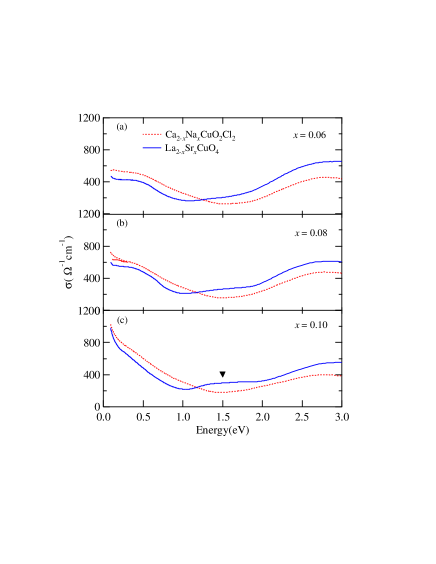
The doping dependence of the reflectivity of CNCOC is shown in Fig. 3. The optical conductivity spectra derived from these reflectivity data are shown in Fig. 4. The overall features of the spectrum and its doping dependence are the same as those of other cuprates: a sharp peak at 2.1 eV is suppressed and the quasi-Drude spectrum below 1.0 eV evolves with increasing . However, there are several differences between CNCOC and LSCO. Figure 5 compares the optical conductivity spectra of CNCOC and LSCOTakenaka et al. (2003) with the same doping level. As can be seen, CNCOC always surpasses LSCO in the spectral weight of the Drude spectrum below 1.5 eV. Another difference is that there is a small peak at 1.5 eV (shown by a triangle) in the LSCO spectra, but such a peak is hardly seen in the CNCOC spectra.
In Fig. 5, the optical conductivity spectrum derived from the reflectivity spectrum with a linear extrapolation below 0.1 eV is also plotted for x = 0.08 (the solid line). As can be seen, there is a small difference between those with a Hagen-Rubens and a linear extrapolations below 0.2 eV. However, this difference is not large enough to qualitatively affect the following discussions.
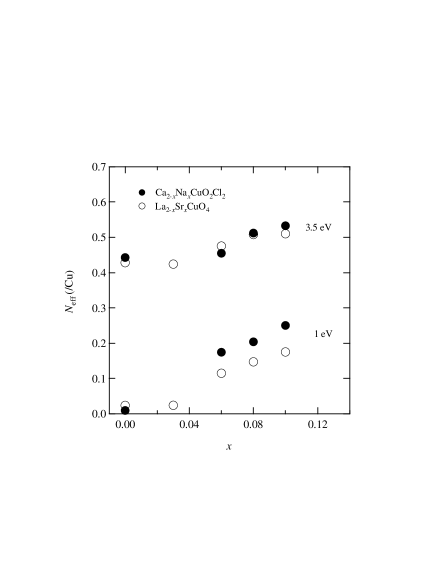
To make more quantitative discussions about the difference and the similarity of the spectra between CNCOC and LSCO, the effective number of electrons, was estimated in the following way,
| (1) |
Figure 6 plots with the cut-off energy eV and 3.5 eV. It is noticeable that with eV is almost the same between CNCOC and LSCO for the same doping level. This indicates that the spectral weight below 3.5 eV is governed by a common component of CNCOC and LSCO, i.e., the CuO2 plane, and La, Sr, Ca, and Na do not largely contribute to the spectrum below 3.5 eV. Thus, it can be concluded that the 1.5 eV peak existing only in the LSCO spectra also comes from the excitation in the CuO2 plane.
Both CNCOC and LSCO have the same structure of the single CuO2 plane, and the only difference in the CuO2 plane between these two systems is the buckling of the CuO6 octahedra and a stripe instability, both of which exist only in LSCO. It should be noted here that the buckling of the CuO6 octahedra disappears for in LSCO,Fleming et al. (1987) where the 1.5 eV peak still survives.Uchida et al. (1991) Therefore, it is plausible to assign the 1.5 eV peak in the optical conductivity of LSCO as the excitation associated with the charge stripe. This assignment can also explain why the 1.5 eV peak does not exist in either YBCOCooper et al. (1993) or BSCCO.Terasaki et al. (1990)
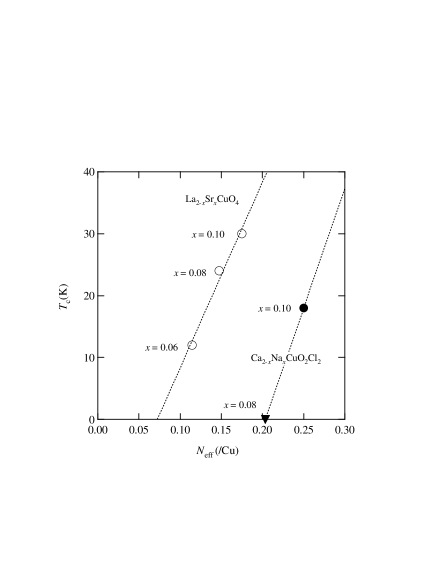
In Fig. 6, it is also found that with eV, which corresponds to the Drude weight of the systems, of CNCOC is larger than that of LSCO. This result is counterintuitive, if one recalls the phase diagram of these two systems; LSCO becomes superconducting for the smaller value of () than CNCOC ().Hiroi et al. (1996) This is more clearly seen in Fig. 7, where and the superconducting transition temperature of each sample are plotted. As can be seen, CNCOC and LSCO follow the different trend, indicating that is by no means the dominant parameter of .
Since these two systems, CNCOC and LSCO, have a similar crystal structure (the single CuO2 plane), the result is rather surprising. One possible explanation is that not all of the Drude spectrum below 1.0 eV contributes to the superconductivity. In other words, the spectral weight that condensates to the superfluid, which dominates the transition temperature, is only a fraction of the spectral weight below 1.0 eV. This interpretation suggests the two-fluid nature of the quasi-Drude spectrum below 1.0 eV, but how the spectrum is divided into two components remains unclear.
V The temperature dependence of the optical spectra
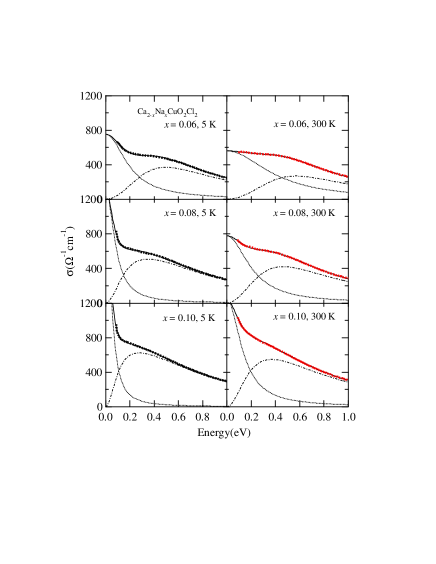
Figure 8 shows the temperature dependence of the optical conductivity spectra for CNCOC with , 0.08, and 0.10 (solid symbols). It is well known that the Drude-like spectrum below 1 eV in the cuprate superconductors cannot be fitted by a single Drude form, and there have been a lot of arguments about whether the one-component model (the so-called extended Drude model) or the two-component model (the Drude and Lorentzian model) is appropriate to explain such a spectrum. Here, we analyze the experimental data of CNCOC in both ways.
First, the spectra were analyzed by the two-component model,Thomas et al. (1988) i.e., the sum of a Drude component and a Lorentzian in the following way;
| (2) |
| (3) |
| (4) |
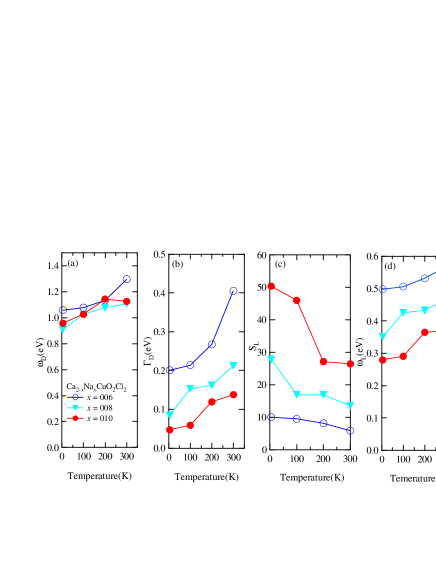
Here, there are five fitting parameters (two for the Drude and three for the Lorentzian), the plasma frequency of the Drude component , the scattering rate of the Drude component , the oscillator strength of the Lorentzian , the peak position of the Lorentzian , and the scattering rate of the Lorentzian . The result of the fitting to each spectrum is quite satisfactory, as shown by the solid lines in Fig. 8. The doping- and the temperature-dependence of the five parameters are summarized in Fig. 9. As can be seen (1) barely changes with doping, but decreases with decreasing temperature (2) decreases with increasing doping and with decreasing temperature (3) increases with increasing doping but does not change with temperature (4) decreases with increasing doping and with decreasing temperature (5) barely changes with doping and temperature.
There are various theoretical studies on the strongly correlated systems with doping.Tohyama and Maekawa (1991); Pruschke et al. (1993); Dagotto et al. (1992) However, the present experimental results have several significant discrepancies with those theoretical studies. First, most of the theories predict the increase of the Drude frequency (or Drude weight) with increasing doping and decreasing temperature, both of which are inconsistent with the present experimental result [Fig. 9(a)]. Second, the localized state, which is represented by a Lorentzian form, usually shifts to a higher energy with decreasing temperature. This behavior is also true for the theoretical studies of the strongly correlated system with infinite dimensions.Pruschke et al. (1993) However, the present experimental result indicates that rather decreases with decreasing temperature [Fig. 9(d)], hard to reconcile with the theories. The similarity between the doping- and the temperature-dependence of [Fig. 9(b)] and [Fig. 9(d)] suggests that the spectrum assigned to a Lorenztian component (a localized state) in this fitting is not really a localized state, but a part of a Drude component (an itinerant state). In other words, the present analysis suggests that the one-component model is more plausible to fit the data of CNCOC than the two-component model.
We also analyze the data by the one-component model, i.e., the extended Drude model.Rotter et al. (1991) In this model, all of the spectrum below 1.0 eV is assigned to an itinerant state, but the effective mass and the scattering rate are both -dependent and are derived by the following expression,
| (5) |
here is the complex optical conductivity. The result of the at various temperatures at each is shown in Fig. 10. There is a strong dependence of in each and temperature. Particularly at low frequency, the scattering rate has a term almost proportional to , in such a way that , which is a common behavior of cuprate superconductors.Rotter et al. (1991) As can be seen in Fig. 10, the -coefficient in at low frequency, , is almost temperature independent, but only the constant term decreases with decreasing temperature. It can also be seen in Fig. 10 that is saturated for eV. We speculate that this behavior is similar to the behavior of resistivity saturation observed in the dc resistivity at high temperatures.Takagi et al. (1992) This issue is discussed in the next section.
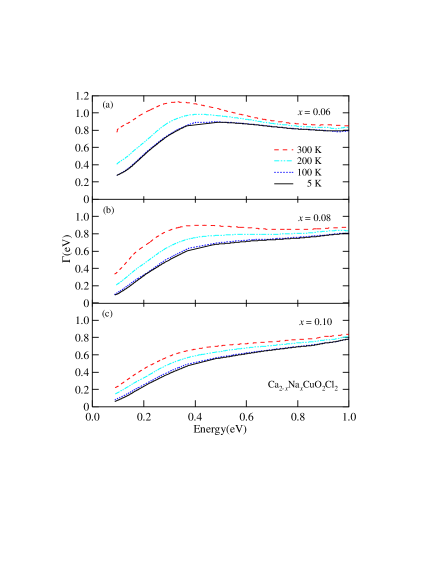
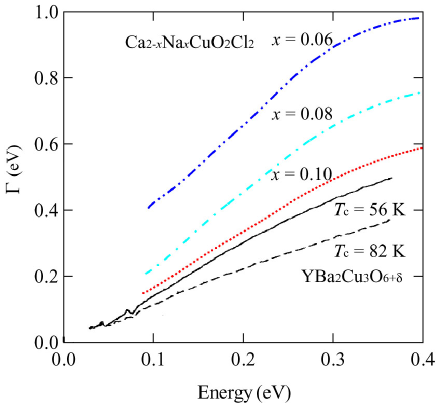
Figure 11 compares the dependence of the scattering rate, , of CNCOC and YBCO.Rotter et al. (1991) As can be seen, of CNCOC with and YBCO with K is almost the same. It should be noted that the ratio of for CNCOC with (18 K) to the maximum of the same series (28 K for ) , which is a good measure of the hole concentration, is 0.6, and this value is almost the same as that of YBCO with K. This indicates that is the same for the samples with the same hole concentration, even though the systems are different. Such a universality of with the change of the hole concentration should be an intrinsic nature of a CuO2 plane with a tetragonal lattice.
VI Discussion
As shown in Fig. 4, there are distinct two peaks (A and B) in the optical conductivity spectrum of the parent compound between 2 and 3 eV, both of which can be assigned to the CT excitation. With hole doping, however, only the A peak disappears but the B peak survives. Such a doping dependence of the double-peak structure of the CT excitation has not been discussed so far, mainly because the double-peak structure in the parent compound itself is not so clear in other cuprate superconductors.
There are several explanations for the double peaks of the CT excitation. One explanation is to ascribe them to the two kinds of holes, those in the Zhang-Rice singlet band (ZRB) and in the non-bonding oxygen band (NBB).Choi et al. (1999) Here, it should be emphasized that both two hole bands can be observed in the ARPES spectrum of the parent compound, and that both bands survive even in the hole-doped samples.Ronning et al. (2003) Therefore, only the splitting of ZRB and NBB cannot explain the fact that the A peak disappears with hole doping in the optical spectrum. We speculate that the excitonic effect between oxygen holes and Cu electrons is essential to the doping dependence of the optical spectrum, which inherently does not exist in the photoemission process.
Next, the -dependence of the scattering rate, , is saturated at large as shown in Fig. 10. It is noticeable that the saturation value of is almost the same for any temperature and , i.e., eV. This behavior is similar with the so-called resistivity saturation, which occurs in the dc resistivity at high temperatures under the condition , where is the Fermi wavenumber and is the mean free path of the carrier. Considering the fact that the scattering rate has both the temperature dependence and the dependence, should show a saturation behavior just as does in the dc resistivity. Here we estimate the saturation value of as follows. Using the relations where is Fermi velocity and is the relaxation time and , we can rewrite the relation as . In the two-dimensional system, is given by ( is the inter-plane distance and is the carrier density), and thus . The unknown parameter, , was estimated from the experimentally obtained effective number of electrons at 1eV. The value thus derived becomes 0.56 eV, 0.66 eV and 0.80 eV for , 0.08 and 0.10, respectively. These are in good agreement with the experimentally estimated values of at the saturation point, indicating that the saturation of the has the same origin as that of .
We also discuss another possible interpretation of the structure in : In the ARPES data of the same compounds, the spectral weight below 0.4 eV is heavily suppressed, particularly around point in the space. This behavior suggests either (a) a pseudogap ( eV) opens on the large Fermi surface around point, or (b) only small hole pockets exist around point. If (a) the pseudogap picture is correct, there should be an excitation between the pseudogap in the optical spectrum, which could appear around , and the “shoulder” around 0.4 eV in can be attributed to the excitation. However, this scenario is rather unlikely, because (1) as shown in Fig. 11, the below 0.4 eV for coincides with that of YBCO with , which does not have such a large pseudogap, and (2) the energy scale of the structure in barely changes, or rather increases, with increasing hole concentration, inconsistent with the behavior of the conventional pseudogap whose energy decreases with hole doping. On the other hand, on the basis of (b) the hole-pocket picture, the possible final state of the optical spectrum is the upper Hubbard band, which is eV above the hole band, and thus, there would be no excitation below 1eV except for a Drude response in the optical spectrum. This is consistent with the interpretation of the optical conductivity spectra with the saturation, as discussed above. This picture implies that the hole doping into Ca2cCuO2Cl2 can be described as a rigid band shift without any large reconstruction of the valence and the conduction band in the underdoped region.
VII Summary
In this paper, we report the resistivity and reflectivity measurement of Ca2-xNaxCuO2Cl2 (CNCOC), which has a purely tetragonal CuO2 plane and thus, is the best system to investigate the charge dynamics of tetragonal lattice with strong electron correlation. It was found that the absolute value of the out-of-plane resistivity of CNCOC is much larger than that of LSCO owing to the ionic character of the (Ca,Na)Cl plane, though its temperature dependence is smaller for CNCOC. This discrepancy suggests that the temperature dependence of the out-of-plane resistivity is dominated by the opening of a pseudogap. It was also found that the doping dependence of the in-plane optical conductivity spectra of CNCOC is similar with those of other cuprate superconductors, but a careful comparison of the spectra between CNCOC and La2-xSrxCuO4 (LSCO) clarifies that (1) there is a small peak around 1.5 eV between the charge-transfer peak(2 eV) and a quasi-Drude peak (below 1 eV) only in LSCO (2) the Drude weight below 1 eV of CNCOC is always larger than that of LSCO at the same doping level, though the superconducting transition temperature is lower for CNCOC. The 1.5 eV peak existing only in LSCO can be attributed to the charge stripe in LSCO. The larger Drude weight and lower transition temperature implies that only a part of the Drude weight below 1 eV contributes to the superconductivity.
The temperature dependence of the optical conductivity spectra of CNCOC has been analyzed both by the two-component model (Drude+Lorentzian) and by the one-component model (extended Drude analysis). Five fitting parameters can be obtained by the two-component model, but the doping and temperature dependence of those parameters are not in good agreement with the theoretical predictions. On the other hand, it was found that the -dependence of derived from the extended Drude analysis shows a universal change with doping for different systems. It was also found that shows a saturation behavior above 0.4 eV, which has the same origin of the resistivity saturation at high temperatures, i.e., cannot be smaller than unity. Finally, the absence of the structure below 1.0 eV in the present optical conductivity spectra, together with the result of the ARPES measurement that the spectral weight around point is suppressed below 0.4 eV, suggests that only small pockets exist around point in the underdoped regime of CNCOC.
Acknowledgements.
The authors would like to thank T. Hanaguri for technical assistance on resistivity measurements and helpful discussions, K. Takenaka for sending us his data of LSCO, and S. Miyasaka and Y. Tokura for their help with the measurement at UV-SOR. This work was partly supported by a Grant-in-Aid for The 21st Century COE Program (Physics of Self-organization Systems) at Waseda University from the Ministry of Education, Sports, Culture, Science and Technology of JapanReferences
- Fleming et al. (1987) R. M. Fleming, B. Batlogg, R. J. Cava, and E. A. Rietman, Phys. Rev. B 35, 7191 (1987).
- Shaw et al. (1988) T. M. Shaw, S. A. Shivashankar, S. J. La Placa, J. J. Cuomo, T. R. McGuire, R. A. Roy, K. H. Kellerher, and D. S. Yee, Phys. Rev. B 37, 9856 (1988).
- Tranquada et al. (1995) J. M. Tranquada, B. J. Sternlieb, J. D. Axe, Y. Nakamura, and S. Uchida, Nature 375, 561 (1995).
- Wakimoto et al. (1999) S. Wakimoto, G. Shirane, Y. Endoh, K. Hirota, S. Ueki, K. Yamada, R. J. Birgeneau, M. A. Kastner, and Y. S. Lee, Phys. Rev. B 60, R769 (1999).
- Feng et al. (2001) D. L. Feng, N. P. Armitage, D. H. Lu, A. Damascelli, J. P. Hu, P. Bogodanov, A. Lanzara, F. Ronnig, K. M. Shen, H. Eisaki, et al., Phys. Rev. Lett. 86, 5550 (2001).
- Cooper et al. (1993) S. L. Cooper, D. Reznik, A. Kotz, M. A. Karlow, R. Liu, M. V. Klein, W. C. Lee, J. Giapintzakis, and D. M. Ginzberg, Phys. Rev. B 47, 8233 (1993).
- Terasaki et al. (1990) I. Terasaki, T. Nakahashi, S. Takabayashi, and K. Uchinokura, Physica C 165, 152 (1990).
- Uchida et al. (1991) S. Uchida, T. Ido, H. Takagi, T. Arima, Y. Tokura, and S. Tajima, Phys. Rev. B 43, 7942 (1991).
- Tajima et al. (1999) S. Tajima, N. L. Wang, N. Ichihara, H. Eisaki, S. Uchida, H. Kitano, T. Hanaguri, and A. Maeda, Europhys. Lett. 47, 715 (1999).
- Hiroi et al. (1996) Z. Hiroi, N. Kobayashi, and M. Takano, Physica C 266, 191 (1996).
- Kohsaka et al. (2002) Y. Kohsaka, M. Azuma, I. Yamada, T. Sasagawa, T. Hanaguri, M. Takano, and H. Takagi, J. Am. Chem. Soc. 124, 12275 (2002).
- Komiya et al. (2002) S. Komiya, Y. Ando, X. F. Sun, and A. N. Lavrov, Phys. Rev. B 65, 214535 (2002).
- Takenaka et al. (1994) K. Takenaka, K. Mizuhashi, H. Takagi, and S. Uchida, Phys. Rev. B 50, 6534 (1994).
- Yan et al. (1995) Y. F. Yan, P. Matl, J. M. Harris, and N. P. Ong, Phys. Rev. B 52, R751 (1995).
- Waren Jr. et al. (1989) W. W. Waren Jr., R. E. Walstedt, G. F. Brennert, R. J. Cava, R. Tycko, R. F. Bell, and G. Dabbagh, Phys. Rev. Lett 62, 1193 (1989).
- White et al. (1996) P. J. White, Z. X. Shen, C. Kim, J. M. Harris, A. G. Loeser, P. Fournier, and A. Kapitulnik, Phys. Rev. B 54, R15669 (1996).
- Basov et al. (1996) D. N. Basov, R. Liang, B. Dabrowski, D. A. Bonn, W. N. Hardy, and T. Timsuk, Phys. Rev. Lett. 77, 4090 (1996).
- Puchkov et al. (1996) A. V. Puchkov, P. Foumier, D. N. Basov, T. Timusk, A. Kapitulnik, and N. N. Kolesnikov, Phys. Rev. Lett. 77, 3212 (1996).
- Watanabe et al. (1997) T. Watanabe, T. Fuji, and A. Matsuda, Phys. Rev. Lett. 79, 2113 (1997).
- Takenaka et al. (2003) K. Takenaka, J. Nohara, R. Shiozaki, and S. Sugai, Rhys. Rev. B 68, 134501 (2003).
- Thomas et al. (1988) G. A. Thomas, J. Orenstein, D. H. Rapline, M. Capizzi, A. J. Millis, R. N. Bhatt, L. F. Schneemeyer, and J. V. Waszcazk, Phys. Rev. Lett. 61, 1313 (1988).
- Tohyama and Maekawa (1991) T. Tohyama and S. Maekawa, J. Phys. Soc. Jpn. 60, 53 (1991).
- Pruschke et al. (1993) T. Pruschke, D. L. Cox, and M. Jarrell, Phys. Rev. B 47, 3553 (1993).
- Dagotto et al. (1992) E. Dagotto, A. Moreo, F. Ortolani, D. Poilbalanc, and J. Riera, Phys. Rev. B 45, 10741 (1992).
- Rotter et al. (1991) L. D. Rotter, Z. Schlesinger, R. T. Collins, F. Holtzberg, and C. Field, Phys. Rev. Lett. 67, 2741 (1991).
- Takagi et al. (1992) H. Takagi, B. Batlogg, H. L. Kao, R. J. Cava, J. J. Krajewski, and W. F. Peck, Jr., Phys. Rev. Lett. 69, 2975 (1992).
- Choi et al. (1999) H. S. Choi, Y. S. Lee, T. W. Noh, E. J. Choi, Y. Bang, and Y. J. Kim, Phys. Rev. B 60, 4646 (1999).
- Ronning et al. (2003) F. Ronning, T. Sasagawa, Y. Kohsaka, K. M. Shen, A. Damascelli, C. Kim, T. Yoshida, N. P. Armitage, D. H. Lu, D. L. Feng, et al., Phys. Rev. B 67, 165101 (2003).