Epidemic spread in weighted scale-free networks
Abstract
In this letter, we investigate the detailed epidemic spreading process in scale-free networks with links’ weights that denote familiarity between two individuals and find that spreading velocity reaches a peak quickly then decays in a power-law form. Numerical study exhibits that the nodes with larger strength is preferential to be infected, but the hierarchical dynamics are not clearly found, which is different from the well-known result in unweighed network case. In addition, also by numerical study, we demonstrate that larger dispersion of weight of networks results in slower spreading, which indicates that epidemic spreads more quickly on unweighted scale-free networks than on weighted scale-free networks with the same condition.
pacs:
89.75.-k, 89.75.Hc, 87.23.Ge, 05.70.LnMany social, biological, and communication systems can be properly described as complex networks with vertices representing individuals or organizations and links mimicking the interactions among them. Recently, the ubiquity of a power-law degree distribution in real-life networks has attracted a lot of attentionReviews . Examples of such networks (scale-free networks or SF networks for short) are numerous: these include the Internet, the World Wide Web, social networks of acquaintance or other relations between individuals, metabolic networks, integer networks, food webs, etc.Networks . The ultimate goal of the study on topological structure of networks is to understand and explain the workings of systems built upon those networks, for instance, to understand how the topology of the World Wide Web affects Web surfing and search engines, how the structure of social networks affects the spread of diseases, information, rumors or other things, how the structure of a food web affects population dynamics, and so on.
Recent studies on epidemic spreading in SF networks indicate a particular relevance in the case of networks characterized by complex topologies and very heterogeneous structuresReviews ; Stanley 01 that in many cases present us with new epidemic propagation scenariosEp ; B.B.P.V 04 , such as absence of any epidemic thresholdEp , hierarchical spread of epidemic outbreaksB.B.P.V 04 , and so on. The new scenarios are of practical interest in computer virus diffusion and the spreading of diseases in heterogeneous populations. Further more, they also raise new questions on how to protect the networks and find optimal strategies for the deployment of immunization resourcesImm . However, so far, studies of epidemic spread just focus on unweighted SF networks, and a detailed inspection of epidemic spreading process in weighted SF networks is still missing while real networks, such as population and Internet, are obviously scale-free and with links’ weights that denote familiarity between two individuals(like people or computers), respectively. One can easily take cognizance of how the links’ weights affect the epidemic spreading process. For instance, if your little son gets flu, then you will be infected in all probability, since you two contact each other very frequently(i. e. of large familiarity). By contraries, it is unlikely that you will be infected by your unfamiliar colleague just because of saying hello to him this morning.
In this letter, we intend to provide a first analysis of the time evolution of epidemic spreading in weighted SF networks. The weighted SF network model used in this letter is one of the most well-known model introduced by Barrat, Barthelemy, and Vespignani (BBV networks)B.B.V 04 , whose degree, strength and weight distributions are power-law distributions with heavy tails. The BBV model suggests that two main ingredients of self-organization of a network in a weighted scale-free structure are strength preferential attachment and weights’ dynamics. These point to the facts that most networks continuously grow by the addition of new vertices, new vertices are preferentially attached to existing vertices with larger strength, and the creation of new links will introduce variations of the existing weight distribution. More precisely, the weight of each new edge is fixed to value ; if a new vertex linked to an existing vertex , then the local rearrangement of weights between and its neighbors according to the simple rule
| (1) |
where
| (2) |
is the strength of node , expressed by . This rule considers that the establishment of a new edge of weight with the vertex induces a total increase of traffic that is proportionally distributed among the edges departing from the vertex according to their weights. Since BBV networks are of the same properties (e.g. power-law distribution of degree, strength and weight) as many social networks (e.g. friendship networks and scientists collaboration networks) and technical networks (e.g. Internet and WWW), it is reasonable to investigate epidemic spreading on BBV networks.
In order to study the dynamical evolution of epidemic spreading we shall focus on the susceptible-infected (SI) model in which individuals can be in two discrete states, either susceptible or infectedAderson 92 . Each individual is represented by a vertex of the network and the links are the connections between individuals along which the infection may spread. The total population(the size of the network) is assumed to be constant thus if and are the number of susceptible and infected individuals at time , respectively, then . In weighted networks, we define the infection transmission by the spreading rate,
| (3) |
at which susceptible individual acquire the infection from the infected neighbor , where is a positive constant and is the largest value of in the network. Obviously, more familiar two individuals(i.e. with larger weight) may infect each other with greater probability. According to Eq.(3), one can quickly obtain the probability that an susceptible individual will be infected at the present time step is:
| (4) |
where is the set of all ’s infected neighbors at time .
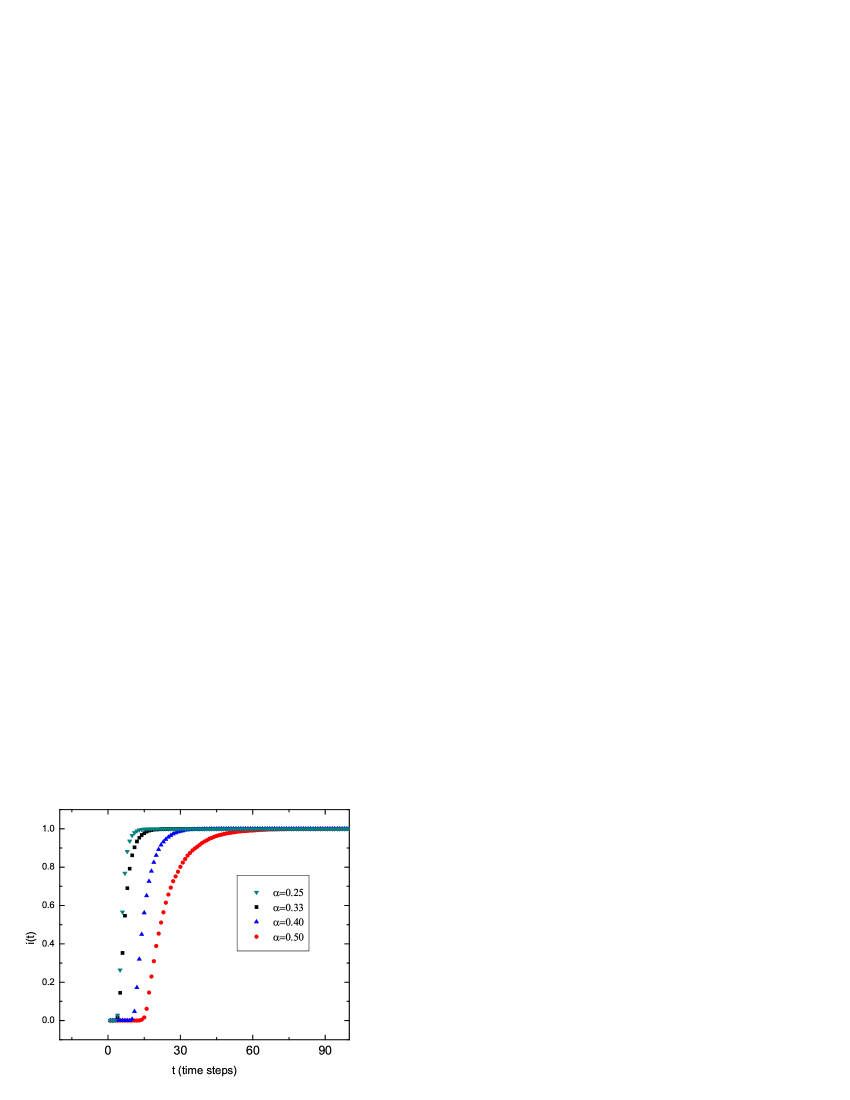
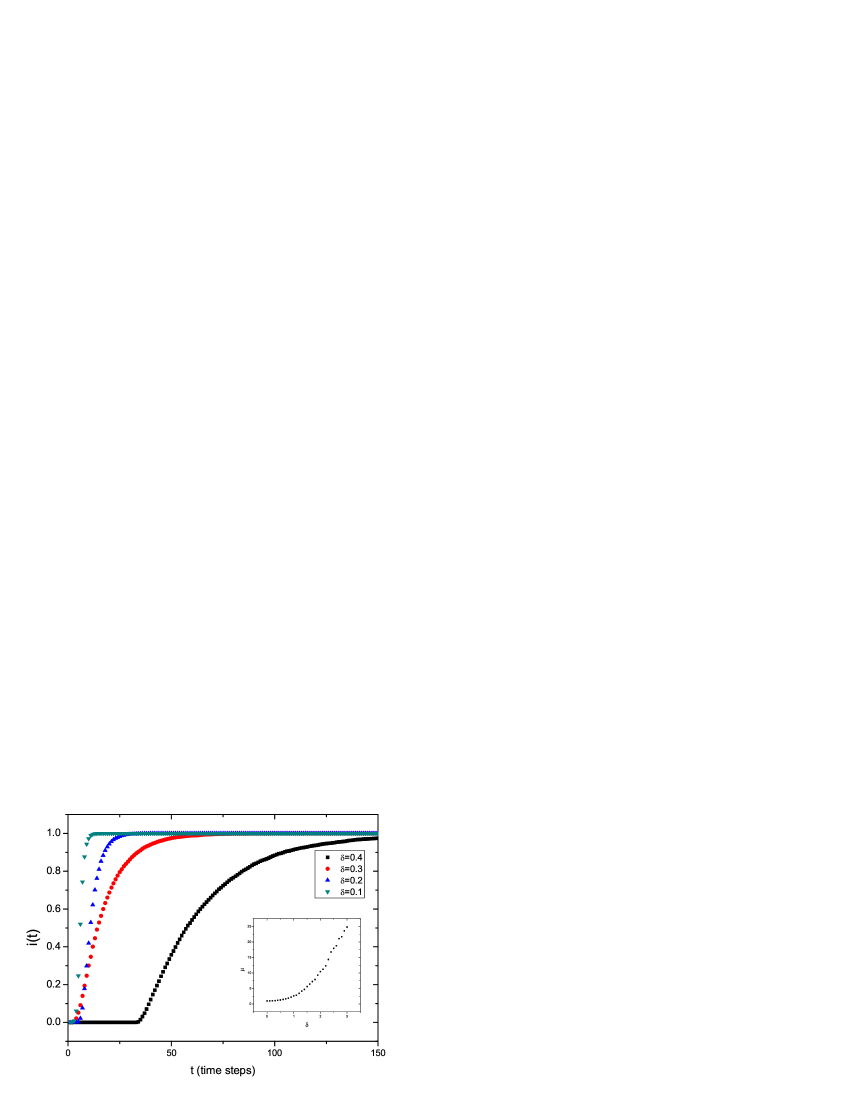
We start by selecting one vertex randomly and assume it is infected. The diseases or computer virus will spread in the networks in according with the rule of Eq.(3). In Fig.1, we plot the density of infected individuals versus time in a BBV network with and . Since , the smaller is, the more quickly infection spreads. It is natural that larger value of induces larger dispersion of weight of networks. Then, a direct question is that how the value of impacts epidemic spreading behavior. In Fig.2, we show that epidemic spreads more quickly while is smaller. In other words, larger dispersion of weight of networks results in slower spreading. That means epidemic spreads more quickly on unweighted scale-free networks than on weighted scale-free networks with the same condition.
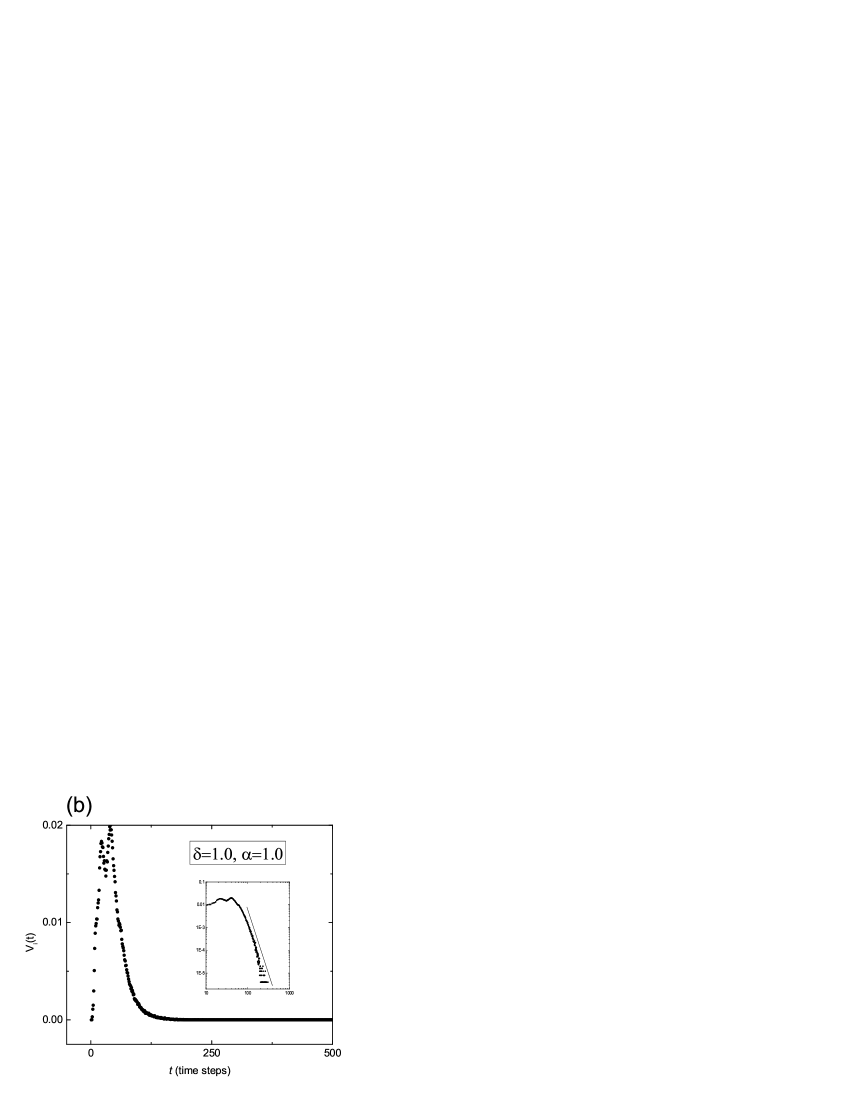
Obviously, all the individuals will be infected in the limit of long time as . For the sake of finding optimal strategies to protect individuals from being infected, we will study the details of spreading velocity at the outbreak moment. The spreading velocity is defined as:
| (5) |
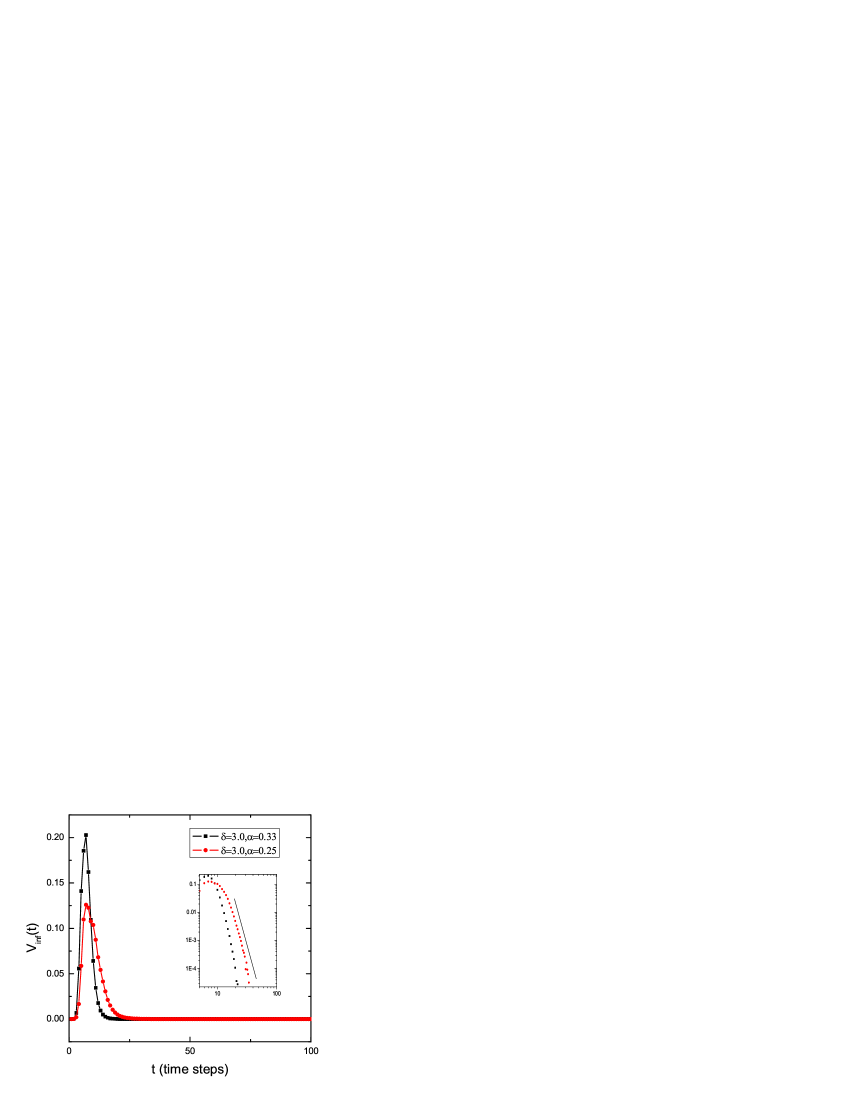
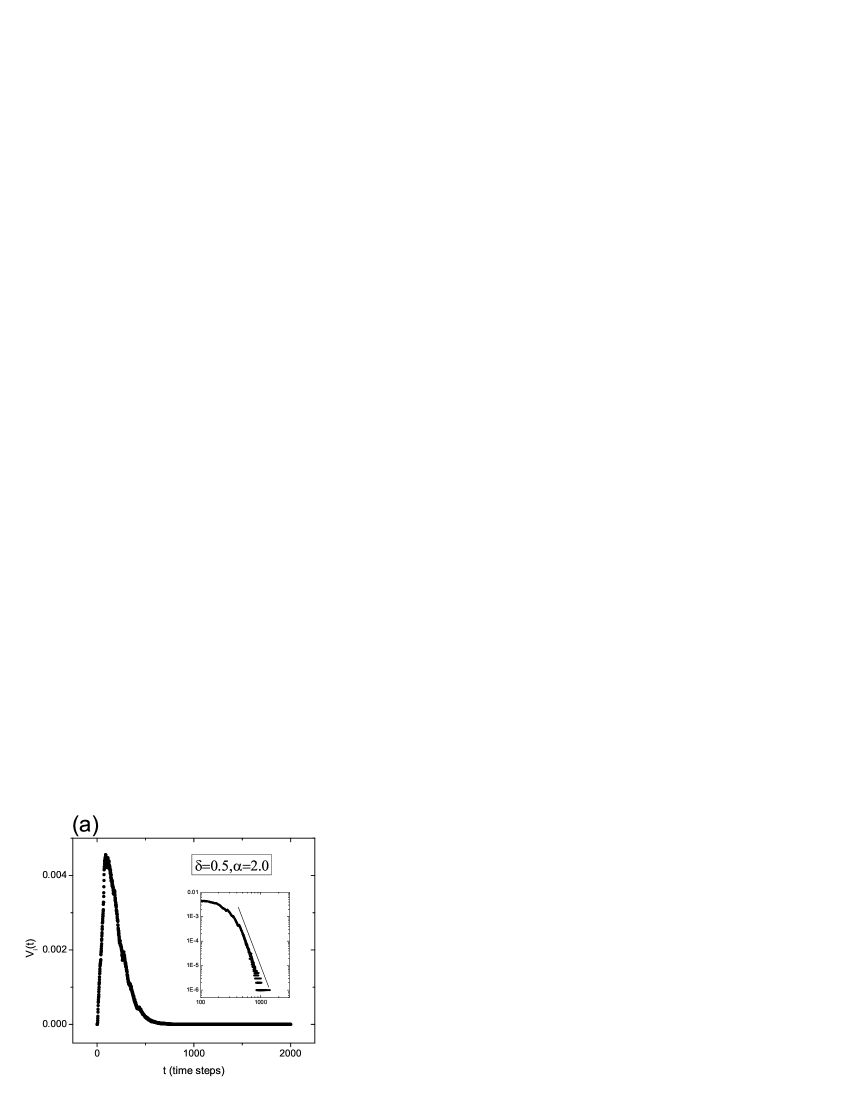
where . We account the number of newly infected vertices at each time step and report the spreading velocity in Fig.3. Apparently, the spreading velocity goes up to a peak quickly that similar to the unweighted network casesB.B.P.V 04 , leaving us very short response time to develop control measures. Moreover, what’s new and interesting, velocity decays following power-law form after the “peak time”. At the moment of infection outbreaks, the number of infected individuals is very small, as well as after a very long time from the outbreak, the number of susceptible individuals is very small. Thus when is very small(close to zero) or very large, the spreading velocity is close to zero, one can see the corresponding simulation result in Fig.3. One may think that the velocity follows power-law behavior just because of the extreme case of . Now we consider the case of and . Fig.4 shows spreading velocity at each time in a BBV network with and , when and , respectively. It is obvious that epidemic spreading behavior dose not show sensitive dependence on the parameter , the reason of that fact will be explored deeply in our future publications.
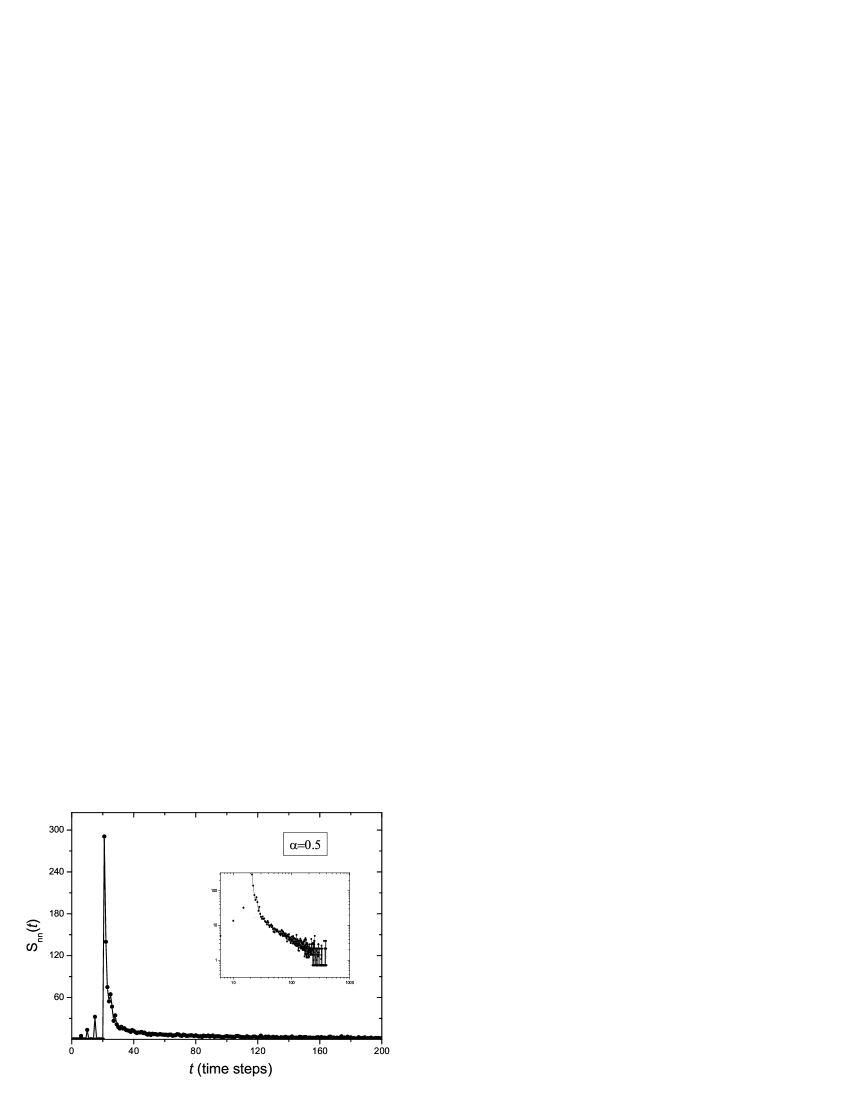
In order to give a more precise characterization of the epidemic diffusion through the weighted networks, we measure the average strength of newly infected vertices at time , define as:
| (6) |
where is the number of infected vertices with strength . Fig. 4 shows the average strength of newly infected vertices as a function of time , and the curves exhibit that displays a power-law behavior for large , , which is remarkably different from the clear hierarchical feature on unweighted networksB.B.P.V 04 .
It is explicit that the individuals with larger strength are much more dangerous when they are infected, rather than the ones with smaller strength, thus if one want to protect most individuals being infected, the susceptible individuals with larger strength must be protect foremost. In Fig. 5, one can find that the individuals with larger strength is preferential to be infected, which means there is little time leaving us to find the “Large Individuals” and isolate them. Therefore, at the outbreak moment of disease or computer virus, the dense crowd or pivotal servers must be protected primarily. Of course, the outcome is not a good news for practical operators, but it may be relevant for the development of containment strategies.
In summary, we have studied epidemic spreading process in BBV networks, and the present results provide a clear picture of the infection propagation in weighted SF networks. The numerical studies show that spreading velocity and average strength of newly infected vertices present power-law time behavior for large , which is remarkably different from infection propagation in unweighted networks. Also by numerical study, we demonstrate that larger dispersion of weight of networks results in slower spreading, which indicates that epidemic spreads more quickly on unweighted scale-free networks than on weighted scale-free networks with the same condition. These results indicate that not only the topological structures of networks but also the links’ weights affect the epidemic spreading process. Further more, the detailed study of behavior of average strength of the newly infected vertices may be relevant for the development of containment strategies.
However, up to now, there are so many important and fundamental problems that puzzle us and haven’t been referred to in the present letter. Some of them have been partially solved and will be publicized in further publication, and others are still unanswered. At the end of this letter, we will list part of them. How to analyze the average density of infected individuals versus time at the outbreak moment in weighted SF networks, and how about the dynamic behavior after “peak time”? Is the mean-field theory appropriate to solve this problem? How to design a optimal containment strategy, and how about the effective for various strategies, such as to protect vertices at random, to protect vertices purposefully, to cut off links at random, to cut off links purposefully, and so on?
This work has been partially supported by the State Key Development Programme of Basic Research (973 Project) of China, the National Natural Science Foundation of China under Grant No.70271070, 70471033 and 10472116, the Specialized Research Fund for the Doctoral Program of Higher Education (SRFDP No.20020358009), and the foundation for graduate students of University of Science and Technology of China under Grant No. USTC-SS-0501.
References
-
(1)
Albert R and Barabási A L 2002 Rev. Mod. Phys. 74
47
Dorogovtsev S N and Mendes J F F 2002 Adv. Phys. 51 1079
Newman M E J 2003 SIAM Review 45 167 -
(2)
Vazquez A, Pastor-Satorras R and Vespignani A 2003 Preprint cond-mat/0303516
Albert R, Jeong H and Barabási A L 1999 Nature 401 130
Jeong H, Tombor B, Albert R, Oltvai Z N and Barabási A L 2000 Nature 407 651
Zhou T, Wang B H, Jiang P Q, Xie Y B and Bu S L 2004 Preprint cond-mat/0405258
Chi L P, Wang R, Su H, Xu X P, Zhao J S, Li W and Cai X 2003 Chin. Phys. Lett. 20 1393
He Y, Zhu X and He D R 2004 Int. J. Mod. Phys. B 18 2595
Xu T, Chen J, He Y and He D R 2004 Int. J. Mod. Phys. B 18 2599
Fan Y, Li M, Chen J, Gao L, Di Z and Wu J 2004 Int. J. Mod. Phys. B 18 2505 -
(3)
Liljeros F, Edling C R, Amaral L A N,
Stanley H E, and Aberg Y 2001 Nature 411 907
Lloyd A L and May R M 2001 Science 292 1316 -
(4)
Moore C and Newman M E J 2000 Phys. Rev. E
61 5678
Abramson G and Kuperman M 2001 Phys. Rev. Lett. 86 2909
Pastor-Satorras R and Vespignani A 2001 Phys. Rev. Lett. 86 3200
Pastor-Satorras R and Vespignani A 2001 Phys. Rev. E 63 066117
May R M and Lloyd A L 2001 Phys. Rev. E 64 066112
Moreno Y, Pastor-Satorras R and Vespignani A 2002 Eur.Phys.J.B. 26 521
Newman M E J 2002 Phys. Rev. E 64 016128 - (5) Barthelemy M, Barrat A, Pastor-Satorras R, Vespignani A 2004 Phys. Rev. Lett. 92 178701
-
(6)
Pastor-Satorras R and Vespignani A 2002 phys. Rev. E
63 036104
Cohen R, Havlin S and Ben-Avraham D 2003 Phys. Rev. Lett. 91 247901 - (7) Barrat A, Barthelemy M and Vespignani A 2004 Phys. Rev. Lett 92 228701
-
(8)
Anderson R M and May R M 1992 Infectious disease in
humans (Oxford: Oxford University Press)
Murray J D 1993 Mathematical Biology(New York: Springer)