Stock Price Clustering and Discreteness: The “Compass Rose” and Predictability
Abstract
In this letter we investigate the information provided by the “compass rose” (Crack, T.F. and Ledoit, O. (1996), Journal of Finance, 51(2), pg. 751-762) patterns revealed in phase portraits of daily stock returns. It has been initially suggested that the compass rose is just a manifestation of price clustering and discreteness and the tick size, factors that can affect the unbiasedness of an array of statistical tests based on stock returns. We show that this may not entirely be the case.
keywords:
Price Clustering and Discreteness , Microstructure , Compass rose , Nonlinear and Complex Dynamics , Surrogate Data Analysis.(JEL G10; G12; G22; Z00).
PACS:
02.50.-r , 02.50.Tt , 05.45.Tp , 05.45.Ac .url]http://www.vorlow.org
1 Introduction
Price clustering and discreteness is considered an important chapter of the “market microstructure” literature with serious implications for tests of market efficiency, risk evaluation techniques and optimal design of securities procedures. The “compass rose”, introduced dy Crack and Ledoit (1996), is simply the manifestation of price clustering and discreteness in two or three dimensional phase portraits. More precisely, a pattern is usually revealed in scatter diagrams of daily percentage returns against their lagged values: rays emanating from the center of the portrait (the origin of the Cartesian axis system), generating a compass rose like formation of clusters of points. Crack and Ledoit (1996) identify three conditions necessary for the appearance of the compass rose pattern:
-
1.
The daily price changes of the stock should be small relative to the price level;
-
2.
daily price changes should also be effected in discrete jumps of a small number of ticks and
-
3.
the price of the stock should vary over a relatively wide range.
If any of the above points is violated, compass rose patters will be very weak or fail to realize altogether.
Several papers have recently appeared on the compass rose theme. Some mainly confirm the compass rose as a result of the tick size, price clustering and discreteness and investigate or relax the above conditions under which it appears (see Szpiro, 1998, Wang et al., 2000, Chen, 1997, Lee et al., 1999, Gleason et al., 2000, Wang and Wang, 2002 and McKenzie and Frino, 2003) . Others (see Fang, 2002, Kramer and Runde, 1997, Koppl and Nardone, 2001 and Amilon, 2003) also concentrate on how the above factors affect the validity of statistical tests based on stock return sequences that reveal this “nanostructure” (Szpiro, 1998). The compass rose should have appeared in several other works (such as Enright, 1992, Chen, 1993, Papaioannou and Karytinos, 1995, Brealy and Meyers, 1996, Franses, 1998, Franses and Dijk, 2000 and Andreou et al., 2000). However this was not achieved due to an unfortunate choice of graphical representation style or resolution and of the length (history) of the sequences examined.
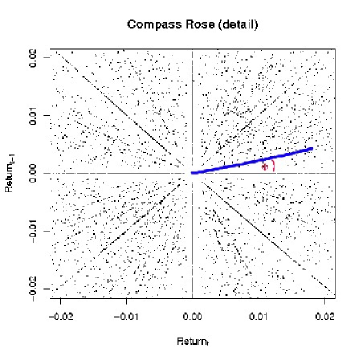
Crack and Ledoit (1996) suggested originally that the compass rose may not offer any help in predicting returns series. This is due to an apparent absence of any strong temporal continuity pattern in the phase portraits (see Fig. 1a). In this letter we show that from a small manipulation of the information that appears in the compass roses, we can gain additional information on the dynamics of stock returns processes in a very costless algorithmically way. An initial analysis of this information suggests the presence of strong nonlinear and possibly deterministic dynamics.
2 A different view of the compass rose
Price clustering and discreteness, as manifested in the compass rose, appears in the form of rays that emanate from the center of the phase portraits (see Fig. 1(a) were we have a detail of the compass rose for the returns of the TESCO stock, chosen randomly from stocks forming to the FTSE100 index). It has been suggested that there is no predictability in such phase portraits (Crack and Ledoit, 1996). This is due to temporal structure and information being concealed in the pase portraits of return sequences. One could initially adopt the view that the distribution of the points in the compass rose in Fig. 1 could have been generated by a suitably discretized random Gaussian process. However (Antoniou and Vorlow, 2004b) showed that there may be a more delicate temporal pattern hidden under noise in the compass rose.
[ Insert Fig. 1 about here. ]
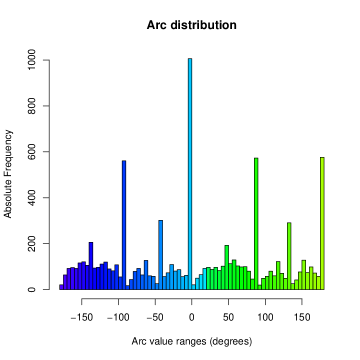
In this letter we follow the approach of Koppl and Nardone (2001) and instead of examining directly the distribution of points in the phase portraits, we choose to model the value of the arcs formed by the line joining the point with the origin (0,0) and the horizontal axis (Fig. 1a). We measure this in degrees for simplicity. An advantage of such “recoding” of the compass rose information is that all prices will range between 0 and 2 or 0 and 360 degrees. It will also allow us to observe more efficiently the clustering and obtain a non-subjective view of the compass rose pattern (refer to Crack and Ledoit, 1996 and Koppl and Nardone, 2001 for discussions). Indeed, the investigation of the distribution of the compass rose arc values for TESCO (Fig. 1b), shows that there is concentration of points across the horizontal and vertical axis (0, 90, 180 and 270 (-90) degrees) and the diagonal rays (close to 45, 45+90, 45+180 and -45 degrees i.e., the NE-SW and NW-SE directions of the compass rose). This is referred to as X-skewness in Koppl and Nardone (2001) and attributed to the presence of big-players and herding (see Koppl and Yeager, 1996 and Broussard and Koppl, 1996). They also suggested that X-skewing may be inconsistent with ARCH effects and demonstrate this with simulations.111The multimodality of the distribution in the histogram of Fig. 1(b) may also be an indication of more complex dynamics. See in (Kantz and Schreiber, 1997) and (Kaplan and Glass, 1995) for discussions. Mandelbrot (1999b, a) also revealed a similar result through a different approach. Judging from the above literature, it seems that several differently fabricated nonlinear and non-random sequences can pass as (G)ARCH processes. There is also the case that stock returns may be characterized by more complex dynamics, not excluding deterministic or chaotic structures (refer to Kyrtsou and Terraza, 2002, 2003 and Antoniou and Vorlow, 2000, 2004b, 2004a for more details).
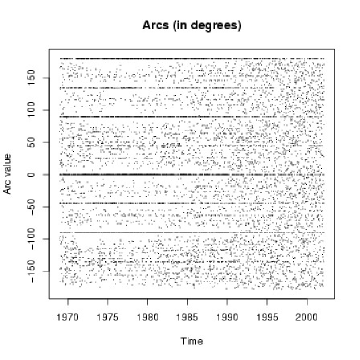
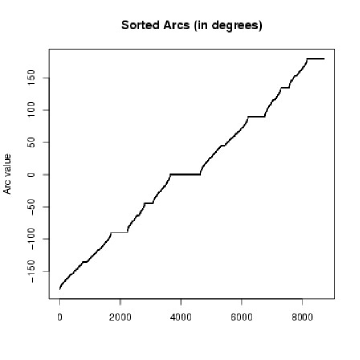
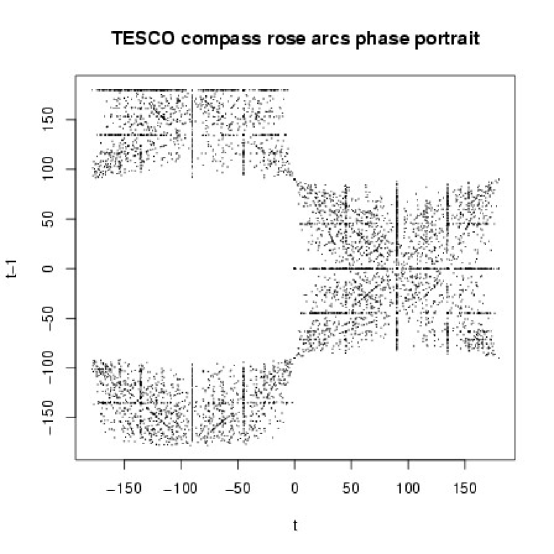
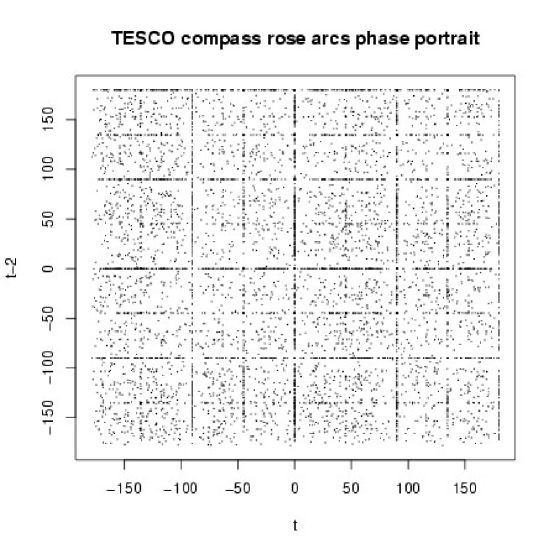
If we plot the arc values as a time series we also obtain a pattern that confirms this clustering of points (see Fig. 1c). Plotting a sorted version of the sequence in Fig. 1(c), provides us with the pattern observed in 1(d), where the plateaus indicate more clearly where the clustering occurs. The intensity of the compass rose patterns may differ between stocks, however the clustering along the main directions as discussed above, usually prevails. Searching for some type of temporal dependency, we looked into the phase portraits of the arcs. In Fig. 2(a) we have the first lag phase portrait and in Fig. 2(b) the second lag one. We can see very curious patterns arising in both diagrams. There are grids (Fig. 2b) and rays (Fig. 2a) which correspond to the main rays of the compass rose as seen in Fig. 1(c) and (d). These patterns need more analysis.
[ Insert Fig. 2 about here. ]
In order to provide evidence of some kind of dependency in the above patterns we calculated the BDS test (see Brock et al., 1987 and Brock and Baek, 1991) for the TESCO sequence of arc values . In table 1 we see clearly that for a range of dimensions (2 to 10), the BDS test reports non IID dynamics for neighborhood area ranges between 0.5 and 1.5 times the standard deviation of arcs. When the size becomes twice the standard deviation (which is regarded as a large radius), we can accept independence only up to dimension 3. This is an initial indication that the dynamics as observed from the sequence of arcs, may contain some dependency that could be used for forecasting purposes.
[ Insert table 1 about here. ]
To back up this result, we calculated the BDS test within a Surrogate Data Analysis framework (SDA: Theiler et al., 1992). SDA is a permutation test framework, similar to bootstrapping, and is used to test specific nulls that exclude certain dynamics. Every null comes with its own tailor made simulation procedures for creating surrogate data sets from the original sequences (refer to Kaplan and Glass, 1995, Kantz and Schreiber, 1997, Schreiber and Schmitz, 1996, 2000 and Kugiumtzis, 2001 for more details). In nutshell, via SDA one searches for large discrepancies between the statistic values on the original and surrogate sequences. When this occurs, one can safely reject the hypothesis that the original sequence stems from a process that is in compliance with the null. SDA is appropriate here as it allows us to bypass the limitations of chaotic invariance measures (such as Lyapunov exponents and dimension statistics) due to small data sets and noisy information. Although the BDS is a test for independence and not nonlinear determinism and complexity, under the SDA framework it can be used to test for absence of stochastic randomness via the exclusion of the null hypothesis.
For our case we used the null of the sequences being a monotonic nonlinear transformation of linearly filtered noise, which is also regarded as the “most interesting”. This implies strongly, the absence of stochastic (random) dynamics. We analyzed data from 53 FTSE 100 index stocks, spanning the period 01/01/1970 to 5/30/2003 (a maximum of 8717 observations). In tables 2 and 3 we present the results for 5% and 2.5% levels of statistical significance, for neighborhood sizes ranging from 0.5 to 2 times the standard deviation of . We clearly see that for up to 1.5 times the standard deviation, the null can be safely rejected (observe the large biases). However, for equalling twice the standard deviation, we can not always reject the null (but this is only for a few cases). Our SDA results do not reject the case of forecastability on the basis of arc values. They also suggest the presence of complex dynamics and the possibility of some level of determinism.
[ Insert table 2 about here. ]
[ Insert table 3 about here. ]
3 Conclusions
By adopting an approach similar to Koppl and Nardone (2001) we showed that the compass rose (Crack and Ledoit, 1996) can provide useful information for understanding further the dynamics of stock return sequences. Moreover, we do not reject the case of these dynamics being complex and forecastable. We also do not exclude the possibility of nonlinear determinism. However more research is needed on this controversial area (see Andrew and MacKinlay, 1988, Mayfield and Mizrach, 1992, and Hsieh, 1991). An interesting area for future research would be to experiment with differently simulated processes (such as purely chaotic, stochastic, (G)ARCH and mixtures of these) and examine similarities or dissimilarities with the results for the framework we follow in this letter. It would also be interesting to see how inhomogeneous sampling of such processes could alter the results we report here. That could provide useful information on how our view of the stock return dynamics changes as we move from high-frequency data to lower frequencies, which is also an issue that has been concerning the general compass rose literature.
References
- Amilon (2003) Amilon, H., 2003. GARCH estimation and discrete stock prices: an application to low-priced Australian stocks. Economics Letters 81 (2), 215–222.
- Andreou et al. (2000) Andreou, A. S., Pavlides, G., Karytinos, A., 2000. Nonlinear time-series analysis of the Greek exchange-rate market. International Journal of Bifurcation and Chaos 10 (7), 1729–1759.
- Andrew and MacKinlay (1988) Andrew, L. W., MacKinlay, C. A., 1988. Stock Market Prices do not Follow Random Walks: Evidence from a Simple Specification Test. Review of Financial Studies 1 (1), 41–66.
- Antoniou and Vorlow (2000) Antoniou, A., Vorlow, C. E., 2000. Recurrence plots and financial time series analysis. Neural Network World 10 (1-2), 131–146.
-
Antoniou and Vorlow (2004a)
Antoniou, A., Vorlow, C. E., 2004a. Price
Clustering and
Discreteness: Is there Chaos behind the Noise? Under Review in
Physica A: Statistical Mechanics and Its Applications.
URL http://arxiv.org/abs/cond-mat/0407471 - Antoniou and Vorlow (2004b) Antoniou, A., Vorlow, C. E., 2004b. Recurrence quantification analysis of wavelet pre-filtered index returns. Physica A: Statistical Mechanics and Its Apllications Forthcoming.
- Brealy and Meyers (1996) Brealy, R. A., Meyers, S. C., 1996. Principles of Corporate Finance, 4th Edition. McGraw-Hill, New York.
- Brock et al. (1987) Brock, W., Dechert, W., Scheinkman, J., 1987. A test for independence based upon the correlation dimension. Working paper, University of Winsconsin.
- Brock and Baek (1991) Brock, W. A., Baek, E. G., 1991. Some Theory of Statistical Inference for Nonlinear Science. Review of Economic Studies 58 (4), 697–716.
- Broussard and Koppl (1996) Broussard, J., Koppl, R., 1996. Big Players and and the Russian Ruble: Explaining Volatility Dynamics. Managerial Finance 25 (1), 49–63.
- Chen (1997) Chen, A., 1997. The square compass rose: the evidence from Taiwan. Journal of Multinational Financial Management 7 (2), 127–144.
- Chen (1993) Chen, P., 1993. Searching for economic chaos: A challenge to econometric practice and nonlinear tests. In: Day, R. H., Chen, P. (Eds.), Nonlinear dynamics and evolutionary economics. Oxford University Press, Oxford; New York; Toronto and Melbourne, pp. 217–53.
- Crack and Ledoit (1996) Crack, T. F., Ledoit, O., 1996. Robust structure without predictability: The “compass rose” pattern of the stock market. Journal of Finance 51 (2), 751–762.
- Enright (1992) Enright, A. J., 1992. Searching for chaotic components in financial time-series. Ph.d. thesis, Pace University.
- Fang (2002) Fang, Y., 2002. The compass rose and random walk tests. Computational Statistics & Data Analysis 39 (3), 299–310.
- Franses (1998) Franses, P. H., 1998. Time series anslysis models for business and economic forecasting. Cambridge University Press.
- Franses and Dijk (2000) Franses, P. H., Dijk, D. v., 2000. Nonlinear time series models in empirical finance. Cambridge University Press.
- Gleason et al. (2000) Gleason, K. C., Lee, C. I., Mathur, I., 2000. An explanation for the compass rose pattern. Economics Letters 68 (2), 127–133.
- Hsieh (1991) Hsieh, D. A., 1991. Chaos and nonlinear dynamics: Application to financial markets. Journal of Finance 46 (5), 1839–77.
- Kantz and Schreiber (1997) Kantz, H., Schreiber, T., 1997. Nonlinear Time Series Analysis. No. 7 in Cambridge Nonlinear Science series. Cambridge University Press, UK.
- Kaplan and Glass (1995) Kaplan, D. T., Glass, L., 1995. Understanding nonlinear dynamics. Textbooks in mathematical sciences. Springer-Verlag, New York.
- Koppl and Nardone (2001) Koppl, R., Nardone, C., 2001. The Angular Distribution of Asset Returns in Delay Space. Discrete Dynamics in Nature and Society 6, 101–120.
- Koppl and Yeager (1996) Koppl, R., Yeager, L., July 1996. Big Players and Herding in Asset Markets: The Case of the Russian Ruble. Explorations in Economic History 33 (3), 367–383.
- Kramer and Runde (1997) Kramer, W., Runde, R., 1997. Chaos and the compass rose. Economics Letters 54 (2), 113–118.
- Kugiumtzis (2001) Kugiumtzis, D., 2001. On the Reliability of the Surrogate Data Test for Nonlinearity in the Analysis of Noisy Time Series. International Journal of Bifurcation and Chaos 7 (11), 1881–1896.
- Kyrtsou and Terraza (2002) Kyrtsou, C., Terraza, M., 2002. Stochastic Chaos or ARCH Effects in Stock Series? a Comparative Study. International Review of Financial Analysis 11 (4), 407–431.
- Kyrtsou and Terraza (2003) Kyrtsou, C., Terraza, M., 2003. Is it Possible to Study Chaotic and ARCH Behaviour Jointly? Application of a Noisy Mackey-Glass Equation with Heteroskedastic Errors to the Paris Stock Exchange Returns Series. Computational Economics 21 (3), 257–276.
- Lee et al. (1999) Lee, C. I., Gleason, K. C., Mathur, I., 1999. A comprehensive examination of the compass rose pattern in futures markets. The Journal of Futures Markets 19 (5), 541–564.
- Mandelbrot (1999a) Mandelbrot, B. B., 1999a. A multifractal Walk down Wall Street. Scientific American 280 (2), 70–74.
- Mandelbrot (1999b) Mandelbrot, B. B., 1999b. Renormalization and fixed points in finance, since 1992 263 (1).
- Mayfield and Mizrach (1992) Mayfield, E. S., Mizrach, B., 1992. On determining the dimension of real-time stock-price data. Journal of Business and Economic Statistics 10 (3), 367–74.
- McKenzie and Frino (2003) McKenzie, M. D., Frino, A., 2003. The tick/volatility ratio as a determinant of the compass rose: empirical evidence from decimalisation on the NYSE. Accounting & Finance 43 (3), 331–331.
- Papaioannou and Karytinos (1995) Papaioannou, G., Karytinos, A., 1995. Nonlinear time series analysis of the stock exchange: The case of an emerging market. International Journal of Bifurcation and Chaos 5 (6), 1557–1585.
- Schreiber and Schmitz (1996) Schreiber, T., Schmitz, A., 1996. Improved surrogate data for nonlinearity tests. Phys. Rev. Lett. 77 (4), 635–638.
- Schreiber and Schmitz (2000) Schreiber, T., Schmitz, A., 2000. Surrogate time series. Physica D 142 (3-4), 346–382.
- Szpiro (1998) Szpiro, G. G., 1998. Tick size, the compass rose and market nanostructure. Journal of Banking & Finance 22 (12), 1559–1569.
- Theiler et al. (1992) Theiler, J., Eubank, S., Longtin, A., Galdrikian, B., Farmer, J. D., 1992. Testing for nonlinearity in time series: the method of surrogate data. Physica D: Nonlinear Phenomena 58 (1-4), 77–94.
- Wang et al. (2000) Wang, E., Hudson, R., Keasey, K., 2000. Tick size and the compass rose: further insights. Economics Letters 68 (2), 119–125.
- Wang and Wang (2002) Wang, H., Wang, C., 2002. Visibility of the compass rose in financial asset returns: A quantitative study. Journal of Banking & Finance 26 (6), 1099–1111.
| BDS Statistic | ||||
|---|---|---|---|---|
| : | ||||
| 0.897 | 1.794 | 2.691 | 3.588 | |
| 2 | 745.31 | 241.38 | 65.39 | 3.45 |
| 3 | 846.67 | 223.27 | 56.12 | 2.84 |
| 4 | 1010.50 | 220.27 | 49.64 | 1.68 |
| 5 | 1243.98 | 222.22 | 44.97 | 0.95 |
| 6 | 1577.48 | 229.07 | 41.54 | 0.39 |
| 7 | 2053.94 | 239.21 | 38.59 | 0.18 |
| 8 | 2743.93 | 252.22 | 36.10 | 0.72 |
| 9 | 3741.75 | 269.69 | 34.16 | 1.08 |
| 10 | 5201.71 | 291.13 | 32.85 | 1.16 |
| BDS Statistic p-values | ||||
| 2 | 0.00 | 0.00 | 0.00 | 0.00 |
| 3 | 0.00 | 0.00 | 0.00 | 0.00 |
| 4 | 0.00 | 0.00 | 0.00 | 0.09 |
| 5 | 0.00 | 0.00 | 0.00 | 0.34 |
| 6 | 0.00 | 0.00 | 0.00 | 0.69 |
| 7 | 0.00 | 0.00 | 0.00 | 0.86 |
| 8 | 0.00 | 0.00 | 0.00 | 0.47 |
| 9 | 0.00 | 0.00 | 0.00 | 0.28 |
| 10 | 0.00 | 0.00 | 0.00 | 0.25 |
| Statistic (BDS) | Bias | Standard Error | ||||||||||
|---|---|---|---|---|---|---|---|---|---|---|---|---|
| Neighborhood size : | ||||||||||||
| FTSE ALL SHARE - PRICE INDEX | 1249.61 | 339.45 | 48.02 | 21.75 | 1246.52 | 338.09 | 47.34 | 22.31 | 2.53 | 1.54 | 1.19 | 1.16 |
| FTSE 100 - PRICE INDEX | 152.69 | 97.72 | 35.55 | 20.52 | 152.91 | 97.70 | 35.56 | 20.58 | 0.87 | 1.00 | 0.94 | 1.21 |
| ALLIED DOMECQ | 823.28 | 259.24 | 68.38 | 1.29 | 821.57 | 258.47 | 67.80 | 0.93 | 1.81 | 1.00 | 0.99 | 1.06 |
| AMVESCAP | 159.36 | 130.18 | 60.63 | 28.46 | 158.57 | 129.63 | 59.80 | 27.64 | 1.20 | 1.24 | 1.26 | 1.25 |
| ASSD.BRIT.FOODS | 290.34 | 163.95 | 62.85 | 21.22 | 289.08 | 162.77 | 61.89 | 20.08 | 1.37 | 1.13 | 1.32 | 1.26 |
| AVIVA | 928.47 | 270.09 | 66.89 | 0.16 | 927.36 | 269.49 | 66.61 | 0.11 | 1.38 | 0.96 | 1.17 | 1.13 |
| BARCLAYS | 1076.24 | 281.21 | 62.10 | 5.50 | 1076.56 | 281.26 | 62.33 | 5.20 | 1.21 | 1.16 | 1.09 | 1.13 |
| BOC GROUP | 829.83 | 257.29 | 67.76 | 3.58 | 828.10 | 256.45 | 67.26 | 3.16 | 1.70 | 1.05 | 0.91 | 0.92 |
| BOOTS GROUP | 1076.14 | 283.31 | 64.05 | 5.67 | 1076.77 | 283.69 | 64.38 | 5.31 | 1.01 | 0.92 | 0.79 | 0.81 |
| BP | 1115.66 | 295.08 | 63.04 | 7.99 | 1114.58 | 294.74 | 62.90 | 8.04 | 1.32 | 1.04 | 1.24 | 1.26 |
| BRIT.AMERICAN TOBACCO | 961.19 | 273.01 | 66.07 | 3.63 | 959.84 | 272.50 | 65.74 | 3.80 | 1.23 | 0.82 | 0.75 | 0.76 |
| BRITISH LAND | 568.83 | 223.68 | 66.58 | 4.10 | 567.36 | 223.00 | 66.02 | 3.65 | 1.02 | 0.94 | 0.72 | 0.74 |
| BUNZL | 192.12 | 138.33 | 59.76 | 23.61 | 191.62 | 137.83 | 59.07 | 23.05 | 1.01 | 0.97 | 1.18 | 1.10 |
| CADBURY SCHWEPPES | 653.11 | 233.87 | 70.17 | 6.34 | 651.55 | 232.74 | 69.52 | 5.83 | 1.25 | 0.79 | 0.70 | 0.68 |
| DAILY MAIL ’A’ | 89.23 | 96.50 | 47.69 | 35.62 | 88.25 | 95.23 | 46.43 | 33.71 | 0.78 | 0.95 | 0.85 | 0.77 |
| DIAGEO | 619.63 | 225.74 | 67.63 | 5.33 | 618.52 | 224.98 | 67.00 | 4.83 | 1.01 | 0.88 | 0.84 | 0.71 |
| DIXONS GP. | 341.08 | 172.89 | 60.51 | 13.26 | 340.48 | 172.19 | 60.22 | 12.95 | 1.19 | 1.12 | 1.11 | 1.22 |
| EMAP | 72.70 | 69.19 | 35.03 | 20.02 | 72.73 | 68.86 | 35.12 | 20.23 | 1.26 | 1.27 | 1.26 | 1.07 |
| EXEL | 433.53 | 203.06 | 69.26 | 9.61 | 433.38 | 203.00 | 69.29 | 9.73 | 1.01 | 0.82 | 0.90 | 0.87 |
| FOREIGN & COLONIAL | 711.36 | 237.89 | 63.39 | 6.31 | 709.53 | 236.99 | 62.93 | 5.96 | 1.00 | 1.04 | 1.19 | 1.07 |
| GKN | 979.42 | 279.06 | 65.76 | 2.93 | 978.52 | 278.57 | 65.37 | 3.30 | 1.39 | 0.88 | 0.81 | 0.80 |
| GLAXOSMITHKLINE | 1069.02 | 282.23 | 62.10 | 6.11 | 1068.62 | 282.08 | 61.98 | 6.14 | 1.79 | 1.12 | 1.04 | 1.02 |
| GRANADA | 459.67 | 200.60 | 65.15 | 9.49 | 459.69 | 200.59 | 65.08 | 9.41 | 1.27 | 1.19 | 1.11 | 1.16 |
| GUS | 128.72 | 111.26 | 50.83 | 35.48 | 128.49 | 110.76 | 50.36 | 34.92 | 0.89 | 0.92 | 0.93 | 0.83 |
| HANSON | 804.72 | 251.67 | 61.16 | 2.19 | 804.64 | 251.61 | 61.11 | 2.20 | 1.06 | 1.09 | 0.90 | 0.98 |
| HILTON GROUP | 777.65 | 248.02 | 70.54 | 4.30 | 775.18 | 246.83 | 69.75 | 3.75 | 1.92 | 1.20 | 1.21 | 1.18 |
| IMP.CHM.INDS. | 1007.77 | 283.71 | 65.69 | 5.80 | 1007.17 | 283.64 | 65.66 | 5.77 | 1.64 | 0.92 | 1.22 | 1.21 |
| JOHNSON MATTHEY | 378.71 | 178.51 | 63.97 | 14.39 | 378.47 | 178.21 | 63.81 | 14.15 | 0.91 | 0.99 | 0.89 | 0.89 |
| LAND SECURITIES | 1089.61 | 282.28 | 62.79 | 6.22 | 1088.38 | 281.71 | 62.41 | 6.55 | 1.83 | 1.30 | 1.22 | 1.20 |
| LEGAL & GENERAL | 970.82 | 269.13 | 65.65 | 0.04 | 969.14 | 268.62 | 65.34 | 0.22 | 1.09 | 1.10 | 0.88 | 0.92 |
| MARKS & SPENCER GROUP | 912.70 | 272.35 | 64.73 | 2.03 | 909.93 | 270.77 | 63.62 | 3.04 | 1.67 | 1.36 | 1.32 | 1.26 |
| MORRISON (WM) SPMKTS. | 90.75 | 90.64 | 45.66 | 44.19 | 89.83 | 89.01 | 44.06 | 41.71 | 0.93 | 0.97 | 0.76 | 1.07 |
| NEXT | 253.11 | 151.42 | 55.97 | 18.84 | 252.81 | 150.97 | 55.62 | 18.50 | 1.02 | 1.16 | 0.94 | 1.13 |
| PEARSON | 444.27 | 196.80 | 64.87 | 8.11 | 444.02 | 196.49 | 64.80 | 8.04 | 1.08 | 0.84 | 0.94 | 0.84 |
| PROVIDENT FINL. | 266.69 | 155.41 | 58.69 | 16.83 | 266.57 | 155.36 | 58.50 | 16.76 | 0.77 | 0.98 | 1.11 | 0.77 |
| PRUDENTIAL | 910.07 | 267.31 | 65.78 | 0.13 | 909.09 | 266.63 | 65.29 | 0.37 | 1.08 | 0.98 | 0.79 | 0.79 |
| RECKITT BENCKISER | 836.20 | 258.41 | 67.44 | 2.10 | 836.20 | 258.47 | 67.68 | 2.30 | 1.33 | 1.29 | 1.19 | 1.24 |
| REED ELSEVIER | 898.32 | 261.80 | 63.61 | 1.99 | 898.15 | 261.72 | 63.60 | 1.93 | 1.37 | 1.14 | 1.04 | 1.01 |
| RENTOKIL INITIAL | 197.81 | 131.19 | 56.03 | 28.14 | 196.12 | 129.70 | 54.49 | 26.38 | 0.97 | 0.94 | 0.96 | 0.82 |
| REXAM | 697.01 | 237.79 | 72.49 | 6.51 | 695.08 | 236.83 | 71.66 | 5.71 | 1.38 | 0.90 | 0.90 | 0.88 |
| RIO TINTO | 849.08 | 260.87 | 66.48 | 3.08 | 848.51 | 260.71 | 66.40 | 3.19 | 1.59 | 1.37 | 1.33 | 1.31 |
| ROYAL BANK OF SCOTLAND | 433.58 | 198.72 | 65.90 | 9.33 | 432.41 | 198.07 | 65.28 | 8.83 | 0.88 | 1.06 | 0.93 | 0.86 |
| SAINSBURY (J) | 698.76 | 227.30 | 59.38 | 0.21 | 698.30 | 227.22 | 59.18 | 0.21 | 1.15 | 1.29 | 1.29 | 1.21 |
| SCHRODERS | 72.28 | 84.11 | 40.53 | 41.80 | 71.93 | 83.50 | 39.86 | 40.50 | 1.14 | 1.17 | 1.16 | 1.20 |
| SCOT. & NEWCASTLE | 750.36 | 245.66 | 67.65 | 0.87 | 749.30 | 244.78 | 67.08 | 0.40 | 1.09 | 0.72 | 0.94 | 0.95 |
| SHELL TRANSPORT & TRDG. | 1199.79 | 294.59 | 65.20 | 6.32 | 1198.76 | 293.78 | 64.65 | 6.72 | 1.46 | 1.07 | 1.04 | 1.04 |
| SMITH & NEPHEW | 500.14 | 208.90 | 71.11 | 14.25 | 497.28 | 206.89 | 69.41 | 12.80 | 1.64 | 1.67 | 1.60 | 1.60 |
| SMITHS GROUP | 587.34 | 222.17 | 69.99 | 10.48 | 586.92 | 222.11 | 70.07 | 10.66 | 1.36 | 0.92 | 1.27 | 1.29 |
| STD.CHARTERED | 623.16 | 223.03 | 67.43 | 5.56 | 622.41 | 222.38 | 66.93 | 5.16 | 1.24 | 1.05 | 0.84 | 0.93 |
| TESCO | 745.31 | 241.38 | 65.24 | 3.24 | 744.56 | 240.87 | 64.96 | 2.97 | 1.55 | 1.15 | 1.15 | 1.14 |
| TOMKINS | 77.66 | 73.89 | 37.40 | 25.49 | 77.65 | 73.70 | 37.12 | 25.38 | 1.17 | 1.29 | 0.94 | 0.93 |
| UNILEVER (UK) | 1017.26 | 278.21 | 59.93 | 7.77 | 1017.15 | 278.20 | 59.90 | 7.76 | 1.39 | 1.04 | 1.09 | 0.98 |
| WHITBREAD | 851.02 | 262.03 | 66.73 | 3.23 | 849.13 | 260.92 | 65.95 | 2.46 | 1.79 | 1.20 | 1.11 | 1.11 |
| WOLSELEY | 172.73 | 129.30 | 52.87 | 27.14 | 172.66 | 129.15 | 52.69 | 27.06 | 0.82 | 0.95 | 1.03 | 0.89 |
| WPP GROUP | 71.43 | 60.94 | 38.30 | 21.64 | 71.01 | 60.48 | 37.74 | 21.25 | 1.11 | 0.81 | 0.82 | 0.82 |
| Statistic (BDS) | Bias | Standard Error | ||||||||||
|---|---|---|---|---|---|---|---|---|---|---|---|---|
| Neighborhood size : | ||||||||||||
| FTSE ALL SHARE - PRICE INDEX | 1249.61 | 339.45 | 48.02 | 21.75 | 1245.98 | 338.20 | 47.50 | 22.15 | 1.97 | 0.98 | 0.98 | 1.01 |
| FTSE 100 - PRICE INDEX | 152.69 | 97.72 | 35.55 | 20.52 | 152.69 | 97.82 | 35.55 | 20.54 | 0.98 | 0.93 | 0.86 | 1.12 |
| ALLIED DOMECQ | 823.28 | 259.24 | 68.38 | 1.29 | 821.92 | 258.54 | 68.02 | 1.07 | 1.35 | 0.96 | 0.97 | 0.92 |
| AMVESCAP | 159.36 | 130.18 | 60.63 | 28.46 | 158.41 | 129.22 | 59.67 | 27.18 | 0.90 | 0.83 | 0.85 | 0.89 |
| ASSD.BRIT.FOODS | 290.34 | 163.95 | 62.85 | 21.22 | 288.64 | 162.40 | 61.51 | 19.84 | 1.35 | 1.33 | 1.37 | 1.30 |
| AVIVA | 928.47 | 270.09 | 66.89 | 0.16 | 926.88 | 269.44 | 66.56 | 0.05 | 1.36 | 1.18 | 1.23 | 1.17 |
| BARCLAYS | 1076.24 | 281.21 | 62.10 | 5.50 | 1075.93 | 281.31 | 62.19 | 5.38 | 1.36 | 1.14 | 1.16 | 1.11 |
| BOC GROUP | 829.83 | 257.29 | 67.76 | 3.58 | 828.19 | 256.50 | 67.12 | 3.08 | 1.62 | 1.03 | 0.89 | 0.84 |
| BOOTS GROUP | 1076.14 | 283.31 | 64.05 | 5.67 | 1075.91 | 283.18 | 63.98 | 5.69 | 1.26 | 1.01 | 0.95 | 0.92 |
| BP | 1115.66 | 295.08 | 63.04 | 7.99 | 1114.62 | 294.54 | 62.78 | 8.18 | 1.70 | 1.34 | 1.19 | 1.20 |
| BRIT.AMERICAN TOBACCO | 961.19 | 273.01 | 66.07 | 3.63 | 959.60 | 272.40 | 65.67 | 3.99 | 1.37 | 1.08 | 1.00 | 0.94 |
| BRITISH LAND | 568.83 | 223.68 | 66.58 | 4.10 | 567.30 | 222.67 | 65.59 | 3.19 | 1.17 | 0.95 | 1.03 | 1.00 |
| BUNZL | 192.12 | 138.33 | 59.76 | 23.61 | 191.61 | 137.79 | 59.05 | 22.97 | 0.99 | 0.98 | 0.90 | 0.84 |
| CADBURY SCHWEPPES | 653.11 | 233.87 | 70.17 | 6.34 | 651.52 | 232.88 | 69.47 | 5.61 | 1.35 | 1.04 | 1.02 | 1.00 |
| DAILY MAIL ’A’ | 89.23 | 96.50 | 47.69 | 35.62 | 88.45 | 95.38 | 46.60 | 33.87 | 1.07 | 0.99 | 1.01 | 1.14 |
| DIAGEO | 619.63 | 225.74 | 67.63 | 5.33 | 618.36 | 225.24 | 67.24 | 5.02 | 1.26 | 1.15 | 1.19 | 1.22 |
| DIXONS GP. | 341.08 | 172.89 | 60.51 | 13.26 | 340.07 | 172.18 | 59.87 | 12.58 | 0.97 | 0.99 | 0.88 | 0.99 |
| EMAP | 72.70 | 69.19 | 35.03 | 20.02 | 72.78 | 68.80 | 34.77 | 20.02 | 1.04 | 1.08 | 0.87 | 1.04 |
| EXEL | 433.53 | 203.06 | 69.26 | 9.61 | 433.28 | 202.75 | 69.08 | 9.38 | 1.04 | 1.04 | 0.99 | 0.97 |
| FOREIGN & COLONIAL | 711.36 | 237.89 | 63.39 | 6.31 | 709.87 | 236.98 | 62.74 | 5.78 | 1.23 | 1.21 | 1.03 | 1.08 |
| GKN | 979.42 | 279.06 | 65.76 | 2.93 | 978.64 | 278.57 | 65.46 | 3.20 | 1.33 | 1.10 | 1.04 | 1.08 |
| GLAXOSMITHKLINE | 1069.02 | 282.23 | 62.10 | 6.11 | 1068.51 | 281.94 | 61.86 | 6.30 | 1.29 | 1.03 | 1.03 | 1.04 |
| GRANADA | 459.67 | 200.60 | 65.15 | 9.49 | 459.69 | 200.39 | 65.16 | 9.38 | 1.15 | 1.29 | 1.14 | 1.22 |
| GUS | 128.72 | 111.26 | 50.83 | 35.48 | 128.32 | 110.95 | 50.35 | 34.85 | 1.15 | 1.12 | 1.14 | 1.09 |
| HANSON | 804.72 | 251.67 | 61.16 | 2.19 | 804.75 | 251.79 | 61.30 | 2.07 | 1.09 | 1.03 | 0.99 | 1.02 |
| HILTON GROUP | 777.65 | 248.02 | 70.54 | 4.30 | 776.09 | 247.12 | 69.98 | 3.90 | 1.31 | 1.17 | 1.10 | 1.14 |
| IMP.CHM.INDS. | 1007.77 | 283.71 | 65.69 | 5.80 | 1007.48 | 283.85 | 65.79 | 5.67 | 1.33 | 1.03 | 0.88 | 0.88 |
| JOHNSON MATTHEY | 378.71 | 178.51 | 63.97 | 14.39 | 378.02 | 177.88 | 63.54 | 13.91 | 1.03 | 1.01 | 0.89 | 0.88 |
| LAND SECURITIES | 1089.61 | 282.28 | 62.79 | 6.22 | 1088.71 | 281.87 | 62.38 | 6.55 | 1.26 | 1.10 | 0.99 | 0.95 |
| LEGAL & GENERAL | 970.82 | 269.13 | 65.65 | 0.04 | 969.44 | 268.38 | 65.24 | 0.33 | 1.36 | 1.08 | 0.96 | 0.96 |
| MARKS & SPENCER GROUP | 912.70 | 272.35 | 64.73 | 2.03 | 909.91 | 270.94 | 63.82 | 2.77 | 1.33 | 0.95 | 0.78 | 0.85 |
| MORRISON (WM) SPMKTS. | 90.75 | 90.64 | 45.66 | 44.19 | 90.24 | 89.74 | 44.68 | 42.54 | 0.93 | 0.90 | 0.92 | 0.93 |
| NEXT | 253.11 | 151.42 | 55.97 | 18.84 | 252.66 | 151.03 | 55.45 | 18.50 | 0.82 | 0.96 | 0.82 | 0.73 |
| PEARSON | 444.27 | 196.80 | 64.87 | 8.11 | 443.83 | 196.62 | 64.64 | 7.87 | 1.09 | 1.02 | 1.00 | 0.94 |
| PROVIDENT FINL. | 266.69 | 155.41 | 58.69 | 16.83 | 266.55 | 155.49 | 58.70 | 16.89 | 1.04 | 1.29 | 1.20 | 1.09 |
| PRUDENTIAL | 910.07 | 267.31 | 65.78 | 0.13 | 909.18 | 267.05 | 65.59 | 0.00 | 1.22 | 1.01 | 1.06 | 1.11 |
| RECKITT BENCKISER | 836.20 | 258.41 | 67.44 | 2.10 | 835.56 | 257.93 | 67.04 | 1.72 | 1.20 | 1.12 | 1.00 | 0.98 |
| REED ELSEVIER | 898.32 | 261.80 | 63.61 | 1.99 | 897.92 | 261.77 | 63.47 | 2.14 | 1.37 | 1.13 | 1.12 | 1.13 |
| RENTOKIL INITIAL | 197.81 | 131.19 | 56.03 | 28.14 | 196.05 | 129.48 | 54.33 | 26.04 | 0.91 | 1.19 | 1.09 | 1.17 |
| REXAM | 697.01 | 237.79 | 72.49 | 6.51 | 695.26 | 236.76 | 71.64 | 5.70 | 1.53 | 1.21 | 1.17 | 1.21 |
| RIO TINTO | 849.08 | 260.87 | 66.48 | 3.08 | 848.18 | 260.53 | 66.23 | 3.30 | 1.03 | 0.98 | 0.85 | 0.86 |
| ROYAL BANK OF SCOTLAND | 433.58 | 198.72 | 65.90 | 9.33 | 432.32 | 198.01 | 65.34 | 8.82 | 1.15 | 0.96 | 0.81 | 0.83 |
| SAINSBURY (J) | 698.76 | 227.30 | 59.38 | 0.21 | 698.48 | 227.33 | 59.46 | 0.22 | 0.93 | 0.95 | 0.83 | 0.82 |
| SCHRODERS | 72.28 | 84.11 | 40.53 | 41.80 | 71.77 | 83.11 | 39.59 | 40.11 | 1.03 | 1.13 | 1.10 | 1.26 |
| SCOT. & NEWCASTLE | 750.36 | 245.66 | 67.65 | 0.87 | 749.08 | 245.00 | 67.06 | 0.26 | 1.03 | 0.96 | 0.91 | 0.89 |
| SHELL TRANSPORT & TRDG. | 1199.79 | 294.59 | 65.20 | 6.32 | 1198.60 | 294.14 | 65.03 | 6.45 | 1.58 | 1.17 | 1.10 | 1.07 |
| SMITH & NEPHEW | 500.14 | 208.90 | 71.11 | 14.25 | 497.73 | 207.15 | 69.72 | 12.99 | 1.17 | 1.20 | 1.06 | 1.11 |
| SMITHS GROUP | 587.34 | 222.17 | 69.99 | 10.48 | 586.43 | 221.51 | 69.40 | 9.90 | 1.28 | 0.97 | 1.12 | 1.14 |
| STD.CHARTERED | 623.16 | 223.03 | 67.43 | 5.56 | 623.18 | 222.82 | 67.38 | 5.56 | 1.18 | 1.10 | 1.13 | 1.21 |
| TESCO | 745.31 | 241.38 | 65.24 | 3.24 | 745.08 | 241.37 | 65.23 | 3.33 | 1.12 | 1.16 | 1.10 | 1.08 |
| TOMKINS | 77.66 | 73.89 | 37.40 | 25.49 | 77.72 | 73.55 | 37.02 | 25.33 | 0.87 | 0.98 | 1.10 | 0.90 |
| UNILEVER (UK) | 1017.26 | 278.21 | 59.93 | 7.77 | 1017.42 | 278.30 | 60.03 | 7.68 | 1.28 | 0.98 | 0.98 | 0.96 |
| WHITBREAD | 851.02 | 262.03 | 66.73 | 3.23 | 849.28 | 261.35 | 66.25 | 2.81 | 1.44 | 1.10 | 1.12 | 1.16 |
| WOLSELEY | 172.73 | 129.30 | 52.87 | 27.14 | 172.58 | 129.19 | 52.74 | 26.87 | 1.06 | 1.08 | 1.10 | 0.96 |
| WPP GROUP | 71.43 | 60.94 | 38.30 | 21.64 | 71.32 | 60.89 | 38.02 | 21.43 | 1.00 | 1.01 | 0.73 | 0.94 |