Inclusion of Experimental Information in First Principles Modeling of Materials
Abstract
We propose a novel approach to model amorphous materials using a first principles density functional method while simultaneously enforcing agreement with selected experimental data. We illustrate our method with applications to amorphous silicon and glassy GeSe2. The structural, vibrational and electronic properties of the models are found to be in agreement with experimental results. The method is general and can be extended to other complex materials.
pacs:
61.43.Fs, 71.23.Cq, 71.15.Mb1 Introduction
Michael Thorpe has devoted an important part of his distinguished career to exploring the structure of materials. For this reason, it is not inappropriate for us to contribute a novel technique for forming models of complex materials to this volume. We offer this work with respect and affection to Mike, in honor of his 60th birthday. An essential feature of materials science is the synergy between experiment and theory. A properly conducted experiment reveals the fundamental characteristics of a material, be they structural, electronic, magnetic or other. For cases in which there is no doubt of the reliability of an experiment, the data hold primacy over any theoretical considerations – the data express what we know to be true about the material. Experiments, however, provide highly incomplete information about the system in question. Virtually every experimental technique probes large, and often macroscopic volumes of a sample. On the other hand, many properties (particularly electronic and optical properties) may be determined by tiny fractions of the sample (those parts associated with defects, for example), which are often invisible to the probe, or if visible, averaged over all the defects in the material. Simulation has the great virtue that it provides exquisite atomistic detail – atomic coordinates, localized electronic eigenstates, vibrational eigenmodes etc., but any simulation scheme requires many approximations (typically including unphysically short time scales, small models and always approximate interatomic interactions). In practice, the modeler requires experimental information to discern whether his or her model is credible. The current modus operandi is then to adopt a simulation scheme, make a model and hope for the best. If there are no serious contradictions with experiment the work is published and new insights may accrue. Many successes have come from this approach to modeling, but it is often the case that contradictions with experiment do exist, in which case the model is not precisely describing nature. In this paper, we make a first attempt to systematize the process of forcing atomistic models to be maximally consistent with experimental data and appropriate interatomic interactions, and offer a recipe to accomplish this. With the importance of experimental information clearly in mind, an alternative paradigm has been proposed by McGreevy and others, the so-called “Reverse Monte Carlo” (RMC) method [1, 2, 3]. Here, one sets out to build an atomistic model agreeing with experiment(s). This is implemented by making Monte Carlo moves of atomic coordinates which drive a structural model toward exact agreement with one or more experiments. No interatomic interaction is needed for the method. The logic of the method is simple and appealing.
In this paper, we merge ab initio molecular relaxation (MR) with RMC. What makes this hybrid approach attractive is that the methods (MR and RMC) are complementary to each other. One can describe this scheme as a way to “tune” a structural model using MD within the space of experimentally realistic models as defined by RMC. In this paper, we choose two materials to illustrate our scheme: the first one is amorphous silicon which is notoriously hard to model by melt quenching, whereas the second one is a troublesome and complex material with a long experimental and modeling history: g-GeSe2.
2 Summary of Reverse Monte Carlo Simulation
RMC has been described in detail elsewhere [1]. At its simplest, it is a technique for generating structural configurations based on experimental data. The method was originally developed by McGreevy & Pustazi [1, 2] for liquid and glassy materials for lack of different routes to explore experimental data but in recent years progress has been made toward modeling crystalline systems as well. Starting with a suitable configuration, atoms are displaced randomly using periodic boundary conditions until the input experimental data (either the structure factor or the radial distribution function) match the data obtained from the generated configuration. This is achieved by minimizing a cost function which consists of either structure factor or radial distribution function along with some appropriately chosen constraints to restrict the search space. Consider a system having number of atoms with periodic boundary condition. One can construct a generalized cost function for an arbitrary configuration by writing :
| (1) |
where is related to the uncertainty associated with the determination of experimental data points as well as the relative weight factor for each set of different experimental data. Here and stands for the total number of different experimental data set and data points. The quantity is the appropriate generalized variable associated with experimental data and is the penalty function associated with each constraint (if minimized to zero implies exact agreement with experimental data set ), and is a (positive) weight factor for each constraint.
3 Experimentally Constrained Molecular Relaxation
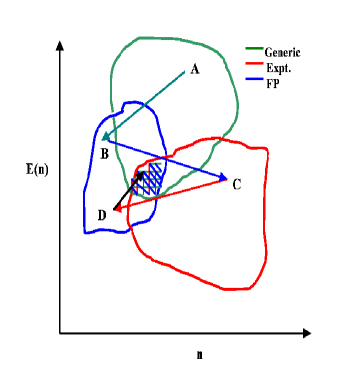
(Right panel; Color online) A cartoon diagram of configuration space showing how the method works. Those parts of the configuration space consistent with experimental and first principles (FP) energy minima are indicated along with a “generic” space, which includes only some primitive a priori constraints. The cross-hatched region is consistent with both experiments and theory which corresponds to realistic configurations of materials. ECMR can drive a starting configurations to this region following a possible path shown in the figure.
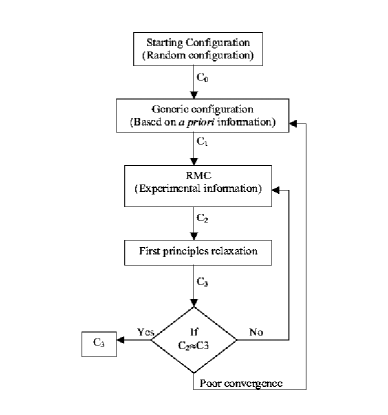
From the preceding section, it is apparent that inclusion of adequate information is crucial for successful production of a realistic (representative) configuration. Ideally, one should enforce all the experiments available. Typically this might include structural, electronic and vibrational properties for a well-studied material. One possible way to keep the problem tractable is to use minimal experimental information in conjunction with a knowledge of interactions between the atoms. The obvious means to do this is to add a constraint in RMC (an additional in Eq. 1) to minimize the magnitude of the force on all the atoms according to some energy functional or possibly to minimize the total energy. Particularly for an ab initio Hamiltonian this is expensive, since Monte Carlo minimization of Eq. 1 requires a large number of energy/force calls. Thus, we instead employ a simple “self consistent” iteration scheme: (1) starting with an initial “generic” configuration [4] C1, minimize to get C2, 2) Steepest-descent quench C2 with an ab initio method to get C3, (3) subject the resulting configuration to another RMC run (minimize again), repeat steps (2) and (3) until both the force-field relaxed model and RMC models no longer change with further iteration. For the RMC component of the iteration, we make the conventional choice of using Monte Carlo for the minimization. This is easily implemented and does not require gradients (and thus allows the use of non-analytic terms in Eq. 1 [5], if desired). A schematic representation of our method is presented in Figure 1, and a cartoon suggesting a possible trajectory through configuration space (starting from the broadest “generic network” space, and ideally concluding in the cross-hatched region representing a minimum both for experiment and for accurate interatomic interactions). Since the method directly uses experimental information in association with first principles relaxation, we refer to this method as experimentally constrained molecular relaxation or ECMR.
We emphasize that our method is flexible. The logic of our method suggests that one should include whatever important experimental information is available. In this paper we limit ourselves to the pair-correlation functions. In principle, other experiments could be included as well. These might be costly to include (for example to compel agreement with the vibrational density of states, the dynamical matrix would be required at each iteration). The method is equally suited to fast empirical potentials, which would allow studies of very large models. It is also easy to force a close fit to some restricted range of data, and a less precise fit elsewhere if desired. Our scheme also provides insight into the topological signatures of different constraints (experimental or otherwise). Chemical and or topological constraints could also be maintained as part of the RMC iteration.
Our method can be understood as a way to minimize an effective potential energy function , where is the potential energy of the configuration (denoted by ), , and is a non-negative cost function enforcing experimental (or other) constraints as in Eq. 1. Empirically, we find that it is possible to find configurations that simultaneously approximately minimize both terms (which implies that the choice of is not very important). It is also clear that our method is really statistical: in general one should generate an ensemble of conformations using ECMR.
4 ECMR model of glassy GeSe2
In this section, we apply our ECMR method to g-GeSe2, a classic glass former. The material is particularly known for its interesting physical properties: (1) it displays nanoscale order: a “first sharp diffraction peak” (FSDP) is observed in neutron diffraction measurement, (2) the material has interesting photoresponse (understanding of which requires the electronic structure), (3) the material is difficult to simulate with ab initio techniques [6, 7, 8, 9].
The model used in our calculation consists of 647 atoms of Ge and Se in a cubic box of size 27.525 Å. We start with a configuration (C1 in figure1) obtained by constraining the coordination number (2 for Se, 4 for Ge) and the bond-angle distribution of Se-Ge-Se to an approximate Gaussian with the average bond angle 109.5∘. The configuration is “generic” in the sense that it includes none of the detailed chemistry of Ge and Se aside from the 8-N rule and initially heteropolar bonding. Salmon and Petri [10] have recently measured separately the three (Ge-Se, Ge-Ge and Se-Se) partial structure factors using the method of isotopic substitution. We utilized all three partials (in real space) in the RMC step to construct an approximate configuration. The MD relaxation was done with FIREBALL [11]. It was found that after the fourth ECMR iteration, S(Q) hardly changed. In figure 2, we plot the experimental partial structure factors, and the total S(Q) after the fourth iteration of ECMR relaxation. The agreement between the ECMR obtained partials structure factors and the experiment is very reasonable. The difference is possibly due to relatively small system size and small inconsistencies between the experiments and the total energy functional. The FSDP in figure 2 is genuinely well reproduced (very close in width and centering, and much improved from all previous models in height). Moreover, as for our “Decorate and Relax” method [12], the large structure closely tracks experiment (unlike the experience for quench from the melt models). These features are of course “built in”; we show here that the method does preserve every important feature of the structure of the glass manifested in S(Q). A characteristic feature of GeSe2 glass is the presence of edge- and corner-sharing tetrahedra. Raman spectroscopy [13] and Neutron diffraction [14] studies have indicated that almost 33% to 40% of total Ge atoms are involved in edge-sharing tetrahedra. The fraction obtained from our model is found to be 38%. We also have observed that about 81% of Ge atoms of our model are 4-fold coordinated of which approximately 75% form predominant Ge-centered structural motifs while the rest 6% are ethane-like units. The remaining Ge atoms are 3-fold coordinated and are mostly found to be bonded as Ge–Se3 units. On the other hand, the percentage of 2-, 3- and 1-fold coordinated Se atoms are 72%, 18% and 10% respectively. Mössbauer experiments, where Sn was used as a Ge probe [15], estimated that the fraction of Ge involved in dimers is 16%. Petri and Salmon [10] have recently studied local atomic environment by Neutron diffraction measurements. By integrating partial radial distribution functions via Fourier transform of structure factors they obtained nearest neighbor coordination numbers = 0.25, = 0.20, and = 3.7 that corresponds to average coordination number = 2.68. The corresponding values from


(Right panel) The partial structure factors of the ECMR model along with the experimental data[10] are plotted for a direct comparison.
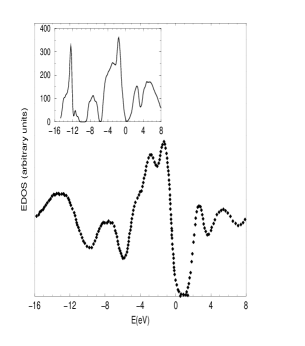
our model are : = 0.17, = 0.30, = 3.68, and = 2.66. The partial and total coordination numbers, therefore, agree well with experiments and are consistent with the 8-N rule which predicts = 2.67. The percentage of homopolar bonds present in our model is found to be about 6.2 % which is again very close to the value 8% noted by Petri and Salmon [10]. In figure 3, we have plotted the electronic density of states (EDOS) of our ECMR model using a first principles density functional code FIREBALL [11]. The EDOS is obtained by convoluting each energy eigenvalue with suitably broadened Gaussian. Our EDOS in figure 3 agrees well with experimental results obtained from x-ray photo-emission spectroscopy [16] (XPS), inverse photo-emission spectroscopy[17] (IPES) and ultraviolet photo-emission spectroscopy [18] (UPS) measurements as well as with those obtained in recent theoretical studies [19, 20, 8, 7]. Interestingly, all the relevant experimental features are also found in the calculated EDOS, providing further support for the reliability and accuracy of our method. The substantial splitting between the first two peaks of the valence bands named the and peaks is well pronounced.

(Right panel) The bond angle distribution for the RMC model of amorphous silicon described in the text. The average bond angle is found to be 109.01∘ with root-mean-square deviation 12.5∘.
Finally, we examine the vibrational density of states (VDOS) of our model due to the close relationship to its atomic-scale structure and its mechanical properties. The computational methodology was reported elsewhere [8]. Comparing our VDOS with experiment obtained by inelastic neutron-scattering [21], the spectrum exhibits the same features. Three bands can be distinguished: a low energy acoustic band involving mainly extended interblock vibrations and a high energy optic band consisting of more localized intrablock vibrations. The two main bands are found to be clearly separated by the tetrahedral breathing (A1-A1c) band. The overall agreement is rather good. The 2-4 meV redshift from experiment starting at 35 meV and the discrepancy around 17-20 meV have also been observed by Cobb et al [8]. The A1–A1c splitting is difficult to determine accurately from the vibrational density of states. In this work, we have observed two peaks in the A1–A1c region which are separated by approximately 2.5meV to 3.5meV.
5 RMC model of Amorphous Silicon
Having studied g-GeSe2 we now address amorphous silicon, an important material with a wide variety of applications. The structure of a-Si is well represented by continuous random network (CRN) model. A number of techniques have been developed over the last three decades to produce CRN networks, but the jewel of all these is undoubtedly the so-called “bond switching” algorithm of Wooten, Winer and Weaire (WWW) [22, 23]. Other methods such as quench from the melt simulation, while working for a number of glasses (e.g. a-SiO2), is found to be far less effective for modeling a-Si. The “quench from the melt” produces too much liquid character and high defect concentration that lead to incorrect topology of the network. Although there is no definitive reason as to why it is so difficult to model from the melt, the failure is generally attributed to the presence of 6-fold coordinated atoms in liquid Si in contrast to amorphous state where tetrahedral bonding is considered as one of the characteristic features of the network. One supposes that MD within its short time scale cannot explore the entire phase space to determine the tetrahedral network topology of the amorphous silicon. Reverse Monte Carlo has been applied to model a number of materials including amorphous silicon [1]. Of particular interest related to a-Si are the models developed by Gereban and Pusztai [2] and Walters and Newport [3]. Although these early models are not useful in studying electronic properties, they do contain some characteristic features of tetrahedral bonding of a-Si network.
The particular RMC scheme that we implement can be found in Reference [24]. We compel agreement with the static structure factor to keep the bond angles as close as possible to the tetrahedral value, while also maintaining four-fold coordination. Since we are interested in both the structural and electronic properties, we choose to model a reasonable system size of 500 atoms in a cubic box of length 21.18Å. The results for the RMC model (obtained after RMC fit followed by first principles relaxation using Siesta Harris [25]) are presented in figure 3–4. The structure factor for the final configuration is plotted in the left panel of figure 4 along with the experimental data obtained by Laaziri et al [26]. It is clear from the plot that the experimental data agree closely with our RMC model except for the few points near the first peak. It is tempting to suggest that this (small) deviation is possibly due small size of our model. But, we have noticed that this deviation continues to persist even in large, high quality continuous random network generated by WWW algorithm. Next we focus on the bond angle distribution of our model. Structure factor or radial distribution function can only provide information at the two-body level. A further characterization of the network is therefore necessary in terms of higher order correlation functions which requires examining at least bond angle distribution of the network. The average bond angle and the root-mean-square (RMS) deviation provide a good measure of the quality of the CRN network which is plotted in the right panel of figure 3. The average bond angle of our RMC model is found to be 109.01∘ along with the RMS 12.5∘. The latter is slightly higher than its WWW counterpart where an RMS deviation as narrow as 9.9∘ has been reported [27]. The number of four-fold coordinated atoms is 88% while the remaining 12% consists of three- and five-fold corodinated atoms. We also observe that the characteristic features of a-Si electronic DOS are correctly produced although the bandtailing is exaggerated. We are working on implementing ECMR for a-Si which we believe will address some of the existing problems with our present RMC model.
6 ECMR and Medium range Order
Despite the lack of long-range translational and orientational order, some covalent amorphous solids exhibit structural order (with varying degree) at the medium length scale. MRO is associated with length scales of few nanometers, and may affect mechanical, electronic and optical properties of materials. Diffraction measurements provide little information at this length scale because of the isotropic nature of most disordered materials.
Recent development of Fluctuation electron microscopy (FEM) provides an opportunity to detect medium-range order in non-crystalline materials [28]. FEM is essentially an electron microscopy technique that can be used to detect MRO by measuring fluctuations in the diffracted intensity originating from the nano-scale volumes in the sample. Thus, the FEM signal carries information about the MRO and by gathering information from these different nano-scale volumes MRO can be detected by computing the normalized variance of the diffracted beam intensity. The meaning of the FEM signal has been recently developed by Treacy and Gibson [28] which shows that the FEM signal is sensitive to two-, three- and four-body correlation functions of the sample and contain information which is absent in a standard diffraction measurement. The normalized variance of the measured intensity can be written as [29],
where is the measured intensity, is the scattering vector, is inversely proportional to the real space resolution which is usually set to the length scale at which MRO is believed to exist and indicates averaging over the positions of the sample. Recent studies of amorphous thin films via FEM have led to the suggestion that such films of a-Si and a-Ge contain small highly strained ordered crystalline grains known as paracrystals. These paracrystalline and continuous random network models can have structure factor that are almost indistinguishable with difference occurring only at medium-range length scales. Computer modeling has recently indicated that certain non-crystalline Si films may not be simply a continuous random network, but rather consist of nano-sized strained crystalline grains embedded in a continuous random network matrix [30]. While such nano-sized crystalline grains in a CRN matrix is sufficient to explain the FEM data, some questions remain unanswered. The question of whether the paracrystalline model is the only one containing the signature of MRO is still a matter of conjecture. Since we know from RMC simulation that one can generate configurations of a-Si having almost identical structure factor but with very different topology, it is natural to explore the possibility of constructing CRN models that do not contain nano-sized grains in the model and yet displays the characteristic signature of MRO via FEM data. Motivated by the success of our ECMR approach to model glassy GeSe2, we recently attempted to include MRO in a CRN model via following scheme: (1) construct a cost function comprises of FEM signal and radial distribution function (2) minimize the cost function via RMC subject to the constraint that no atoms can come closer to 2.0Å and, (3) accept only those moves during RMC simulation (in step 2) that only lower the total energy of the configuration in order to generate a stable, minimally strained network.
The cost function is similar to the one we have used earlier except that we include experimentally obtained FEM data along with the radial distribution function. We start with a cubic supercell (box length 43.42Å) consisting of 4096-atom model of a-Si due to Djordjevic, Thorpe and Wooten [31]. This initial configuration does not have any signature of MRO as is indicated by a flat FEM signal. Using RMC scheme, we match experimental FEM data, permitting only moves that simultaneously minimize both the cost function and the total energy of the system obtained from a modified Stillinger-Weber potential [32]. The final ECMR relaxed configuration is found to be 100% four-fold coordinated and has energy per atom -3.007 eV. This is significant considering the fact that the lowest energy configuaration obtained after relaxing the initial configuration (again with the modified Stillinger-Weber potential) has energy -3.013 eV/atom. The structure factor and the electronic density of states of the fitted CRN are found to agree quite well with experiments.
In FEM, one estimates medium-range order by studying images obtained (from FEM) in two different modes: variable resolution (VRFEM) and variable coherence (VCFEM). In variable resolution one measures the characteristic MRO length scale by varying for a fixed value of , while variation of for a given yields the information about medium-range structure. In figure 4, we have plotted the variable coherence FEM data for both the starting and final continuous random network configurations. For the purpose of comparison, we have also plotted the experimental data obtained by Voyles et al [30]. We choose a low resolution to probe atomic correlation within a volume of 10 Å radius. The presence of MRO is manifested in the form a large variance and strong dependence of the VCFEM signal. Figure 4 clearly reveals this feature and shows that the fit with the experimental VCFEM data is very good. This shows that our simulated CRN model not only has correct short-range structure (reflected in radial and bond angle distributions) and electronic density of states but also displays a strong FEM signal which confirms the presence of medium-range order in the sample.


(Right panel) Image intensity variance () as a function of scattering vector magnitude () for a 4096-atom ECMR-CRN and a CRN model along with the experimental data of as-deposited a-Si measured by Voyles et al [30]. The resolution for the experimental and simulated (both starting and final) data are fixed at 15 Å and 10 Å respectively. The experimental FEM data are multiplied by 100 before the start of simulation.
An intriguing feature of MRO (appearing in VCFEM signal) is the position of the peaks at values 0.3 Å and 0.55 Å. The atomistic origin (in terms of real space MRO structure) of these peaks is still not very clear. In the paracrystalline model, these maxima are thought to be associated with Bragg’s diffraction from crystalline grains and their relative orientation with each other. While one cannot rule out this possibility, there are indications that the peaks are independent of the presence of crystalline grains in the structure. Our preliminary studies of the 4000-atom paracrystalline model have shown that the peaks are present even when grains are removed from the model. It is therefore not unreasonable to suggest that the paracrystalline structure (i.e. the presence of small crystalline grains in a CRN matrix) while sufficient, is not necessary to account for the experimental data obtained in fluctuation microscopy.
Finally we comment briefly on the dihedral angle distribution (DAD) and the presence of MRO. It is believed that dihedral angles (related to the reduced four-body correlation function) are another signature of medium-range structure in a non-crystalline network that should be reflected in the dihedral angle distribution. It is therefore pertinent to compute the dihedral angle distributions from the paracrystalline model, our ECMR fitted CRN, the initial CRN and to examine to what extent they differ from each other. Once again our preliminary studies have indicated that both ECMR fitted CRN and the initial CRN have almost identical dihedral distributions. As for the paracrystalline model, we have noticed a slight increase in the distribution function (almost negligible) near 60∘ which was also reported by Voyles et al [30]. This result however must be interpreted carefully taking into consideration that the dihedral angle distribution in crystalline silicon is a sharp peak at 60∘. The presence of crystalline grains therefore evidently favor having more dihedral angles centered around 60∘ giving an added contribution to the total dihedral angle distribution.
References
- [1] McGreevy R L 2001 J. Phys.: Condens. Matter 13 R877
- [2] Gereben O and Pusztai L 1994 Phys. Rev. B 50 14136
- [3] Walters J K and Newport R J 1996 Phys. Rev. B 53 2405
- [4] A “generic” configuration does not contain any experimental information but empirical characteristic of the structure only (when available). For example, a configuration with 4-fold coordination can be treated as a generic configuration for -Si while for g-GeSe2, the coordination for Ge and Se should be 2 and 4 respectively. It is generic in the sense that other information (such as bond angle) can be used to construct such a configuration. One generic configuration may be favorable than another depending on the structure of configuration space.
- [5] It is possible that suitable gradient-based methods could provide more rapid convergence, a point we do not investigate here.
- [6] Massobrio C, Pasquarello A and Car R 1998 Phys. Rev. Lett 80 2342.
- [7] Tafen D N, Drabold D A 2003 Phys. Rev. B 68 165208
- [8] Cobb M, Drabold D A and Cappelletti R L 1996 Phys. Rev. B 54 12162
- [9] Zhang X and Drabold D A 2000 Phys. Rev. B 62 15695
- [10] Petri I and Salmon P S 2000 Phys. Rev. Lett. 84 2413
- [11] Sankey O.F and Niklewski D J 1989 Phys. Rev. B 40 3979; Sankey O F, Drabold D A, Adams G B, 1991 Bull. Am. Phys. Soc. 36 924
- [12] Drabold D A, Li J and Tafen D N 2003 J. Phys.: Condens. Matt. 15 S1529
- [13] Jackson K, Briley A, Grossman S, Porezag D V and M R 1999 Phys. Rev. B 60 R14985
- [14] Susman S, Volin K J, Montague D G and Price D L 1990 J. Non-Cryst. Solids 125 168
- [15] Boolchand P, Grothaus J, Bresser W J and Suranyi P 1982 Phys. Rev. B 25 2975
- [16] Bergignat E, Hollinger G, Chermette H, Pertosa P, Lohez D, Lannoo M and Bensoussan M 1988 Phys. Rev. B 37 4506
- [17] Hosokawa S, Hari Y, Ono I, Nishihara K, Taniguchi M, Matsuda O and Murase K 1994 J. Phys.: Condens. Matter 6 L207
- [18] Hino S, Takaharshi T and Harada Y 1980 Solid State Commun. 35 379
- [19] Louie S G 1982 Phys. Rev. B 26 5993
- [20] Pollard W 1992 J. Non-Cryst. Solids 144 70
- [21] Cappelletti R L, Cobb M, Drabold D A and Kamitakahara W A 1995 Phys. Rev. B 52 9133
- [22] Wooten F, Winer K and Weaire D 1985 Phys. Rev. Lett. 54 1392
- [23] Wooten F and Weaire D 1987 Solid State Physics edited by H Ehrenreich, D Turnbull and F Seitz (New York: Academic Press) vol. 40 p40
- [24] Biswas P, Atta-Fynn R and Drabold D A 2004 Phys. Rev. B 69 195207
- [25] Ordejón P, Artacho E and Soler J M 1996 Phys. Rev. B 53 10441
- [26] Laaziri K, Kycia S, Roorda S, Chicoine M, Robertson J L, Wang J and Moss S C 1999 Phys. Rev. Lett. 82 3460
- [27] Barkema G T and Mousseau N 2000 Phys. Rev. B 62 4985
- [28] Treacy M M J and Gibson J M 1996 Acta Cryst. A52, 212
- [29] Voyles P M 2001 Fluctuation Electron Microscopy of Medium-range order in Amorphous Silicon Dissertation University of Illinois at Utbana-Champaign
- [30] Voyles P M, Zotov N, Nakhmanson S, Drabold D A, Gibson J M, Treacy M M J and Keblisnki P 2001 J. App. Phys. 90, 9; Voyles P M and Abelson J R 2003 Solar energy materials and solar cells 78 85
- [31] Djordjevic B R, Thorpe M J and Wooten F 1995 Phys. Rev. B 52, 2539 (1998)
- [32] Vink R L C, Barkema G T, van der Weg W F and Mousseau N 2001 J. Non-Cryst. Solids 282, 248