Isotope Effect in the Superfluid Density of HTS Cuprates: Stripes, Pseudogap and Impurities
Abstract
Underdoped cuprates exhibit a normal-state pseudogap, and their spins and doped carriers tend to spatially separate into 1- or 2-D stripes. Some view these as central to superconductivity, others as peripheral and merely competing. Using La2-xSrxCu1-yZnyO4 we show that an oxygen isotope effect in and in the superfluid density can be used to distinguish between the roles of stripes and pseudogap and also to detect the presence of impurity scattering. We conclude that stripes and pseudogap are distinct, and both compete and coexist with superconductivity.
pacs:
71.10.Hf, 74.25.Dw, 74.62.Dh, 74.72.DnHigh- superconductors (HTS) remain a puzzle. Various correlated states have been identified in HTS including antiferromagnetism, the pseudogapTimusk , nanoscale spin-charge stripesTranquada and, of course, superconductivity (SC). (Here we generalise“stripes” to include possible 2D checkerboard structuresDavis ). The pseudogap is a nodal energy gap of uncertain origin that appears in the normal-state (NS) density of states (DOS). Its effects can be observed in many physical propertiesTimusk ; Talloram . Several opposing views are still current. One is that stripes play a central roleEmery1 , forming the pseudogap correlationSalkola and/or mediating the SC pairing. Another is that the NS pseudogap arises from incoherent superconducting fluctuations which set in well above Emery2 . Another is that these states are independently competingLoram . Here stripes and pseudogap play a secondary role and SC is mediated by some other pairing boson. An unambiguous test of these opposing views is urgently needed. We show here that isotope effects provide such a test.
The isotope exponent in a given property is defined as = ()/(), where is the isotopic mass and may be , the SC gap parameter, , the pseudogap energy scale, , or the superfluid density = = . ( is the in-plane London penetration depth, is the carrier density and is the effective electronic mass for in-plane transport). An isotope effect on was first discovered in 1950 by Allen et al. for SnAllen . They found which provided the central clue for the role of phonons in pairing and led 7 years later to the BCS theory of SCBCS .
The situation with HTS is more complex. The oxygen isotope effect on was foundBatlogg to be small, with . However, with decreasing doping the effect rises and eventually diverges as Franck ; Pringle . Surprisingly, an isotope effect was also found in the superfluid densityZhao (and attempts were made to resolve this into a dominant isotope effect just in Zhao2 ; Zhao1 ). We will show that both of these unusual effects can be understood in terms of a normal-state pseudogap which competes with SCWilliams . We also predict and confirm an isotope effect in induced by impurity scattering. The isotope effects in and are mapped as a function of doping in La2-xSrxCu1-yZnyO4 and we observe a canonical pseudogap behavior as well as a huge anomalous effect associated with stripes. The clear distinction between these effects shows that the pseudogap and stripe states are distinct and both compete with SC.
An isotope effect, , in the superfluid density is surprising because for a simple BCS superconductor it is rigorously zero. According to Leggett s theorem, is just the total integrated spectral weight of the free carriers i.e. the total carrier density divided by the effective massLeggett . But, when there are strong departures from nearly-free-electron theory this need not be so. We identify two cases for HTS in which an isotope effect in arises: in the presence of (i) impurity scattering, and (ii) a pseudogap.
HTS possess a -wave order parameter and in the presence of impurity scattering both and are diminished. The degree to which they are reduced depends upon the magnitude of the scattering rate, , relative to the maximum gap parameter, , near . In the presence of a competing pseudogap, spectral weight removed by the pseudogap is no longer available for the condensate and, again, both and are diminished. The degree to which they are reduced depends upon the relative magnitudes of the pseudogap and the SC gap. Thus, and are reduced according to the magnitude of the ratios for impurity scattering, and for a pseudogap. In either case, a relatively small isotope effect in will necessarily produce enhanced isotope effects in and which diverge as . Now it has been shown from specific heat, NMR and ARPES that, with increasing doping, decreases and closes abruptly at a critical doping state, holes/Cu, in the lightly overdoped regimeTalloram . It follows that the isotope effect in should disappear at critical doping where the pseudogap closes provided that impurity scattering is absent. Our initial task is to quantify these effects.
First, we recall that there is no isotope effect in the pseudogap. We have examined the 89Y Knight shift in YBa2Cu4O8 using magic angle spinning with extremely narrow linewidths (100 Hz) and found no isotope effect within the bounds Williams . Though not essential, we proceed under the assumption that an isotope effect is confined to the pairing gap, , and absent from the pseudogap, . The small isotope effect observed in in the same compound does not reflect an isotope effect in the pseudogap. Using the enhanced susceptibility formalism it devolves, rather surprisingly, into an isotope effect in the paramagnon frequencyTalloram .
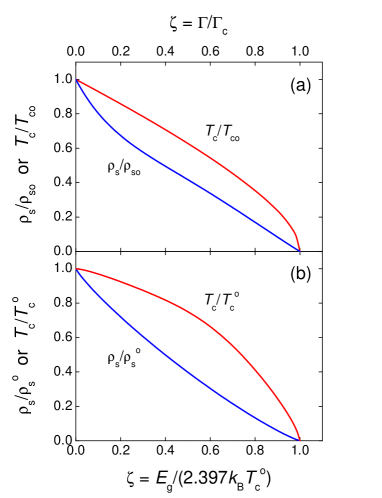
Theory. Impurity scattering for a -wave order parameter has been investigated by many authorsMaki ; Tallon . We summarize the results in Fig. 1(a) which shows the depression of and as a function of , where is the critical scattering rate for fully suppressing . The reduction in follows the standard Abrikosov-Gorkov equation. In the unitary limit, the scattering rate where is the density of scatterers and is the NS DOS. Fig. 1(a) shows that falls at first slowly then accelerates while falls at first rapidly then slows as grows. We define the functions and given by and . The isotope effects in and are
| (1) |
The prime indicates differentiation of or . Thus
| (2) |
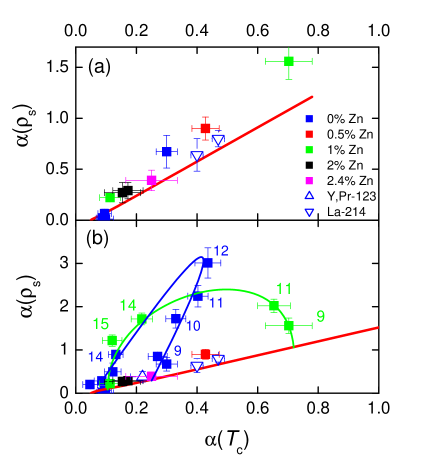
We have shown previouslyPringle ; Williams that the isotope effect in across the entire phase diagram is consistent with an underlying exponent (in the absence of scattering and pseudogap) of . The red line in Fig. 2(a) shows plotted versus using this value. In the absence of impurity scattering = 0 and = = 0.06. This is the left-hand termination of the red line. With increasing scattering both and rise along the line, and finally diverge as .
Turning to the pseudogap, specific heatLoram and tunneling measurementsKrasnov show that the pseudogap is non-states-conserving, with an approximately triangular energy dependence, and pinned to the Fermi level, . We assume therefore a triangular normal-state DOS:
| (3) |
and solve standard weak-coupling -wave BCS expressions to calculate as a function of . For this particular NS DOS as where is Boltzmann s constant and . Fig. 1(b) shows plotted as a function of . As for impurity scattering, the depression in is slow at first and more rapid as .
ElsewhereTallon2 we have calculated the effect of a triangular pseudogap on . The approach is admittedly for a Fermi liquid but we note that the effects we describe are dominated by the nodal regions of the Fermi surface where such a Fermi liquid approach is more likely to be valid. is plotted as a function of in Fig. 1(b). This exhibits an initial rapid fall which slows as grows and . The overall behavior is qualitatively similar to that shown in Fig. 1(a) for impurity scattering, but differs in detail. We could therefore define new functions and as above and derive an equation formally identical to eq. (2) to describe the isotope effects in and associated with the presence of the pseudogap. These equations show that when the pseudogap closes at critical doping we have and while . The resultant curve versus almost exactly coincides with the red line in Fig. 2(a). If there were an isotope effect in the pseudogap in eq. (1) should be replaced by and eq. (2) and the red line in Fig. 2 remain unchanged.
Experimental details. La2-xSrxCu1-yZnyO4 samples were synthesized by solid state reaction at 985∘C in air by repeated milling, pelletization and reaction until phase pure as determined by x-ray diffraction. Two small, approximately mm3 bars, were cut from alongside each other at the centre of each of the resultant pellets to ensure, as much as possible, identical pairs. They were isotope exchanged in identical quartz tubes, one charged with 16O and the other with 18O, side by side in a furnace. The 18O gas (from Isotec) was 99% enriched and several exchanges were employed until about 95% exchange was achieved. On the final exchange the samples were slow cooled then annealed for 15 hours at 500∘C to ensure oxygenation to full stoichiometry. The degree of exchange was confirmed by Raman measurements of the spectral shifts of the oxygen phonons.
To determine the isotope shifts in and we carried out field-cooled DC magnetization measurements in the mixed state at 150 Oe. For this regime Zhao and MorrisZhao2 adopted the relationFinnemore
| (4) |
for the limit, near , of . Here is the mean radius of the SC grains. These authors showed that this relation could be used to deduce separate isotope effects in and . But the algebra was incorrect (see Appendix below). A further problem arisesClem in that, for small particles, this relation does not satisfy the sum rule, the condensation energy. With a mean grain size of 25m and ranging from 0.2 to 0.32mPanag , we adopt the limit which is clearly satisfied up to a few K below . This yields
| (5) |
Thus the isotope coefficient in the slope of is given by . What we report is the partial isotope exponent due to the change in oxygen mass only. We obtained qualitatively similar results with Meissner state measurements at 10 Oe (not shown).
Results. We start first with the effect of impurity scattering in the overdoped region where the pseudogap is absent. Illustrative plots of magnetization versus temperature are shown in Fig. 3(a) for = 0, 1, 2 and 2.4% (solid curves). It evident that an isotope effect in is present in each but that one in is only present in the higher Zn concentrations. Values of are plotted versus in Fig. 2 (a) (left-hand cluster of blue, green, black and mauve squares) and they are seen to be roughly consistent with the model calculation. The fact that as indirectly shows that any disorder potential present in Zn-free La2-xSrxCuO4 in the overdoped region is too small to present significant scattering and hence . It also seems unlikely that there is any significant phase separation because the domain walls would surely act as scattering centers.
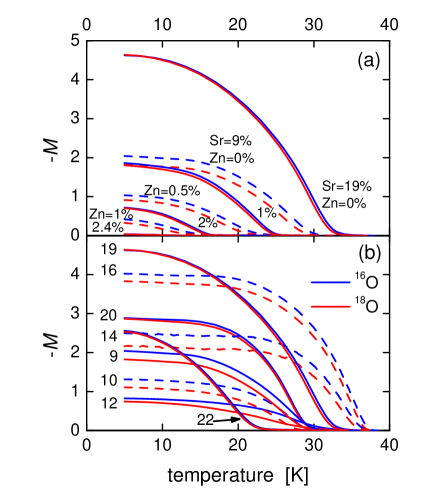
Turning to the heavily underdoped pseudogap region, we show magnetization curves in Fig. 3(a) for with , 0.5 and 1% Zn (dashed curves). The resultant versus values are plotted in Fig. 2(a), shown by the blue, red and green data points to the right. These continue to track up the canonical curve, showing that the pseudogap and impurity scattering have essentially the same effect in such a plot. To this data we add previously-reportedHofer values for La2-xSrxCuO4 obtained using muon spin relaxation (SR) with = 0.080 and 0.086 (blue down triangles). The collective data is generally consistent with the model.
Fig. 3(b) shows a selection of illustrative plots of vs for Zn-free samples with ranging from 0.09 to 0.22. It is immediately evident from the low- values of that = 0 for all but becomes non-zero and large as falls below 0.19. Values of are plotted against in Fig. 2 (b) (blue squares) and increasing doping is shown by the arrow. Here, a remarkable anomaly is evident. The overdoped data and the heavily underdoped data lie near the canonical pseudogap line. But near the data deviates drastically from this canonical behavior. This is presumably due to the presence of charged stripes, inferred from neutron scattering near =1/8, which provide strong electronic coupling to the lattice. If the pseudogap itself arose from fluctuating stripes one might expect the anomaly to drive up the canonical line. The huge deviation suggests a fundamentally different behavior and clearly distinguishes stripes from the pseudogap near =1/8.
In order to further test this interpretation we examined the effects of non-magnetic Zn substitution. Our expectation was that the combined effects of spin vacancies and the tendency of Zn to enhance the canonical behavior would be to broaden and weaken the anomaly pushing it up the canonical line. Fig. 2(b) shows the effect of 1% Zn substitution (green squares). The contour, indicated by the green curve, confirms our expectations.
Finally, we show by the upward open triangle in Fig. 2(b) recently reported and data for Y1-zPrzBa2Cu3O7-δ obtained by Khasanov et al. using SRKhasanov . For these authors found K and we estimate that the doping state is very close to . And yet the data resides close to the canonical line completely free of the anomalous deviation associated with stripes. It is clear from inelastic neutron scattering studies that the YBa2Cu3O7-δ compound exhibits a much weaker tendency to stripe formation. Consistent with this we find this sample exhibits essentially stripe-free canonical pseudogap behavior.
We conclude that our results and analysis demonstrate a clear distinction between the canonical effects on the superfluid density arising from the pseudogap and impurity scattering on the one hand and stripe correlations on the other. We achieve this by examining a plot of versus which is relatively insensitive to the precise details of the NS DOS. Stripes cause a huge deviation from this canonical behavior associated with the strong electronic coupling to the lattice arising from spatial charge modulation. On the basis of these results we make the important conclusion that stripe and pseudogap correlations are fundamentally different and both compete with each other and with superconductivity.
We acknowledge financial support from the Marsden Fund and the MacDiarmid Institute (JLT, JS and GVMW) and from Trinity College, Cambridge and the Cambridge Commonwealth Trust (RSI).
Appendix - isotope effect in m∗?
Several authorsZhao1 ; Zhao2 have considered the possibility that the isotope effect in may be resolved into - and they have sought to determine these two components separately.
Zhao et al.Zhao1 investigated the oxygen isotope dependence of the orthorhombic/tetragonal (O/T) transition in La2-xSrxCuO4 and found a null effect. Because the O/T transition temperature is doping dependent they took this to indicate that there was no isotope effect in the carrier concentration and consequently the isotope effect in derives wholly from the isotope effect in i.e. = . However, the location of the O/T transition is an ion-size dependent effect not primarily a doping effect and, moreover, there is no simple relationship between the doped hole concentration, , and the carrier concentration.
Elsewhere, Zhao and MorrisZhao2 use eq. (5) for 10G measurements to yield a magnetisation slope
| (6) |
while for 150G measurements they use eq. (4) from which they deduce
| (7) |
Clearly, measurement of the isotope effects in and would allow extraction of the individual isotope effects in and in . However, eq. (4) does not lead to eq. (7).
To see this we consider the relationWerthamer
| (8) |
which, on substitution in eq.(4) when , reduces to eq. (5) and
| (9) |
Thus the isotope effect in cannot be separated into separate contributions from and in the way suggested by Zhao and Morris.
References
- (1) T. Timusk, B. Statt, Rep. Prog. Phys. 62, 61 (1999).
- (2) J.M. Tranquada et al., Phys. Rev. Lett. 78, 338 (1998).
- (3) T. Hanaguri et al., Nature 430, 1001 (2004).
- (4) J.L. Tallon and J.W. Loram, Physica C 349, 53 (2000).
- (5) V.J. Emery, S.A. Kivelson, O. Zachar, Phys. Rev. B 56, 6120 (1997).
- (6) M.I. Salkola, V.J. Emery, S.A. Kivelson, Phys. Rev. Lett. 77, 155 (1996).
- (7) V.J. Emery, S.A. Kivelsen, Nature (London) 374, 434 (1995).
- (8) J.W. Loram et al., J. Phys. Chem. Solids 59, 2091 (1998).
- (9) W.D. Allen et al., Nature 166, 1071 (1950).
- (10) J. Bardeen, L.N. Cooper, J.R. Schrieffer, Phys. Rev. 108, 1175 (1957).
- (11) B. Batlogg et al., Phys. Rev. Lett. 58, 2333 (1987).
- (12) J.P. Franck in Physical Properties of High Temperature Superconductors vol. 4, ed by D.M. Ginsburg (World Scientific, Singapore, 1994) 189.
- (13) D.J. Pringle, G.V.M. Williams, J.L. Tallon, Phys. Rev. B 62, 12527 (2000).
- (14) G-M. Zhao et al., Phys. Rev. B 52, 6840 (1995).
- (15) G-M. Zhao, D.E. Morris, Phys. Rev. B 51, 16487 (1995).
- (16) G-M. Zhao, M.B. Hunt, H. Keller and K.A. Müller, Nature 385, 236 (1997).
- (17) G.V.M. Williams et al., Phys. Rev. Lett. 80, 377 (1998).
- (18) A.J. Leggett, J. Stat. Phys. 93, 927 (1998).
- (19) E. Puchkaryov, K. Maki, Eur. Phys. J. B 4, 191 (1998).
- (20) J.L. Tallon et al., Phys. Rev. Lett. 79, 5294 (1997).
- (21) V.M. Krasnov et al., Phys. Rev. Lett. 86, 2657 (2001).
- (22) J.L. Tallon et al., Phys. Rev. B 68 R180501 (2003).
- (23) D.K. Finnemore et al., Phys. Rev. B 35, 5319 (1987).
- (24) J.R. Clem, Reversible Magnetisation Sum Rule for Small Superconductors , (to be published).
- (25) C. Panagopoulos et al., Phys. Rev. B 67 220502 (2003).
- (26) J. Hofer et al., Phys. Rev. Lett. 84, 4192 (2000).
- (27) R. Khasanov et al., J. Phys.: Cond. Mat 15, L17 (2003).
- (28) N.R. Werthamer, E. Helfand, and P.C. Hohenberg, Phys. Rev. 147 295 (1966).