Electrical conductivity in granular media and Branly’s coherer: A simple experiment
Abstract
We show how a simple laboratory experiment can illustrate certain electrical transport properties of metallic granular media. At a low critical external voltage, a transition from an insulating to a conductive state is observed. This transition comes from an electro-thermal coupling in the vicinity of the microcontacts between grains where microwelding occurs. Our apparatus allows us to obtain an implicit determination of the microcontact temperature, which is analogous to the use of a resistive thermometer. The experiment also illustrates an old problem, the explanation of Branly’s coherer effect – a radio wave detector used for the first wireless radio transmission, and based on the sensitivity of the metal fillings conductivity to an electromagnetic wave.
I Introduction
The coherer or Branly effect is an electrical conduction instability that appears in a slightly oxidized metallic powder under a constraint.Branly90 The initial high powder resistance falls irreversibly by several orders of magnitude as soon as an electromagnetic wave is produced in its vicinity. The effect was discovered in 1890 by E. BranlyBranly90 and is related to other phenomena. For instance, a transition from an insulating state to a conducting state is observed as the external source exceeds a threshold voltage (the DC Branly effect); temporal fluctuations and slow relaxations of resistance also occur under certain conditions.Falcon04
Although these electrical transport phenomena in metallic granular media were involved in the first wireless radio transmission near 1900, they still are not well understood. Several possible processes at the contact scale have been invoked without a clear verification: electrical breakdown of the oxide layers on grains,Kamarinos75 the modified tunnel effect through the metal-oxide/semiconductor-metal junction,Holm00 the attraction of grains by molecular or electrostatic forces,Gabillard61 and local welding of microcontacts by a Joule heating effect.Vandembroucq97 ; Dorbolo03 ; Holm00 A global process of percolation within the grain assembly also has been invoked.Kamarinos75 ; Gabillard61 ; Vandembroucq97
Our goal in this paper is to understand the DC Branly effect by means of an experiment with a chain of metallic beads.Falcon04bis Our focus is on the local properties (the contacts between grains) instead of the collective properties. We also discuss the history of the electrical and thermal properties of non-homogeneous media such as granular media, as well as the influence of electromagnetic waves on their conductance.Taylor04 After a brief review of the history of the coherer effect in Sec. II, we introduce in Sec. III.1 an experiment that can be easily done in a standard physics laboratory. We present our results in Sec. III.2, followed by a qualitative and quantitative interpretation of the conduction transition mechanism in Secs. III.3 and III.4. Our conclusions are given in Sec. IV.
II A brief historical review
In 1887, shortly after the publication of Maxwell’s theory of electromagnetism, experiments performed by H. Hertz clearly demonstrated the free space generation and propagation of electromagnetic waves. He noticed that sparks (high frequency electromagnetic waves of the order of 100 MHz) could induce arcing across a wire loop containing a small gap, a few meters away.Hertz1893 ; Emerson01
This discovery was anticipated by many people; P. S. Munk observed in 1835 the permanent increase of the electrical conductivity of a mixture of metal filings resulting from the passage of a discharge current of a Leyden jar.Kryzhanoskii92 In 1879 D. E. Hughes observed a similar phenomenon for a loose contact formed of a carbon rod resting in the grooves in two carbon blocks, and with a tube filled with metallic granules (a microphone because it was first designed to detect acoustic waves). Hughes appears to have discovered the important fact that such a tube was sensitive to electric sparks at a distance as indicated by its sudden change in conductivity. At the time, the Royal Society of London was not convinced, and his results were published some 20 years later,Hughes99 a long time after the discovery of hertzian waves. In 1884 T. Calzecchi-Onesti performed experiments on the behavior of metallic powders under the action of various electromotive forces, and observed a considerable increase of the powder conductivity by successively opening and closing a circuit containing an induction coil and a tube with fillings.Fleming1906
The action of nearby electromagnetic waves on metallic powders was observed and extensively studied by Branly in 1890.Branly90 When metallic filings are loosely arranged between two electrodes in a glass or ebonite tube, it has a very high initial resistance of many megohms due to an oxide layer likely present on the particle surfaces. When an electric spark was generated at a distance away, the resistance was suddenly reduced to several ohms. This conductive state remained until the tube was tapped restoring the resistance to its earlier high value. Because the electron was not known at this time (it was discovered in 1897),Blatt89 Branly called his device a “radio conductor” to recall that “the powder conductivity increased under the influence of the electric radiations from the spark;” the meaning of the prefix “radio” at this time was “radiant” or “radiation.” He performed other experiments with various powders, lightly or tightly compressed, and found that the same effect occurred for two metallic beads in contact, and for two slightly oxidized steel or copper wires lying across each other with light pressure.Branly02 This loose or imperfect contact was found to be extremely sensitive to a distant electric spark.
This discovery caused a considerable stir when O. Lodge in 1894 repeated and extended Hertz’s experiments by using a Branly tube, a much more sensitive detector than the wire loop used by Hertz.Emerson01 ; Fleming1906 Lodge improved the Branly tube so that it was a reliable, reproducible detector, and automated it by tapping on the tube with a slight mechanical shock. Lodge called this electromagnetic wave detector a “coherer” from the Latin cohaerere, which means “stick together.” He said that the fillings “coherered” under the action of the electromagnetic wave and needed to be “decoherered” by a shock. Later, Branly and Lodge focused their fundamental research on mechanisms of powder conductivity, and not on practical applications such as wireless communications. However, based on using the coherer as a wave detector, the first wireless telegraphy communications were transmitted in 1895 by G. Marconi, and independently by A. S. Popov.Bridgman01 ; Kryzhanoskii92 ; Fleming1906 Popov also used the coherer to detect atmospheric electrical discharges at a distance.
Lodge first hypothesized that the metallic grains were welded together by the action of the voltages that are induced by electromagnetic waves.Fleming1906 According to some including Lodge,Tommasina98 ; Fleming1906 the grains became dipoles and attracted each other by electrostatic forces, inducing grains to stick together, thus forming conductive chains. A shock should be enough to break these fragile chains and to restore the resistance to its original value. Branly did not believe this hypothesis, and to demonstrate that motion of the grains was not necessary, he immersed the particles in wax or resin. He also used a column of six steel balls or disks, which were a few centimeters in diameter. Because the coherer effect persisted, he thought that the properties of the dielectric between the grains played an important role. In 1900, Guthe et al. performed similar experiments with two balls in contact.Guthe01 However, the invention by de Forest of the triode in 1906, the first vacuum tube (an audion), supplanted the coherer as a receiver, and Branly’s effect sank into oblivion without being fully understood.
In the beginning of the 1960s, a group in Lille became interested in this old problem. They suggested that attractive molecular forces keep the particles in contact even after the removal of the applied electrostatic field.Gabillard61 In the 1970s, numerous papers considered the conductivity of granular materials for batteries, but they did not focus on the electrical conduction transition.Euler78 In 1975, a group in Grenoble suggested a mechanism of electrical breakdown of the oxide layer on the grain surfaces and investigated the associated resistance noise.Kamarinos75 In 1997, the conduction transition was observed by direct visualization (with an infrared camera) of the conduction paths when a very high voltage ( V) was applied to a monolayer of aluminium beads.Vandembroucq97 More recently, the action at a distance of sparks was investigated.Dorbolo03 For additional information about the history of the coherer, see Refs. Histo, and Contro, .
III Electrical conductivity of a chain of metallic beads
Understanding the electrical conduction transition in granular materials is a complicated problem that depends on many parameters: the statistical distribution of the shape and size of the grains, the applied force, and the local properties at the contact scale of two grains, that is, the degree of oxidization, surface state, and roughness. Among the phenomena proposed to explain the coherer effect, it is easy to show that some have only a secondary contribution. For instance, because the coherer effect was observed by Branly with a single contact between two grains,Branly02 percolation cannot be the dominant mechanism. Moreover, when two beads in contact are connected in series with a battery, a coherer effect is observed at a sufficiently high imposed voltage,Guthe01 in a way similar to the action at a distance of a spark or an electromagnetic wave. We will reduce the number of parameters, without loss of generality, by focusing on electrical transport within a chain of metallic beads directly connected to a DC electrical source.
III.1 Experimental setup
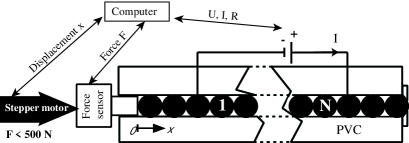
The experimental setup is sketched in Fig. 1. It consists of a chain of 50 identical stainless steel beads,AISI each 8 mm in diameter, and m in roughness. The beads are surrounded by an insulating medium of polyvinylchloride (PVC). A static force N is applied to the chain of beads by means of a stepper motor, and is measured with a static force sensor. The number of motor steps is measured with a counter to determine , the total deformation of the chain that is necessary to reach a specific force. During a typical experiment, we supply a current ( A) and simultaneously measure the voltage , and thus the resistance . Similar results have been found by repeating the experiment with an applied voltage and measuring and thus . The number of beads between the two electrodes is varied from 1 to 41 by moving the electrode beads within the chain. The lowest resistance of the entire chain (a few ohms) is always found to be much higher than that of the electrode and the stainless steel bulk material.
III.2 Experimental results
The mechanical behavior of the bead chain is found to be in very good agreement with the nonlinear Hertz law (given by linear elasticity), that is . This result leads to an estimate of the typical range of the deformation between two beads as 2 to m, and of the apparent contact radius, , of 40 to m, when ranges from 10 to 500 N.
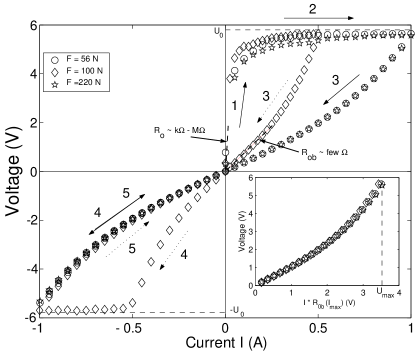
The electrical behavior is much more remarkable than the mechanical one. Because no particular precautions were taken for the beads, an insulating film (oxide or contaminant), a few nanometers thick, is likely present at the bead-bead contact. When the applied current to the chain is increased, we observe a transition from an insulating to a conductive state as shown in Fig. 2. At low applied current and fixed force, the voltage-current - characteristic is reversible and ohmic (see arrow in Fig. 2) with a high, constant resistance, . This resistance (–) at low current depends in a complex way on the applied force and on the contaminant film properties (resistivity and thickness) at the contact location. The value of is determined by the slope of the - plot at low current. As is increased further, the resistance strongly decreases, corresponding to a bias independent of (see arrow ). As soon as this saturation voltage is reached, the - characteristic is irreversible if the current is decreased (see arrow ). The resistance reached at low decreasing current, (the order of 1–), depends on the previously applied maximum current, . Note that the nonlinear return trajectory is reversible upon again increasing the current, , and also is symmetrical when the current applied to the chain is reversed (see arrows 4 and 5). For different applied forces and different values of , we show that the return trajectories depend only on and follow the same reverse trajectory when is plotted versus (see the inset in Fig. 2). The values of are determined by the slopes of the - return trajectories at low and decreasing current (see Fig. 2).
The decrease of the resistance by several orders of magnitude (from to ) is similar to that of the coherer effect with powdersBranly90 and with a single contact.Branly02 ; Guthe01 Note that after each cycle of the current, the applied force is reduced to zero, and we roll the beads along the chain axis to form new contacts for the next cycle. With this procedure, the fall of the resistance (the coherer or Branly effect) and the saturation voltage are always observed and are very reproducible.
The saturation voltage is independent of the applied force, but depends on the number of beads between the electrodes. The saturation voltage per contact is found to be constant when the number of beads is varied from 1 to 41 and is on the order of 0.4 V per contact. However, this saturation voltage depends slightly on the bead material ( V for stainless steel beads, V for bronze beads, and 0.3 V for brass beads), but is of the same order of magnitude.Falcon04bis
III.3 Qualitative interpretation
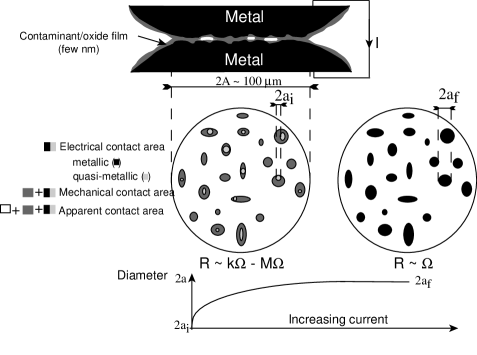
Assume a mechanical contact between two metallic spheres covered by a thin contaminant film ( few nm). The interface generally consists of a dilute set of microcontacts due to the roughness of the bead surface.Holm00 The mean radius, , of these microcontacts is of the order of magnitude of the bead roughness m, which is much smaller than the apparent Hertz contact radius m. Figure 3 schematically shows the creation of good electrical contacts by the transformation of this poorly conductive film. At low applied currents, the high value of the contact resistance (k–M) probably comes from a complex conduction path found by the electrons through the film within the very small size (m) of each microcontact (see light grey zones in Fig. 3). The electrons damage the film and lead to a “conductive channel”: the crowding of the current lines within these microcontacts generates a thermal gradient in their vicinity if significant Joule heat is produced. The mean radius of the microcontacts then strongly increases by several orders of magnitude (for example, from m to m), and thus enhances their conduction (see Fig. 3). This increase of the radius is responsible for the nonlinear behavior of the - characteristic (arrow in Fig. 2). At high enough current, this electro-thermal process can lead to local welding of the microcontacts (arrow 2 in Fig. 2); the film is thus pierced in a few places where purely metallic contacts (few ) are created (see the black zones in Fig. 3). (Note that the current-carrying channels (bridges) are a mixture of metal and the film material rather than a pure metal. It is likely that the coherer action results in only one bridge – the contact resistance is lowered so much that piercing at other points is prevented.) The - characteristic is reversible when is decreased and then increased (arrow 3 in Fig. 2). The reason is that the microcontacts have been welded, and therefore their final size does not vary any more for . The - reverse trajectory then depends only on the temperature reached in the metallic bridge and no longer depends on the bridge size as for the initial trajectory.
III.4 Quantitative interpretation
We now check the interpretation in Sec. III.3 quantitatively. Assume a microcontact between two clean metallic conductors (thermally insulated at the uniform temperature , with no contaminant or tarnish film on their surfaces). Such a clean microcontact is called a “spot.” If an electrical current flowing through this spot is enough to produce Joule heating (assumed to be totally dissipated by thermal conduction in the conductors), then a steady-state temperature distribution is quickly reached (s) in the contact vicinity. The maximum temperature reached, , is located at the contact, and is related to the potential, , at the isotherm, , by the Kohlrausch equationHolm00 ; Greenwood58
| (1) |
where is the thermal conductivity and is the electrical resistivity of the conductor, both depending on the temperature . Thermal equilibrium means that the heat flux, , across the isothermal surfaces, , is due to the electrical power, , where is the potential between one of the conductors and the contact (). This thermal equilibrium, , and the current density , thus gives , which leads by integration to Eq. (1).
For many conductors, the Wiedemann-Franz law states thatHolm00
| (2) |
where V2/K2 is the Lorentz constant, is the Boltzmann constant, and is the electron charge. If we combine Eqs. (1) and (2) with , we can express the relation between and the applied voltage, , as
| (3) |
Equation (3) shows that the maximum temperature reached at the contact is independent of the contact geometry and of the materials in contact because both the electrical resistivity, , and the thermal conductivity, , are due to the conduction electrons, which leads to the temperature dependence given by Eq. (2).
A voltage near 0.4 V across a contact leads, from Eq. (3) and the value of , to a contact temperature near C (K) for a bulk temperature C ( K). A voltage –0.4 V thus leads from Eq. (3) to contact temperatures that exceed the melting point of most conducting materials. Efficient metallic bridges are therefore created by microwelding. Beyond the quantitative agreement with the experimental saturation voltage (see Sec. III.2 and Fig. 2), Eq. (3) also explains why is the relevant parameter in the experiments in Sec. III.2, and not the magnitude of the current. In addition, when approaches (see Fig. 2), the local heating of the microcontacts is enough, from Eq. (3), to melt them. Then their contact areas increase, thus leading to a decrease of the local resistance. When is reached, the microcontacts are welded, thus stabilizing the contact areas, the voltage, and the contact temperatures. The phenomenon is therefore self-regulated in voltage and temperature.
Our quantitative model describes only the electrical behavior of a welded contact, that is, when the saturation voltage is reached. It describes the reversible - reverse trajectory (when this contact is cooled by decreasing the current from , then eventually reheated by increasing .) The contact area is assumed to be constant because the contact has been welded, and .
Let us derive the analytical expression of the nonlinear - reverse trajectory.Falcon04bis We introduce the “cold” contact resistance present at currents sufficiently low so as to not cause any appreciable rise in the temperature at the contact. The bulk conductor is at the room temperature , with an electrical resistivity . The derivation of involves the same equipotential surfaces during a change between the “cold” state (denoted by a star) , and the “hot” state : the same current thus involves the same current density in both states, and thus . Note that an equipotential also is an isothermal. At thermal equilibrium, this equation and the differential expression of Eq. (1) give
| (4) |
We use Ohm’s law and integrate Eq. (4) between the isothermal surfaces and and findGreenwood58
| (5) |
The factor of two arises from heat flowing in parallel on both sides of the contact whereas the current uses these both sides in series. The temperature dependence of the thermal conductivity, , and electrical conductivity, , of the material in contact is given by Eq. (2) and
| (6) |
where is the temperature coefficient of the electrical resistivity.
Equations (2) and (6) let us find explicit expressions for and which can be substituted in Eq. (5). The reverse trajectory depends only on the temperature (that is, on ),
| (7) |
and finally gives (see the Appendix in Ref. Falcon04bis, for the details)
| (8) |
where and is the number of contacts in series in the chain. Note that only depends on the contact geometry, and its value is easily determined experimentally (see Sec. III.2).
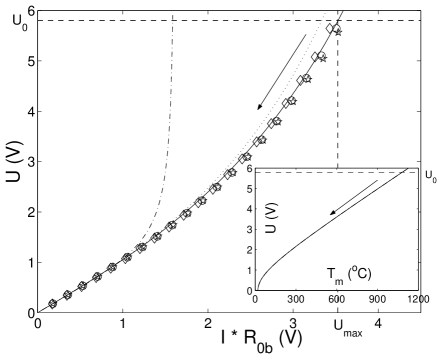
Because for pure metals (),Handbook the right-hand side of Eq. (8) does not depend explicitly on the geometry of the contact or on the metal used for the contact. However, for alloys the right-hand side of Eq. (8) depends on , the temperature coefficient of the electrical resistivity of the alloy. This additional parameter is related to the presence of defects in the material. The normalized - reverse trajectory (that is, as a function of in the inset of Fig. 2) are compared in Fig. 4 with the theoretical solutions, Eq. (8), for pure metals and for a stainless steel alloy. Very good agreement is found between the experimental results and the electro-thermal theory, especially for the alloy. Qualitatively, the alloy solution is closer to the experimental data than the solution for a pure metal. The agreement is even quantitatively excellent (see the solid line in Fig. 4). For this comparison, the value is equal to instead of (the value for AISI 304 stainless steel),Steel because the value of for the bead material (AISI 420 stainless steel) is unknown, but should be close to . During the experimental reverse trajectory, the equilibrium temperature, , of a microcontact also is deduced from Eq. (7) with no adjustable parameters (see the inset in Fig. 4). Therefore, when the saturation voltage is reached ( V), is close to C which is enough to soften or melt the microcontacts between the beads of the chain. We could say that our implicit measurement of the maximum temperature (based on the temperature dependence of the material conductivities) is equivalent to the use of a resistive thermometer.
IV Conclusions
Electrical phenomena in granular materials related to the electrical conduction transition such as the Branly effect have been interpreted in many different ways but without a clear demonstration. We have reported the observation of electrical transport through a chain of oxidized metallic beads under an applied static force. A transition from an insulating to a conducting state is observed as the applied current is increased. The - characteristics are nonlinear, hysteretic, and saturate to a low voltage per contact ( V). From this simple experiment, we have shown that the transition triggered by the saturation voltage arises from an electro-thermal coupling in the vicinity of the microcontacts between each bead. The current flowing through these spots generates local heating which leads to an increase of their contact areas, and thus enhances their conduction. This current-induced temperature rise (up to C) results in the microwelding of contacts (even for a voltage as low as 0.4 V). Based on this self-regulated temperature mechanism, an analytical expression for the nonlinear - reverse trajectory was derived, and was found to be in good agreement with the data. The theory also allows for the determination of the microcontact temperature through the reverse trajectory with no adjustable parameters. We could attempt to directly visualize this process with a microscope or infrared camera. But for this purpose a very powerful electrical source must be applied, far in excess of that necessary to produce true coherer phenomena (see for example Ref. Vandembroucq97, ).
Acknowledgements.
We thank D. Bouraya for the realization of the experimental setup, and Madame M. Tournon-Branly, the granddaughter of E. Branly, for discussions.References
- (1) E. Branly, “Variations de conductibilité sous diverses influences électriques,” C. R. Acad. Sci. Paris 111, 785–787 (1890).
- (2) E. Falcon, B. Castaing, and C. Laroche, “Turbulent electrical transport in copper powders,” Europhys. Lett. 65, 186–192 (2004).
- (3) G. Kamarinos, P. Viktorovitch, and M. Bulye-Bodin, “Instabilités de conduction dans les poudres métalliques,” C. R. Acad. Sci. Paris 280, 479–481 (1975).
- (4) R. Holm, Electrical Contacts (Springer-Verlag, Berlin, 2000), 4th ed.
- (5) R. Gabillard and L. Raczy, “Sur une expilcation possible de l’effet Branly,” C. R. Acad. Sci. Paris 252, 2845–2847 (1961); G. Salmer and R. Gabillard, “Sur la rapidité de fonctionnement du cohéreur de Branly,” C. R. Acad. Sci. Paris 262, 1043–1046 (1966).
- (6) D. Vandembroucq, A. C. Boccara, and S. Roux, “Breakdown patterns in Branly’s coheror,” J. Phys. III 7, 303–310 (1997).
- (7) S. Dorbolo, M. Ausloos, and N. Vandewalle, “Reexamination of the Branly effect,” Phys. Rev. E 67, 040302-1–4 (R) (2003).
- (8) E. Falcon, B. Castaing, and M. Creyssels, “Nonlinear electrical conductivity in a 1D granular medium,” Eur. Phys. J. B 38, 475–483 (2004).
- (9) B. Taylor, “Historical inspiration sparks off experimentation with coherers,” Phys. Educ. 39, 126–127 (2004).
- (10) H. Hertz, Electric Waves (Macmillan and Co., London, 1893) (reprinted by Dover, 1962).
- (11) D. T. Emerson, “The stage is set: Developments before 1900 leading to practical wireless communication,” Globecom Meeting of the IEEE, San Antonio, TX, 2001, <http://www.tuc.nrao.edu/demerson/ssetq.pdf>.
- (12) L. N. Kryzhanoskiĭ, “A history of the invention of and research on the coherer,” Sov. Phys. Usp 35, 334–338 (1992).
- (13) D. E. Hughes, “Prof. D. E. Hughes’s researches in wireless telegraphy,” The Electrician, May 5, 40–41 (1899), <http://godel.ph.utexas.edu/tonyr/electrician.pdf>.
- (14) J. A. Fleming, The Principles of Electric Wave Telegraphy (Longmans, Green and Co., London, 1906), pp. 353–417, and references therein.
- (15) J. F. Blatt, Principles of Physics (Allyn and Bacon, Boston, 1989), 3rd ed.
- (16) E. Branly, “Radioconducteurs à contact unique,” C. R. Acad. Sci. Paris 134, 347–349 (1902); ibid., “Résistance électrique au contact de deux disques d’un même métal,” C. R. Acad. Sci. Paris 127, 219–223 (1898); ibid., “Radioconducteurs à billes métalliques,” C. R. Acad. Sci. Paris 128, 1089–1095 (1899).
- (17) R. Bridgman, “Guglielmo Marconi: Radio star,” Physics World 14, (12) 29–33 (2001).
- (18) T. Tommasina, “Sur un curieux phénomène d’adhérence des limailles métalliques sous l’action du courant électrique,” C. R. Acad. Sci. Paris 127, 1014–1016 (1898); O. J. Lodge, “On the sudden acquisition of conducting-power by a series of discrete metallic particles,” Phil. Mag. 37, 94 (1894).
- (19) K. Guthe and A. Trowbridge, “On the theory of the coherer,” Phys. Rev. 11, 22–39 (1900); K. Guthe, “On the action of the coherer,” Phys. Rev. 12, 245–253 (1901).
- (20) K. J. Euler, “The conductivity of compressed powders. A review,” J. Power Sources 3, 117–136 (1978).
- (21) R. Holm, “On the history of the coherer invention,” Electric Contacts Handbook (Springer-Verlag, Berlin, 1958), 3rd ed., Sec. IV, pp. 398–406 ; R. Gabillard, “The Branly coherer and the first radiodetectors …Forbears of transistor?,” L’onde Electrique 71, 7–11 (1991); see also the Branly museum at <http://museebranly.isep.fr> and Refs. Emerson01, ; Kryzhanoskii92, and Fleming1906, .
- (22) V. J. Phillips, “The “Italian Navy coherer” affair: A turn-of-the-century scandal,” Proc. IEEE 86, 248–258 (1998); see Ref. Bridgman01, .
- (23) We used AISI 420. AISI alloy specifications are defined by the American Iron and Steel Institute.
- (24) J. A. Greenwood and J. B. P. Williamson, “Electrical conduction in solids. II. Theory of temperature-dependent conductors,” Proc. Roy. Soc. A 246, 13–31 (1958).
- (25) R. C. Weast, CRC Handbook of Chemistry and Physics (CRC Press, 1981), 60th ed.
- (26) Stainless Steel AISI 304 specifications at CERN, <http://atlas.web.cern.ch/Atlas/GROUPS/Shielding/jfmaterial.htm>.