Electronic structure of S-C6H5 self-assembled monolayers on Cu(111) and Au(111) substrates.
Abstract
We use first principles density functional theory to calculate the electronic structure of the phenylthiolate (S-C6H5) self-assembled monolayer (SAM) on Cu(111) and Au(111) substrates. We find significant lateral dispersion of the SAM molecular states and discuss its implications for transport properties of the molecular wire array. We calculate the two photon photoemission spectra and the work function of the SAM on Cu(111) and compare them with the available experimental data. Our results are used to discuss assignments of the observed spectral data and yield predictions for new electronic states due to the monolayer not yet accessed experimentally.
pacs:
71.15.Mb, 73.20.At, 73.40.Ns, 78.68.+mI Introduction
Recently there has been increased interest in the possibility of using organic molecules as electronic components in nanoscale devices. One of the most important issues is the role of molecule-metal contact. The charge injection at the metal-molecule interface is usually modelled by the energy dependent probability for a substrate electron to tunnel to the molecular wire. The magnitude of the tunnelling probability depends on lineup of the molecular wire electronic states and the metal Fermi level. When a closely packed array of molecular wires is formed on the metal electrode, the molecular states form bands dispersive in the lateral direction. This suggests that the tunnelling probability in addition to the energy of the injected electron depends also on the lateral component of the electron wavevector.
The change of the metal work function due to a self-assembled Monolayer (SAM) may be employed in device applications to assist the charge injection into the molecular wire Phaedon . The work function of a crystal surface has generally two contributions Lang : (1) the electrostatic barrier due to the distortion in the charge distribution at the surface and (2) the many-body effects of the screened hole. It is important to know the relative contributions of the two components for the successful design of molecular electronic devices.
In this paper we present Density Functional Theory (DFT) calculations of the electronic structure of SAMs of phenylthiolate (PT = -S-C6H5) on noble metal substrates Cu(111) and Au(111). We find significant lateral dispersion of the molecular electronic states derived from the molecular orbitals of the SAM. Our calculations aim to address three essential questions: (1) what are the molecular states closest to metal Fermi level and therefore the most important for transport properties; (2) how large is the lateral dispersion of those states; (3) what is the largest contribution to the workfunction change associated with SAM formation, for which we find the electrostatic contribution from the polar molecules as determined by the dipole moment of the isolated array of molecules in addition to that of the bare metal surface. In addition we calculate two-photon photoemission (2PPE) spectra using DFT wavefunctions and the work function of the SAM/Cu(111) system to compare with the experiments by Zhu et. al. Zhu .
II Method of calculation
We use the full potential linearized augmented plane wave (FP-LAPW) method Singh1 with local orbital extensions Singh2 in the WIEN2k implementation Blaha . The GGA Perdew exchange-correlation potential was used. Well-converged basis sets were employed with a 4.7 Ry plane wave cut off. Five special k-points were used to sample the two dimensional Brillouin zone. The surface plane was taken as the plane. We used slab calculations based on a super cell with three metal layers covered on one side by a PT monolayer for electronic structure calculations, and six metal layers with both sides covered for work function calculations. The PT monolayer is of the so called type Schreiber , with one molecule per three substrate surface metal atoms. The former are arranged in a triangular lattice with side , where is the side of the triangular lattice formed by metal atoms in the (111) plane. For =Au and Cu, the corresponding cross-section area for molecule is, respectively, 21.6 Å2 and 16.9 Å2 Schreiber ; Leung . The cross-sectional mean area of a PT molecule (when directed normal to the substrate) is 21.1 Å2, slightly less than the above value based on the Au substrate, thus indicating the possibility of a small degree of tilt Schreiber ; Leung , whereas no tilt is expected in the case of the Cu substrate.
The geometry of the molecular array has been fully relaxed on an unrelaxed substrate with metal atoms in ideal crystal positions. The monolayer on the Au substrate was found tilted by 180, consistent with related experimental data Leung . In the calculation, the PT molecule was constrained so as to maintain intramolecular symmetry geometry . The lowest-energy binding site was the Au-Au bridge, analogous to the case of alkanethiols studied by Selloni et. al. Selloni . The S atom height is 2.1 Å. Starting with alignment normal to the substrate, with the projection of the PT plane parallel to a nearest-neighbor Au-Au vector, the PT was tilted in the direction perpendicular to its plane (tilting in the orthogonal direction caused a sharp rise in energy). The calculated tilt relaxation energy per molecule ( to ) was of the order of at room temperature, indicating the likelihood of appreciable thermal fluctuations, similar to the situation noted in Schreiber ; Leung .
In the case of the Cu substrate we find zero tilt angle for the monolayer due to the close spacing controlled by the Cu lattice constant, with the lowest energy when sulfur binds to the hollow site. The height of the S atom is 1.73 Å. The binding energy for the bridge site is higher by 170 meV. The frozen lattice approximation used here may cause a shift of the energy difference in binding energy of a few tens of meV for different adsorption sites, but it should not affect much the work function and the shape of the dispersion curves.
III Band structure results
The electronic structure along the high symmetry direction of the 2D Brillouin zone is shown in Fig. (1a) for the PT SAM on Cu(111). In order to distinguish which bands originate from the SAM and which are due to the metallic substrate we calculate projected density of states of each band inside the spheres surrounding the atoms of the PT molecule Singh1 ; Singh2 . The Cu surface states were identified by the similarities of the band dispersion of the covered and clean Cu(111) three layer substrates shown on Fig. (1b). At least seven molecular bands due to the SAM can be identified. These molecular bands can be characterized by (1) the energy at the -point, (2) the effective mass for the -M direction in cases where a parabolic fit of the dispersion in the vicinity of the point is possible, (3) the bandwidth defined as the energy difference between the M and the point, and (4) the major atomic contributions. These band characteristics are summarized in Table 1.
| band | EΓ (eV) | meff | EM-EΓ (eV) | Character | |||
| SAM/Cu | SAM | SAM/Cu | SAM | SAM/Cu | SAM | ||
| 1 | -4.0 | -3.6 | 3.7 | 3.86 | Cs | ||
| 2 | -2.7 | -1.9 | -1.5 | Ct | |||
| 3 | -1.1 | 0.30 | -2.0 | -1.0 | S | ||
| 4 | -0.75 | 0.35 | -2.0 | -1.2 | -0.88 | S | |
| 5 | 1.0 | 1.6 | 0.4 | 0.35 | 3.8 | 3.8 | Cs |
| 6 | 2.8 | 3.7 | -0.4 | 1.0 | Ct | ||
| 7 | 4.0 | 5.0 | -0.3 | -0.8 | -1.8 | -2.0 | Ct |
| SSo | -0.9 | 0.4 | Cu | ||||
| SSu | 1.7 | Cu | |||||
| SAM/Au | SAM | SAM/Au | SAM | SAM/Au | SAM | ||
| 1 | -2.4 | -2.2 | 0.55 | 0.8 | 1.6 | 1.5 | Cs |
| 2 | -2.4 | -2.1 | -0.2 | Ct | |||
| 3 | -0.98 | 0.13 | -2.3 | -2.7 | -0.2 | S | |
| 4 | -0.85 | 0.09 | 1.6 | -3.9 | -0.3 | S | |
| 5 | 2.75 | 2.9 | 1.0 | 0.95 | 1.2 | 1.1 | Cs |
| 6 | 4.1 | 3.9 | 0.9 | Ct | |||
| 7 | 4.1 | 4.3 | -0.6 | -1.2 | -1.0 | Ct | |
| SSo | -0.45 | 1.7 | Au | ||||
| SSu | 1.4 | 0.5 | Au | ||||
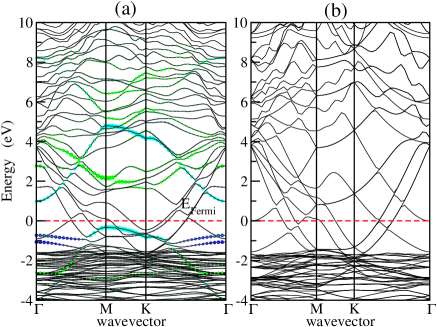
For the copper substrate the molecular levels closest to the Fermi level are the two HOMO’s (bands 3 and 4), which are of S (3p) character. They have a very small dispersion (of about 0.2-0.3 eV) and the parabolic fits result in large effective masses (-2.0 ). The second occupied state (SSo, at -0.9 eV) and the second unoccupied state (SSu, at 1.7 eV) are surface states, which are at energies 0.0 eV and -1.6 eV, respectively, on the clean substrate in Fig. (1b). The discrepancy with the experimental value of the -0.4 eV surface state energy at point is due to the finite size effect of our three layer slab geometry Euceda . The largest lateral dispersion is due to the bands 1 and 5 originating from the side phenyl carbons (Cs for short). (The minimal separation between such atoms on neighboring PT molecules is 2.61 Å.) The molecular bands 2, 6, and 7 are mainly due to the next to sulfur and top carbon atoms (Ct for short). These Ct atoms form the longest intermolecular contacts and the lateral dispersion of the Ct-type bands is not significant compared to that of side carbon Cs-type bands. There are certainly more electronic states in the band structure due to the SAM, as is evident from the band count in Fig. (1), but these are high energy states (relative to Fermi level) and are not important for the conduction properties of the monolayer. These states are also well delocalized in space such that projected density of states inside the muffin tin spheres does not give a unique identification of the molecular bands. As will be clear in Section IV, the band 6 at 2.8 eV (the point) and one at 6 eV have the largest contribution to the 2PPE intensity and thus are candidates for the peaks observed by Zhu et. al. Zhu .
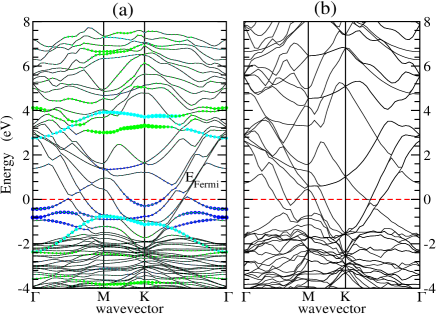
When the PT is attached to the gold substrate, the bandwidths of all molecular levels are narrower than for the Cu case, because the nearest neighbor distance between the molecules is larger due to the larger lattice constant of the underlying substrate. The Cs atoms on neighboring molecules of the SAM (18% tilted on Au) are separated by at least 3.13 Å from each other, whereas Ct carbons are 5.0 Å apart (i.e., ). The electronic band structures of the SAM/Au(111) and the clean Au(111) surfaces are shown in Fig. (2). The band assignments are summarized in table (1). As in the case of the SAM on Cu, the two nearly degenerate sulfur-based HOMO’s (bands 3 and 4) are the molecular levels closest to the Fermi level. As the lattice constant increases (in proceeding from Cu to Au), the direct exchange mechanism responsible for the negative effective mass decays faster than the substrate mediated mechanism (see below). This causes the sign of the effective mass of one of the sulfur bands to become positive on the Au substrate. The most dispersive Cs bands 1 and 5 have bandwidth smaller by a factor of 2.5 than for the Cu substrate. The occupied surface state SSo is strongly hybridized with the sulfur 3p orbitals.
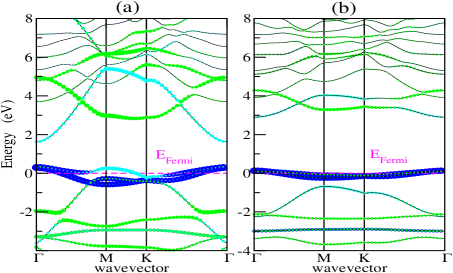
The lateral dispersion has two contributions the direct overlap between the molecules and the substrate mediated interaction. To estimate the relative importance of the two mechanisms for the band dispersion we compare the lateral dispersions obtained for the PT arrays in the absence of the substrates (infinitely separated from the substrate), but maintaining the same geometry as determined with the substrate present. In this case the band structure shown in Fig. 3 has only a direct contribution. The signs of the dispersions for bands 3 and 4 are negative and the bandwidth is smaller for the Au(111) case (Fig. (3b)). In both cases the dispersion of the sulfur bands is larger in the absence of the substrate. This suggests that substrate-mediated interactions have an effect on the bandwidth opposite to that from the direct exchange. When the lattice constant is relatively large (i.e. the Au case), the substrate-mediated interaction even changes the sign of the band 4 dispersion. The coupling of the Cs atoms to the substrate is much smaller, so that substrate-mediated interaction in bands 1 and 5 is responsible for only 10% of the total bandwidth.
IV 2PPE spectra
The electronic structure of the organic SAM can be directly probed in the 2PPE experiment Zhu2 . There are three electronic states involved in the 2PPE spectra: initial (i), intermediate (k), and the final (f). If one of those states is localized and has the largest dipole matrix element in comparison with the rest of the states, then three scenarios are possible for the variation of kinetic energy () with respect to the excitation photon energy , which is chosen to be less than the workfunction of the substrate: (1) ; (2) , and (3) invariance with respect to . For PT on Cu(111), two cases are reported Zhu : case(2) in which the intermediate state (i) is assigned as a LUMO lying below the vacuum at 3.3 eV and case(3), in which the final state (f) is assigned as a LUMO lying above the vacuum at 6.4 eV (relative to EFermi). Case (1), corresponding to an initial HOMO state and was not observed in Zhu .
In the present work we use DFT wavefunctions to calculate the 2PPE spectra at the -point. We find two states to contribute most to the 2PPE intensity: a LUMO (band 6) at 2.8 eV (of Ct carbon character) and high energy bands at around 6.0 eV, whose character is complex due to hybridization of molecular and Cu states. This assignment is consistent with the conclusion drawn in Zhu based on similarities of spectra taken for SAMs based on PT and alkanethiolates of different lengths.
There are two possible 2PPE excitation mechanisms: direct and indirect. In the direct process with one-color pump and probe laser frequencies, the 2PPE intensity for -light polarization is Madelung ; Wolf :
| (1) |
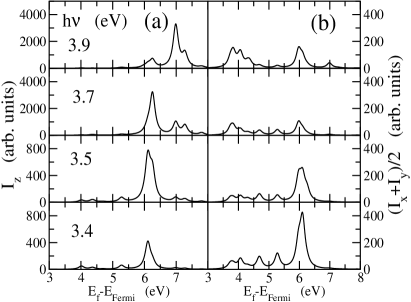
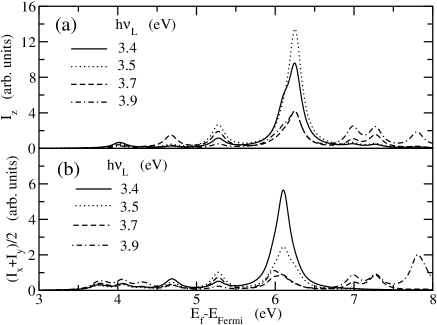
where is the lifetime broadening of intermediate level and a denotes the Cartesian component(x,y,or z). The sum over intermediate states in Eq. (1) includes interference effects. The delta function may be replaced by a Lorentzian to mimic the lifetime of the final state and the width of the laser pulse. The result for the -point is shown in Fig. 4 where intensity contributions Eq. (1) are summed over all initial states i. The calculated curves were convoluted with a Lorentzian function ( eV) to account for the spectrometer resolution. We use intermediate and final level lifetimes eV. There is one pronounced peak at about 6.0 eV, whose intensity is resonant with the laser frequency at about 3.6 eV. As the excitation frequency increases the intensity transfers to higher energy final states ( eV). The resonance enhancement factor is sensitive to the choice of the damping parameters, and even for the large value (0.1 eV) used in Fig. (4), the intensity of the out-of-plane polarization varies by an order of magnitude. The resonance effect is related to the large dipole matrix element between the occupied surface state SSo and the second LUMO (band 6) separated by 3.7 eV. For the in-plane polarization there is no strong laser frequency dependence of the 2PPE intensity, because there is no single pair of states which dominates the sum in Eq. (1). Therefore the ratio of the out-of-plane and the in-plane polarizations in the direct mechanism model should be resonant with the laser frequency.
In the indirect mechanism the intermediate level can be populated by some incoherent process, for example, by the tunnelling of the photoexcited electron from the substrate to the molecule. In the second step, a photon promotes the photoexcited electron to the vacuum with probability given by the one photon absorption crossection:
| (2) |
where Fermi-Dirac factors require that the intermediate and final states are empty and the intermediate state is less than one quantum of photon energy above the Fermi level . It is assumed that all the intermediate states k have the equal lifetimes and probabilities to be excited in the first step. The result for the two polarizations and the same damping parameters as in direct process is shown in Fig. 5. There are no pronounced resonances and the ratio of intensities for the out-of-plane and the in-plane polarizations is relatively independent of the laser frequency. Namely, the ratios of the integrated peak intensities at 6 eV for 3.4, 3.5, 3.7, and 3.9 are 1.8, 4.6, 3.8, and 4.0 respectively. This is consistent with the experimentally reported value of at eV Zhu . Comparison of our analysis with the available experimental data Zhu leads us to suggest that the most likely mechanism for the two photon photoemission process is indirect. An enhancement of 2PPE intensity with the laser frequency was observed for SCH3 on Ag(111) by the Harris group Harris . This is may be the same effect we find here for the direct mechanism.
V Work function calculation
For the work function calculations we use a six Cu layer substrate covered with a SAM on both sides. The inversion symmetry of the supercell with two equivalent surfaces forces the net dipole and the electrostatic potential drop in the vacuum region to be zero. To separate the electrostatic and exchange correlation contributions to the work function we calculate the averaged surface dipole moment by integrating over the net charge density of the half unit cell:
| (3) |
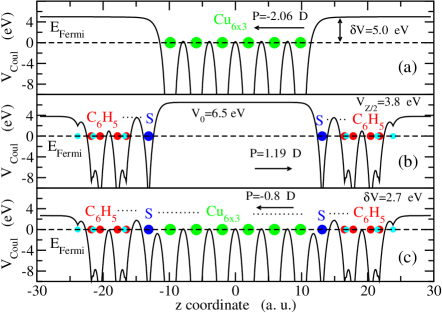
where and are valence electron and ion charge densities respectively. The planes and contain the inversion centers of the supecell. The Coulomb potential averaged in the lateral direction is shown on Fig. 6 along with that for the clean substrate and the two SAM arrays in the absence of the substrate for the same geometry. The work function of the clean Cu(111) is found to be 5.0 eV, in good agreement with the experimental value of 4.9 eV. The work function of the covered substrate is reduced to 2.7 eV compared with the experimental value of 3.7 eV Zhu .
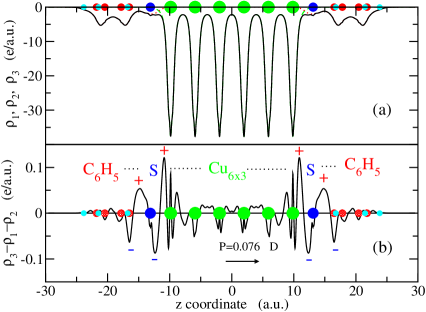
The isolated SAM layer has surface dipole (Debye/molecule), and the expected Coulomb potential drop of eV (where Å2 is the lateral area per molecule) agrees well with the actual result eV (see Fig. (6b)). Analogously we define the electrostatic contribution to the clean Cu surface workfunction to be eV (see Fig. (6a)). This leaves a 0.4 eV contribution due to exchange-correlation effects. In the case of the SAM on Cu, the net surface dipole is approximately equal to the sum of dipoles of the clean Cu surface and the isolated SAM array Debye. The difference between the simple estimate and the actual result ( Debye) is due to the charge transfer at the interface. The laterally averaged charge densities are shown in Fig. (7a). The charge transfer electron density shown in Fig. (7b) is very small (less then 0.1 per molecule). We calculate the workfunction change of the covered substrate to be -2.3 eV, where -2.8 eV is the electrostatic and 0.5 eV is the exchange-correlation contribution,respectively.
As we have shown the electrostatic contribution to the workfunction change can be immediately estimated from the dipole moment of the isolated SAM array. However, the isolated SAM dipole moment itself is not equal to that of isolated molecule. We have used the molecular NRLMOL code Mark and find the dipole moment of the S-C6H6 molecule to be 3.33 Debye. This value is threefold larger than the dipole per molecule in the array, 1.19 Debye. We have also performed constrained calculations by forcing occupations of two nearly degenerate HOMO orbitals: (in the molecular plane (xz)) and (perpendicular to the molecular plane). The unconstrained spin restricted ( ie, pure doublet) calculation results in 1.88 electrons in and 1.12 electrons in orbitals, with a net dipole moment of 3.33 Debye. By forcing the orbital to be fully occupied the net dipole moment drops to 1.24 Debye,very close to the SAM value. This suggests that the charge redistribution between the two HOMO orbitals in the SAM is the primary effect on the net dipole moment.
VI Discussion and Conclusions
We have calculated the electronic structure of the phenylthiolate (PT=S-C6H5) SAM on Cu(111) and Au(111) substrates. We identified four HOMO’s and three LUMO’s for each system. A sulfur-type HOMO (band 4) is the closest to the Fermi level for both substrates. It has two competing contributions to the lateral dispersion: (1) the direct exchange between the neighboring orbitals leads to a negative effective mass, whereas (2) the substrate-mediated interaction gives a positive effective mass contribution. The overall sign of the effective mass is changed from a negative to a positive value in going from the Cu to the Au substrate. The most dispersive molecular bands are of ’side carbon’ character (Cs). The significant lateral dispersion of the electronic states derived from molecular orbitals of the SAM suggests that the charge injection probability depends on the lateral component of the wavevector as well as the energy of the injected electron. This implies that the conductance of N molecules in an array is not simply N times the conductance of one, but further theoretical and experimental work is needed to quantify the lateral dispersion effect on transport.
We have calculated the 2PPE spectra of a PT SAM on Cu(111) using the DFT wavefunctions. In the direct mechanism we predict a very strong resonance of the 2PPE intensity for out-of-plane polarization. For the in-plane polarization only small intensity variation with laser frequency is found. For the indirect mechanism we find a moderate intensity dependence on the excitation photon energy for both polarizations with a nearly constant ratio of the out-of-plane to the in-plane signals of about 3-4 , consistent with related experimental rsults Zhu . This fact suggests that the indirect mechanism contributes the most intensity to the 2PPE resonance observed in Zhu ( designated as resonance A). The energy positions of the observed molecular states at 6.4 eV and 3.4 eV are in reasonable correspondence with our calculated values of 6.0 eV and 2.8 eV,respectively. These molecular states are mainly due to LUMOs dominated by the PT carbon atoms adjacent to the S atoms.
Calculation of the workfunction for the PT-SAM on Cu(111) yields a value of 2.7 eV, which may be compared with the experimental value of 3.7 eV. To reconcile theory and experiment one may assume a lower coverage of the SAM in the experimental system. The larger effective area per molecule reduces the surface dipole moment and hence the Coulomb contribution to the workfunction change. According to our calculations one has to assume Å2 to agree with experiment. This estimate is much larger than that for the structure, which implies Å2. Alternatively, the interpretation of the workfunction measurements in one photon photoemission spectra can be complicated if there is an exit barrier for substrate electrons to tunnel through the interface. Then the onset of the one-photon photoemission signal may be due to the finite energy electrons with respect to the vacuum level. This in turn would imply that the agreement between the theory and the experiment for the energies of the LUMO orbitals measured in 2PPE is accidental. Indeed DFT is known to underestimate the bandgaps in semiconductors. On the other hand the energy differences between the empty states are more reliable in DFT and in the experiment the energy difference between the two LUMO’s is also independent of the workfunction value. We find an electrostatic contribution to the work function change of 2.8 eV ( associated with SAM formation) to be the dominant effect. Therefore the dipole moment of the molecular SAM in the absence of the metal substrate can be used to predict the the workfunction change of the covered substrate provided the charge transfer and correlation effects do not contribute much to the workfunction change as in the case studied here.
Acknowledgements.
The computations were performed on the BNL galaxy cluster. We are grateful to Mike Weinert, Ben Ocko, and X.-Y. Zhu for helpful discussions. This work was supported in part by DOE Grant No. DE-AC-02-98CH10886.References
- (1) Current address: IBM Research Division, T. J. Watson Research Center, Yorktown Heights, New York 10598
- (2) X. Cui, M. Freitag, R. Martel, L. Brus, and P. Avouris, Nano Lett. 3, 783 (2003).
- (3) N. D. Lang, in Solid State Physics, edited by Seitz, Turnbull, and Ehrenreich 28 Academic Press, New York 1973 p. 225.
- (4) T. Vondrak, H. Wang, P. Winget, C. J. Cramer, and X.-Y. Zhu, J. Am. Chem. Soc. 122, 4700 (2000).
- (5) D. J. Singh, Planewaves, Pseudopotentials and the LAPW Method (Kluwer Academic, Boston, 1994).
- (6) D. J. Singh, Phys. Rev. B 43, 6388 (1991).
- (7) P. Blaha, K. Schwarz, and J. Luitz, in Proceedings of WIEN97 (Techn. Universität Wien, Austria, 1999).
- (8) J. P. Perdew, K. Burke, and M. Ernzerhof, Phys. Rev. Lett. 77, 3865 (1996).
- (9) See review by F. Schreiber, Prog. in Surf. Sci. 65, 151 (2000).
- (10) T. Y. B. Leung, P. V. Schwartz, G. Scoles, F. Schreiber, A. Ulman, Surf. Sci. 458, 34 (2000).
- (11) The symmetry constrain leaves the following internal degrees of freedom for a) the bondlengths: S-C1 = 1.792 Å, C1-C2 = 1.402 Å, C2-C3 = 1.396 Å, C3-C4 = 1.398 Å, C2-H = 1.090 Å, C3-H = 1.091 Å, C4-H = 1.090 Å and for b) the bond angles: SC1C2=119.70, C1C2C3=119.40, C1C2H=119.90, C2C3C4=120.50, C2C3H=119.30, C3C4H=120.10.
- (12) M. C. Vargas, P. Giannozzi, A. Selloni, and G. Scoles, J. Phys. Chem. B 105, 9509 (2001).
- (13) A. Euceda, D. M. Bylander, and L. Kleinman, Phys. Rev. B 28, 528 (1983)
- (14) X.Y. Zhu, Annu. Rev. Phys. Chem. 53, 221 (2002).
- (15) O. Madelung, in Introduction to Solid-State Theory, edited by M. Cardona, P. Fulde, and H.-J. Oueisser (Springer Series in Solid-State Sciences 2, Springer, Berlin 1981) p. 276.
- (16) M. Wolf, A. Hotzel, E. Knoesel, and D. Velic, Phys. Rev. B 59, 5926 (1999).
- (17) A. D. Miller, K. J. Gaffney, S. H. Liu, P. Szymanski, S. Garrett-Roe, C. M. Wong, and C. B. Harris, J. Phys. Chem. A 106, 7636, (2002).
- (18) N. W. Ashcroft and N. D. Mermin, in Solid State Physics (Saunders, Philadelphia, 1976) p. 354.
- (19) M. R. Pederson and K. A. Jackson, Phys. Rev. B. 41, 7453 (1990); K. A. Jackson and M. R. Pederson, Phys. Rev. B. 42, 3276 (1990); M. R. Pederson and K. A. Jackson, Phys. Rev. B. 43, 7312 (1991); D. V. Porezag and M. R. Pederson, Phys. Rev. B. 54, 7830 (1996); A. Briley, M. R. Pederson, K. A. Jackson, D. C. Patton, and D. V. Porezag, Phys. Rev. B. 58, 1786 (1998).