Dynamics of Domain Growth in Self-Assembled Fluid Vesicles
Abstract
The dynamics of phase separation in multi-component bilayer fluid vesicles is investigated by means of large-scale dissipative particle dynamics. The model explicitly accounts for solvent particles, thereby allowing for the very first numerical investigation of the effects of hydrodynamics and area-to-volume constraints. We observed regimes corresponding to coalescence of flat patches, budding and vesiculation, and coalescence of caps. We point out that the area-to-volume constraint has a strong influence on crossovers between these regimes.
pacs:
87.16.-b, 64.75.+g, 68.05.CfApart from partitioning the inner and outer environments of the cell, biomembranes also act as support for complex and specialized molecular machinery, crucial for various physiological functions and trans-membrane transport alberts . It is believed that membranes maintain in-plane compositional organization that is essential for its function. Though biological membranes are very complex and can in general be far from equilibrium, knowledge of the equilibrium properties of simple model membranes will be extremely useful in providing understanding of this molecular machinery. Such a study should also be essential for developing new applications involving liposomes. This has recently resulted in a surge of theoretical and experimental investigations on domain formation in multicomponent vesicles lipowsky92 ; lipowsky93 ; taniguchi96 ; kumar96 ; kumar98 ; kumar01 ; bagatolli01 ; veatch02 ; baumgart03 .
The dynamics of in-plane demixing of multicomponent vesicles into coexisting phases is richer than its counterpart in bulk systems. There are several reasons for this: (i) the phase separation process is strongly coupled to the shape dynamics of the vesicle, (ii) the viscosities of the lipid bilayer and that of the embedding solvent are different, and (iii) the membrane can be impermeable to solvent, resulting in a constraint on the vesicle area-to-volume ratio. The purpose of this letter is to investigate the effect of the above on the dynamics of multicomponent fluid vesicles.
Phase separation of vesicles following a quench to the two-phase region has previously been considered by means of a generalized time-dependent Ginzburg-Landau model taniguchi96 , and dynamic triangulation Monte Carlo model kumar96 ; kumar98 ; kumar01 . The later study showed a marked departure of the phase separation in multicomponent fluid vesicles from their Euclidean counterparts as a result of coupling between curvature and composition. In particular, it was shown that at intermediate times, the familiar labyrinth-like spinodal network breaks up into isolated domains kumar96 ; kumar98 . In the case of a tensionless closed vesicle, at late time these domains reshape into buds connected to the parent vesicle by very narrow necks kumar01 . Further domain growth proceeds via Brownian motion of these buds and their coalescence.
Recent advances in experimental techniques, like the two photon fluorescence and confocal microscopy, has made it possible to study phase separation on fluid vesicles bagatolli01 ; veatch02 ; baumgart03 . These experiments reported structures with many domains which are more akin to caps than fully developed buds. A natural question then is: Does coarsening in multicomponent fluid vesicles proceed via a kinetic pathway similar to that predicted by the recent simulations?
Previous studies of the dynamics of phase separation in fluid membranes did not take into account the following important features of a real lipid vesicle: (i) the presence of solvent,(ii) the constraint of area-to-volume ratio and (ii) the freedom to vesiculate. We report here the first large scale simulation of phase separation dynamics of a fluid vesicle model that accounts for these features. This study, based on dissipative particle dynamics (DPD), finds that the dynamics at all times is affected by the presence of the solvent, and that the late time shape of the vesicle corresponds to that of a surface decorated with caps.
Within the DPD approach hoogerbrugge92 , the vesicle is formed from the self-assembly of individual particles in an explicit solvent. The model parameters are chosen such that the membrane is impermeable to the solvent, thus allowing us to investigate the effect of conservation of both vesicle’s area and encapsulated volume. A lipid particle is modeled as a simple flexible amphiphilic chain built with four DPD particles; one hydrophilic particle, simulating the lipid head group (), and three hydrophobic particles, simulating the lipid hydrophobic part (). The heads of the two types of lipids are denoted by or and their tails are denoted by or . Water particles are denoted by . We focus on the case where interactions are symmetric under exchange of and components, thus ensuring no explicit coupling between local composition and local curvature.
The position and velocity of each particle are denoted by . Their time evolution is governed by Newton’s equations of motion gerhard . There are three types of pairwise additive forces acting on a particle by a particle : (i) a conservative force, , (ii) a dissipative force, and (c) a random force, . The conservative force between two particles and is given by where we choose for and for such that the forces are soft and repulsive. Here , and is the cutoff radius for the interaction. The hydrophobic and hydrophilic interactions emerge from the relative interaction strengths . With this, the parameters chosen for the simulation are
| (1) |
where sets the energy scale. The interaction parameters are chosen such that the amphiphiles self-assemble into bilayers and the two types of lipids are in the strong segregation regime. A lipid particle integrity is ensured via a harmonic interaction between consecutive monomers within a chain given by , where is a positive spring constant, and is a preferred bond length. We use and . The dissipative force originating from “friction” between particles is given by, where is a friction parameter and . The random force is given by , where, is the time step in units of with being the mass of a single DPD particle. All particles in our simulation have the same mass. Here, is a symmetric random variable with zero mean and unit variance, uncorrelated for different pairs of particles and at different time. The dissipative and random forces are related to each other through the fluctuation dissipation theorem, leading to the relation . Unless otherwise specified, we used a fixed value for all interacting pairs. The pairwise nature of the dissipative and random forces ensures local momentum conservation leading to correct long-range hydrodynamics pagonabarraga98 .
In our simulation the following parameters were used and . With the parameters chosen, the estimated bending modulus, , and line tension, , are in reasonable agreement with estimates for lipid membranes lipowsky95 . We use lipid chains in a simulation box of with DPD-particle number density of . The number of water particles inside the vesicle, when it is not deflated, is about . The total number of DPD particles corresponds to 1,536,000 computer_time .

Bilayers and vesicles can be self-assembled in a DPD simulation yamamoto02 ; yamamoto03 . In order to save computer time, we prepare our vesicles starting from an almost closed configuration, composed of a single lipid component, and allow it to equilibrate. This approach, allows for the equilibration of the lipid surface density within the two monolayers through the edge of the membrane. We find that the vesicle closes within about 50,000 DPD steps. Within this model parameters, we found that the number of solvent particles inside the vesicle and the number of lipid particles in the inner and outer leaves of the vesicle remain constant. This implies that the vesicle is impermeable to the solvent and flip-flop events are rare. The vesicle prepared in this manner is found to be nearly spherical with about solvent particles inside it. We refer to configurations with this inner volume as case-I. A vesicle with excess area can then be prepared by transferring a certain amount of solvent particles from its inner to outer regions. We refer to as case-II the equilibrated configurations obtained after of the inner solvent particles are transfered. We found that in case-II, as well as in case-I, the solvent density is the same inside and outside the vesicle.
To study the phase separation, we randomly label each lipid particle in the bilayer as type or , such that the relative composition in each layer is the same. Coarsening is subsequently monitored by computing the distribution of cluster sizes of the minority component and the total interface length between the domains. We will focus on the case of off-critical quenches with the volume fraction of the B-component equal to 0.3.
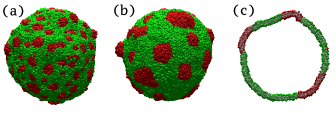
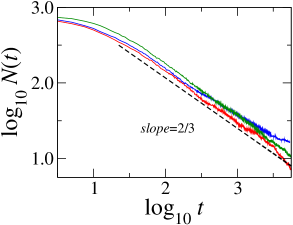
Snapshots of the time evolution of two component vesicles in cases I and II are shown in Figs. 1 and 2, respectively. As shown in Fig. 1 (c), domains on either side of the membrane are in register. This inter-layer alignment since early stages of the phase separation dynamics. The net interface length is shown in Fig. 3. During relatively early times, in both cases I and II, domains are flat circular patches. The net interface length, , during this regime is independent of the area-to-volume ratio, and has the form , with , as shown in Fig. 3. In this regime, the number of clusters on the vesicle, , is also found to obey a power law, , with . This is depicted in Fig. 4.
Since the amount of and components on the membrane are conserved, we have , where is the average domain size and is the total area occupied by the patches. Since the patches are flat . Thus one expects . The data shown in Figs. 3 and 4 are consistent with this relation. If the diffusion coefficient of disks moving on the membrane depends on the domain size as then coalescence of domains leads to and furukawa85 . These exponents can also be the result of evaporation-condensation mechanism, as predicted by Lifshitz and Slyozov lifshitz62 . However, we could monitor many events of patch coalescence in our simulation. We thus believe that the mechanism of domain growth during this regime is coalescence of patches comment .
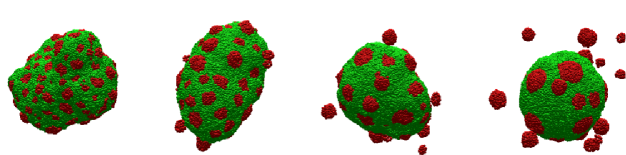
After about , the dynamics in cases I and II clearly departs from each other, as shown in Fig. 3. In case-I, although there are some caps formed, coarsening proceeds mainly through coalescence of flat circular patches (see Fig. 1). Further capping is suppressed by the lateral tension on the membrane due to volume constraint. Similar capping-induced tension was also seen in earlier Monte Carlo simulations kumar98 . In case-II, where there is more excess area, domains reshape into caps. The presence of excess area allows a fraction of the caps to further reshape into buds which then vesiculate. The buds vesiculate during a short time implying that the energy barriers involved are very small. We confirm this by performing simulations on a vesicle with large excess area having a single component domain occupying of the total area. Once the bud is formed, it is found to vesiculate within a time period of . This budding and vesiculation results in a marked decrease in the net interface length over a short period of time as shown in Fig. 3. Pinching mechanism of vesicles was recently studied in detail using DPD simulations yamamoto03 .
All detached vesicles are composed of the component. Budding occurs towards both inner and outer regions of the vesicles, although most buds are found in the outer region. Inward budding is due to the bilayer nature of the vesicles and cannot be observed if the vesicle is modeled by a single surface. In the absence of explicit coupling between mean curvature and composition, inward vesiculation of a -domain results when the area of the domain on the inner monolayer exceeds its area on the outer monolayer.
Vesiculation results in a reduction of area-to-volume ratio of the parent vesicle leading it to acquire a more spherical shape. The lateral tension resulting from this prevents further increase in curvature of caps. Coarsening now proceeds via coalescence of these caps. Since patch and cap coalescence, in a viscous medium, lead to the same exponent, , we do not see any marked change in the behavior of the curve shown in Fig. 4 for case-II. During this regime, the net interface length , as shown in Fig. 3. The exponent is between that due to coalescence of flat patches, i.e. , and that due to coalescence of buds having an interface length independent of the bud size, i.e. kumar01 . As can be seen in Fig. 2, domains remaining on the vesicle typically have a shape closer to a hemispherical cap than a complete bud. In this case, the average interface length of a cap, , where is the cap area. In the absence of further vesiculation, is a constant of time. We thus obtain for the net interface length , consistent with our numerical results shown in Fig. 3.
Now, let us discuss the effect of line tension on domain growth in case-II. For a given -cap of area , surrounded by the -phase, the bending energy of the cap scales with its radius of curvature, , as . Since the perimeter of the domain decreases with decreasing , the cap adopts a shape with finite curvature. The domain area beyond which capping occurs is around . Let be the time required to reach this capping regime. Beyond , domain growth proceeds via cap coalescence. In the presence of enough excess area, as in case-II, this coalescence may lead to caps with interface length comparable to the thickness of the bilayer. Vesiculation may then proceed yamamoto03 .
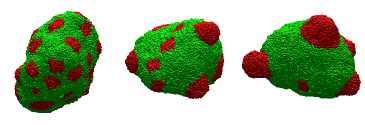
For a , and , there is an area of the cap around beyond which a complete bud is formed, provided that there is enough excess area. Let be the average time necessary to reach this area. During the period between and , growth should be mediated by coalescence of caps. In case-II, discussed above, is too short to numerically detect this regime. We therefore performed another set of simulations with a reduced value of the line tension, achieved by choosing the interaction parameter for and pairs to be , Corresponding snapshots are shown in Fig. 5. As can be seen from this figure, vesiculation does not occur even at very late times. However, well defined caps with finite curvature are prominent. The net interface length shows a clear crossover between the patch coalescence regime and caps coalescence regime, as shown in Fig. 3.
In summary, we presented here the very first study of phase separation dynamics of self-assembled bilayer fluid vesicles with hydrodynamic effects. We found rich dynamics with crossovers that depend strongly on area-to-volume ratio and line tension between the two coexisting phases. In particular, we found that vesiculation, when it happens, occurs during a short period of time. Another feature that was not possible to account for in earlier simulations but has important consequences is the volume constraint. As a result of tension induced by this constraint, the main vesicle eventually acquires a spherical shape decorated with caps, irrespective of initial area-to-volume ratio, a result seemingly born out in recent experiments bagatolli01 ; veatch02 ; baumgart03
The authors would like to thank O.G. Mouritsen and L. Bagatolli for useful discussions. We thank M. Rao and G.I. Menon for critical comments. MEMPHYS is supported by the Danish National Research Foundation. Part of the simulations were carried out at the Danish Center for Scientific Computing.
References
- (1) Molecular Biology of the Cell (3rd Ed.) by B. Alberts et al. (Garland Publishing, New York, 1994).
- (2) R. Lipowsky, J. Phys. II 2, 1825 (1992);
- (3) F. Jülicher and R. Lipowsky, Phys. Rev. Lett. 70, 2964 (1993); Phys. Rev. E. 53, 2670 (1996).
- (4) T. Taniguchi, Phys. Rev. Lett. 76, 4444 (1996).
- (5) P.B. Sunil Kumar and M. Rao, Mol. Cryst. Liq. Cryst. 288, 105 (1996).
- (6) P.B. Sunil Kumar and M. Rao, Phys. Rev. Lett. 80, 2489 (1998).
- (7) P.B. Sunil Kumar, G. Gompper, and R. Lipowsky, Phys. Rev. Lett. 86, 3911 (2001).
- (8) C. Dietrich et al., Biophys. J. 80, 1417 (2001).
- (9) S.L. Veatch and S.L. Keller, Phys. Rev. Lett. 89, 268101 (2002).
- (10) T. Baumgart, S.T. Hess, and W.W. Webb, Nature (London) 425, 821 (2003).
- (11) P.J. Hoogerbrugge and J.M.V.A. Koelman, Europhys. Lett 19, 155 (1992).
- (12) G. Besold, I. Vattulainen, M. Karttunen and J. M. Polson, Phys. Rev. E. 62 R7611, (2000).
- (13) I. Pagonabarraga, M.H.J. Hagen, and D. Frenkel, Europhys. Lett. 42, 377 (1998).
- (14) Structure and Dynamics of Membranes, R. Lipowsky and E. Sackmann (Eds.) (Elsevier, Amesterdam, 1995).
- (15) A run up to 100,000 DPD time steps takes 330 cpu hours on a 3.0 GHz Pentium IV. Data shown are averages over six independent runs for each case.
- (16) S. Yamamoto, Y. Maruyama, and S.-A. Hyodo, J. Chem. Phys. 116, 5842 (2002); J. C. Shillcock and R. Lipowsky, J. Chem. Phys. 117, 5048 (2002);
- (17) S. Yamamoto and S.-A. Hyodo, J. Chem. Phys. 118,7893 (2003).
- (18) H. Furukawa, Adv. Phys. 34, 703 (1985).
- (19) I. L. Lifshitz and V.V. Slyozov, J. Phys. Chem. Solids 19, 35 (1962).
- (20) Diffusivity of circular patches in a purely two-dimensional fluid is independent of the size of the patches leading to . However, disk like patches diffusing on the membrane surface also experience drag caused by the embedding solvent above and below the disk leading to . For a related discussion, see A.J. Levine, T.B. Liverpool, and F.C. MacKintosh, Phys. Rev. Lett. (in press). In order to ensure that the arguments above are correct, we reduced the drag with solvent by reducing the friction coefficient for all interactions involving at least one solvent particle, and found that the growth exponent approaches at intermediate times laradji04 .
- (21) M. Laradji and S. Kumar, to be published.